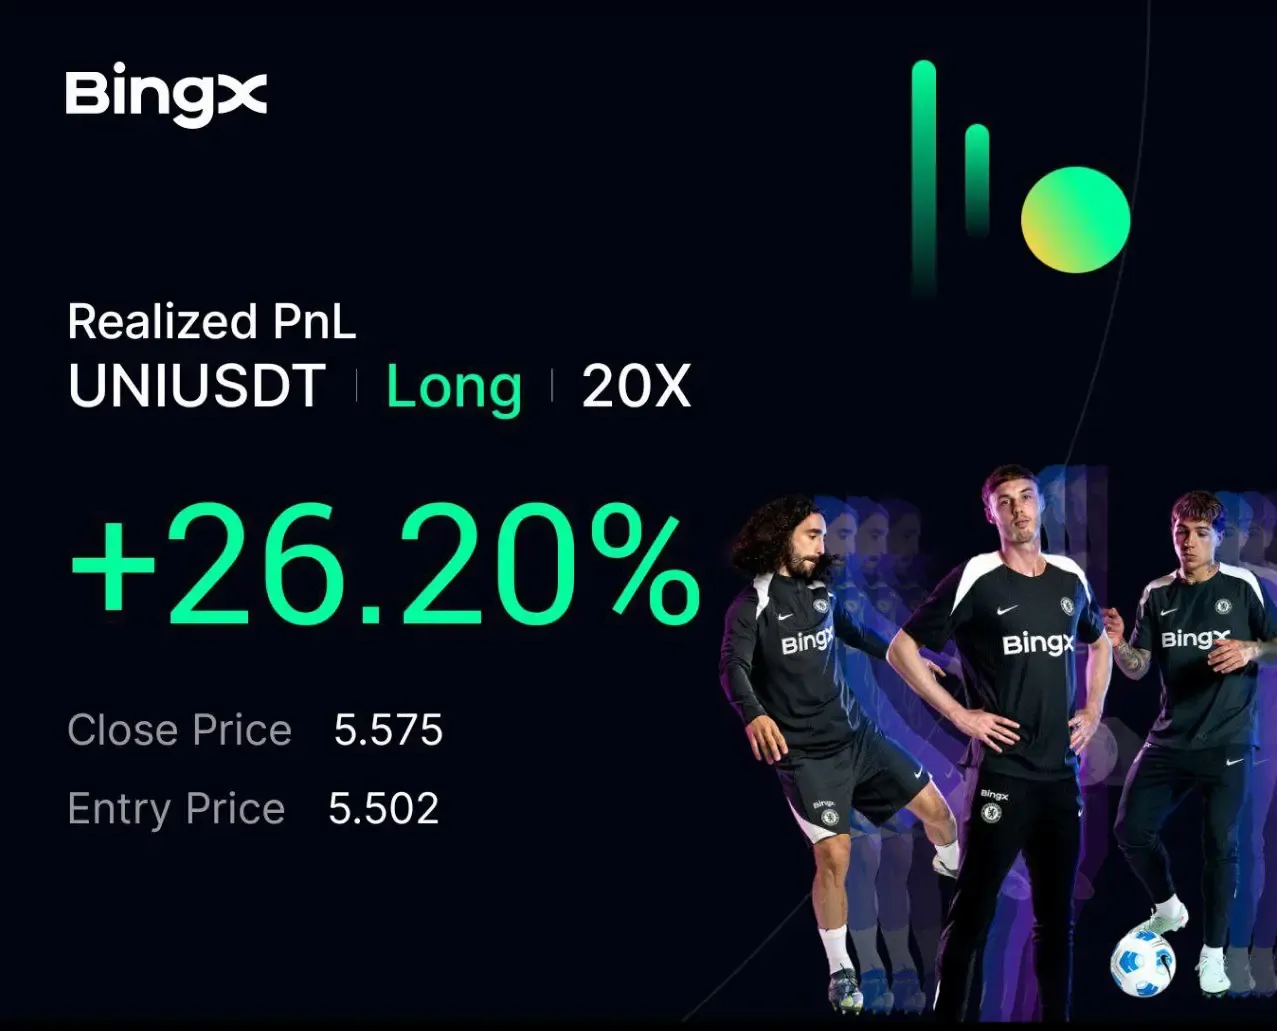
UNI +26.2%. Дейтрейдинг (Направленная стратегия Resonance)

Быстрая сделка UNI по логике спрос/предложение: давление продавца есть, результата нет. Разбор кластеров и лимитной активности — пошагово.
Содержание

Очень быстрая сделка. Отлично подходит для тех, кто торгует внутри дня (дейтрейдинг). Упор — на проторгованные объёмы и лимитную активность: всё то, что показывает кластерный график.
Монета была отобрана через скринер криптовалют на таймфрейме 5 минут. Внимание привлекло сильное снижение актива и преобладание продаж, которые перестали влиять на цену. Когда есть давление, а результата нет — это означает, что спрос поглощает предложение.
Причины входа в позицию
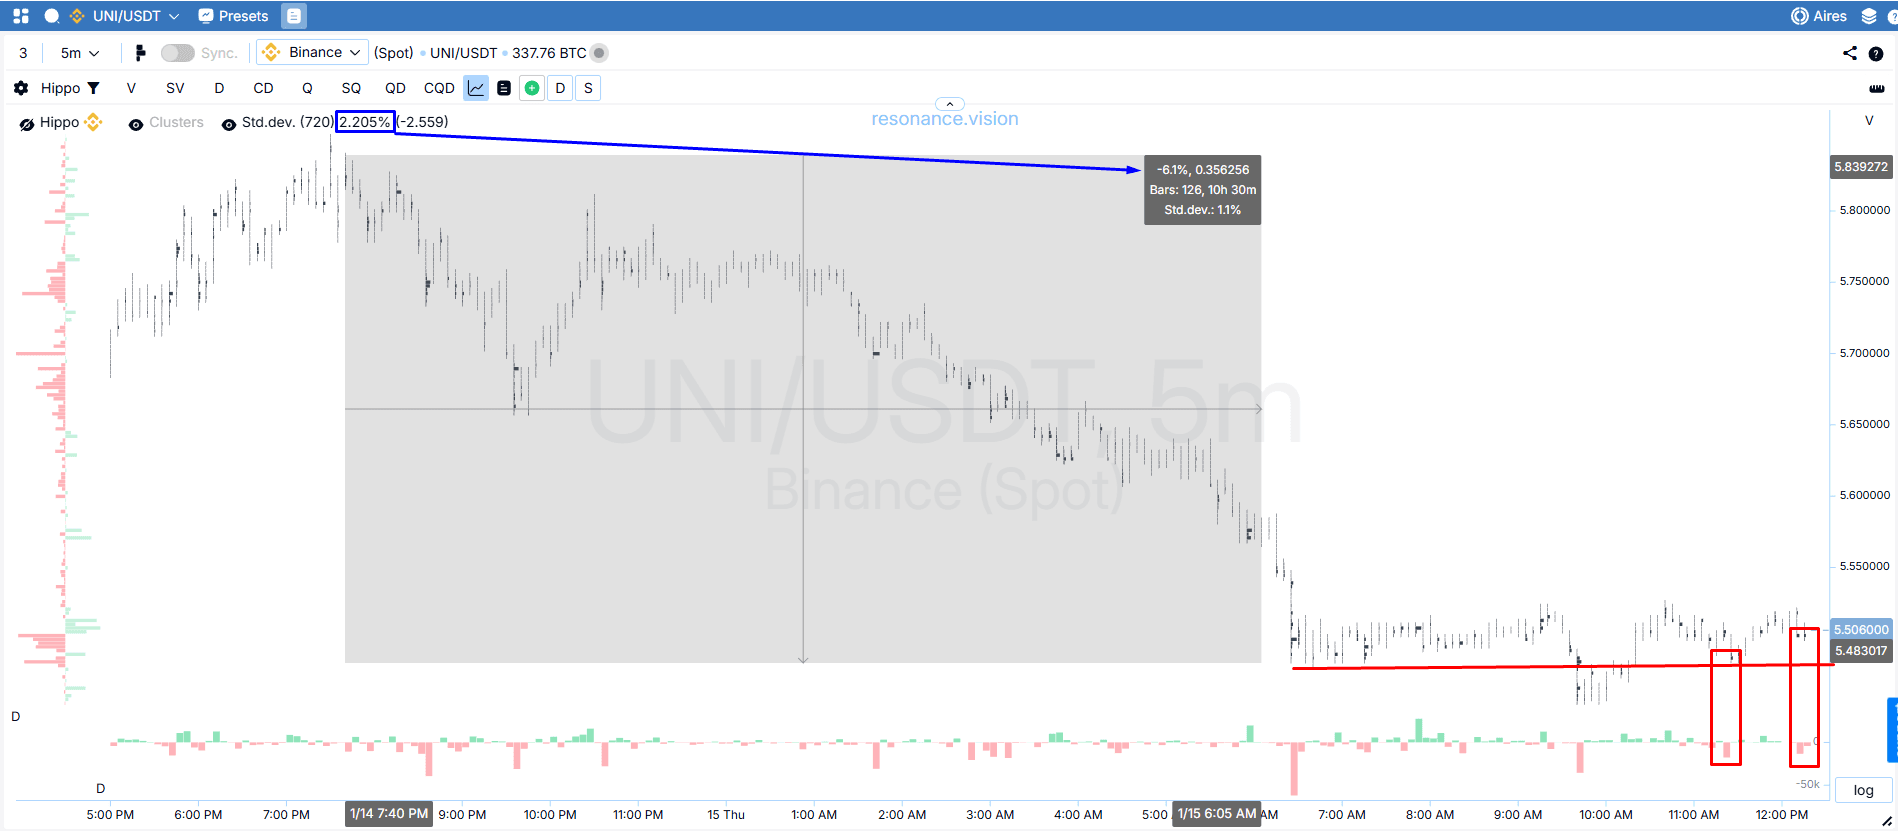
Кластерный график: падение цены монеты и последующий “слом эффективности продаж”
Падение актива составило 6%, что соответствует 3 стандартным отклонениям (синяя стрелка).
На кластерном графике начал формироваться боковик (красная линия), и отчётливо видно, что продажи лимитно сдерживаются, а локальные минимумы не обновляются (красные прямоугольники).
Зачастую это говорит о локальном дефиците и повышает вероятность отскока. Именно здесь и был выполнен вход — с очень коротким стопом за последнее удержание продаж.
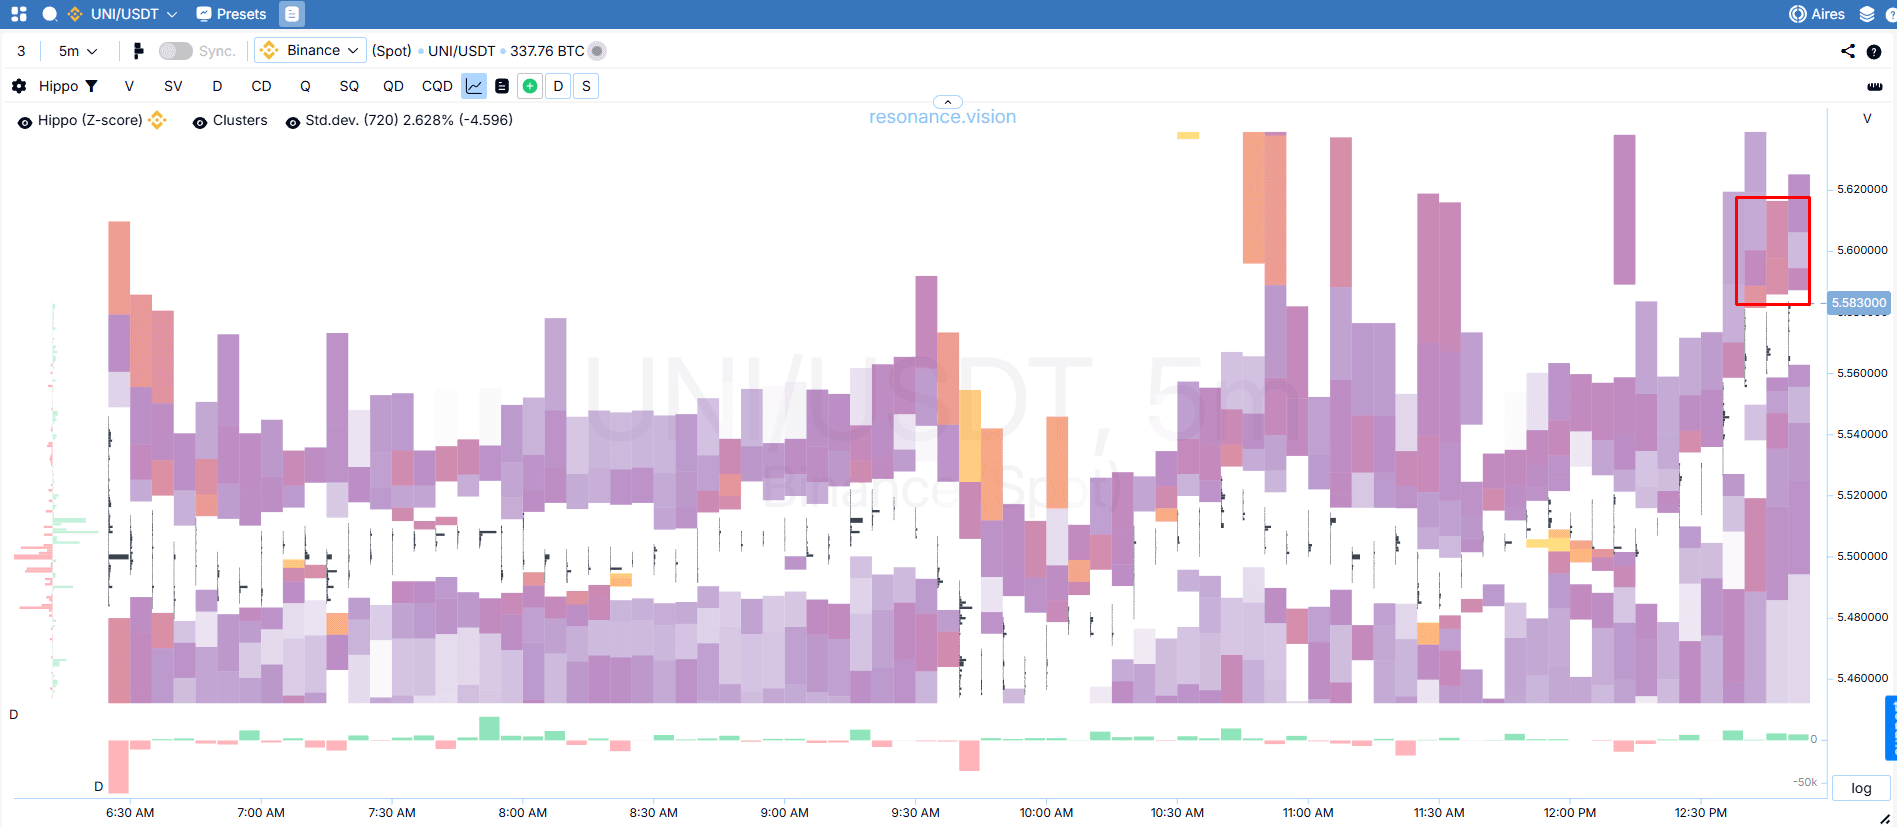
Причины выхода
Тепловая карта: на росте цены начали появляться лимиты на продажу (красный прямоугольник). Было принято решение зафиксировать позицию: лимитные заявки будут препятствовать дальнейшему продвижению, и это повышает вероятность снижения актива.
Результат по сделке
Возможно, удалось забрать всего 1,3% чистого движения, но благодаря короткому стопу соотношение вышло больше, чем 1 к 2.
После сильного падения мы увидели формирование локального дефицита — благодаря оценке влияния объёмов на цену. Вход выполнен на неэффективных продажах.
Следи за новыми статьями в нашем телеграм канале.
Не нужно выдумывать сложных схем и искать “грааль”. Используй инструменты платформы Resonance.
Регистрируйся по ссылке — получай бонус и начинай зарабатывать:
OKX | BingX | KuCoin.
Промокод TOPBLOG дает тебе 10% скидки на любой тарифный план Resonance.
Рекомендуемые статьи


