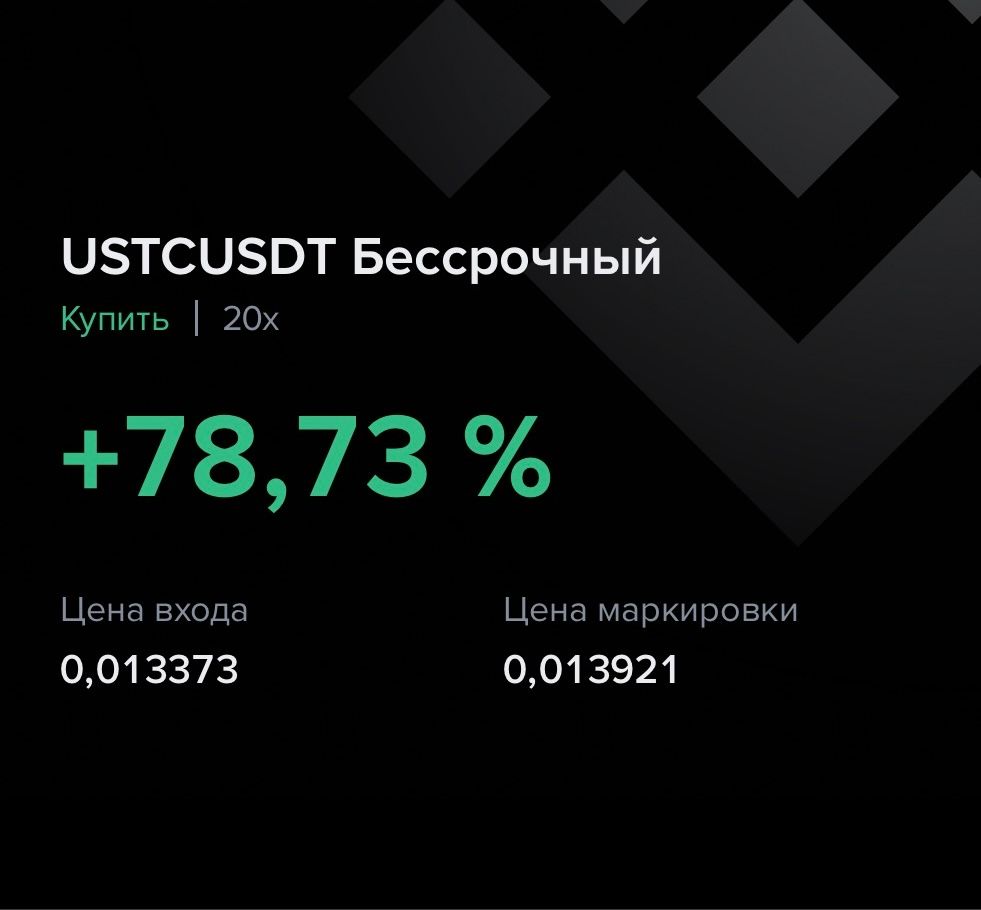
USTC +78,73% (Напрямкова стратегія Resonance)

Розбір угоди щодо USTC/USDT: як ознаки локального дефіциту та активність лімітного покупця допомогли взяти +78,7% руху та вчасно зафіксувати прибуток.
Зміст

Монета: USTC/USDT
Ризик: середній
Рівень розуміння: новачок
Причини входу
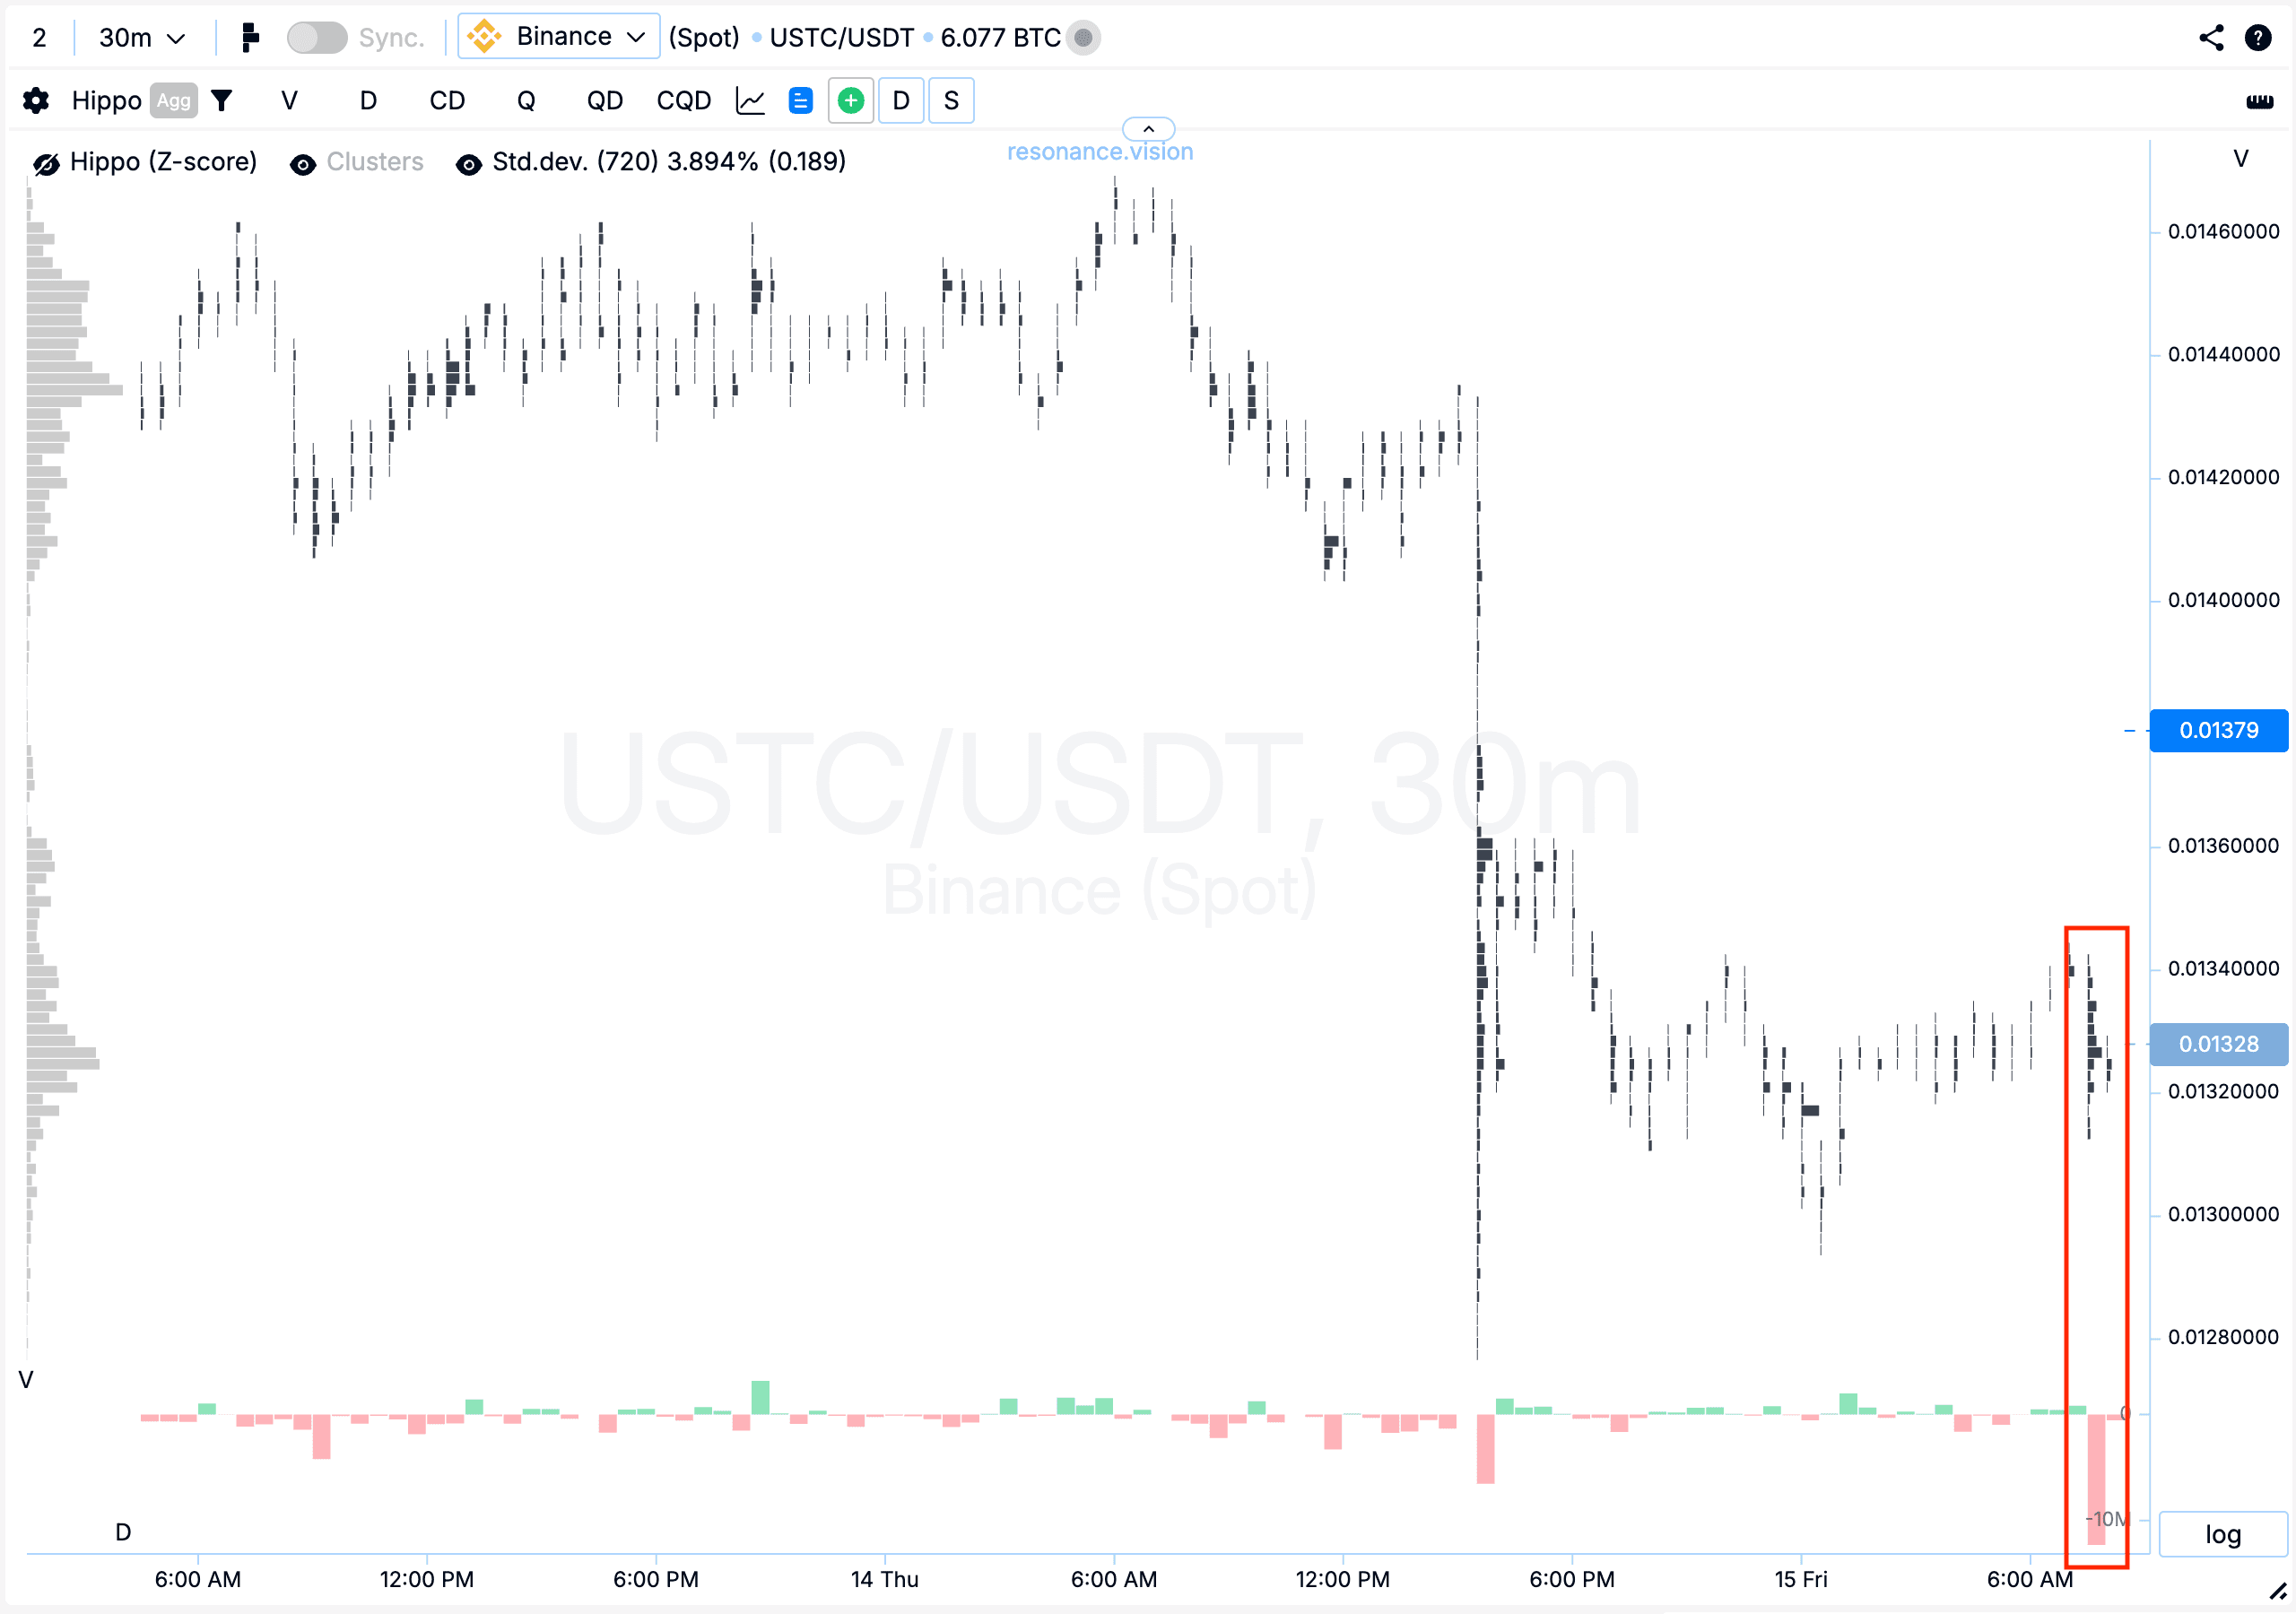
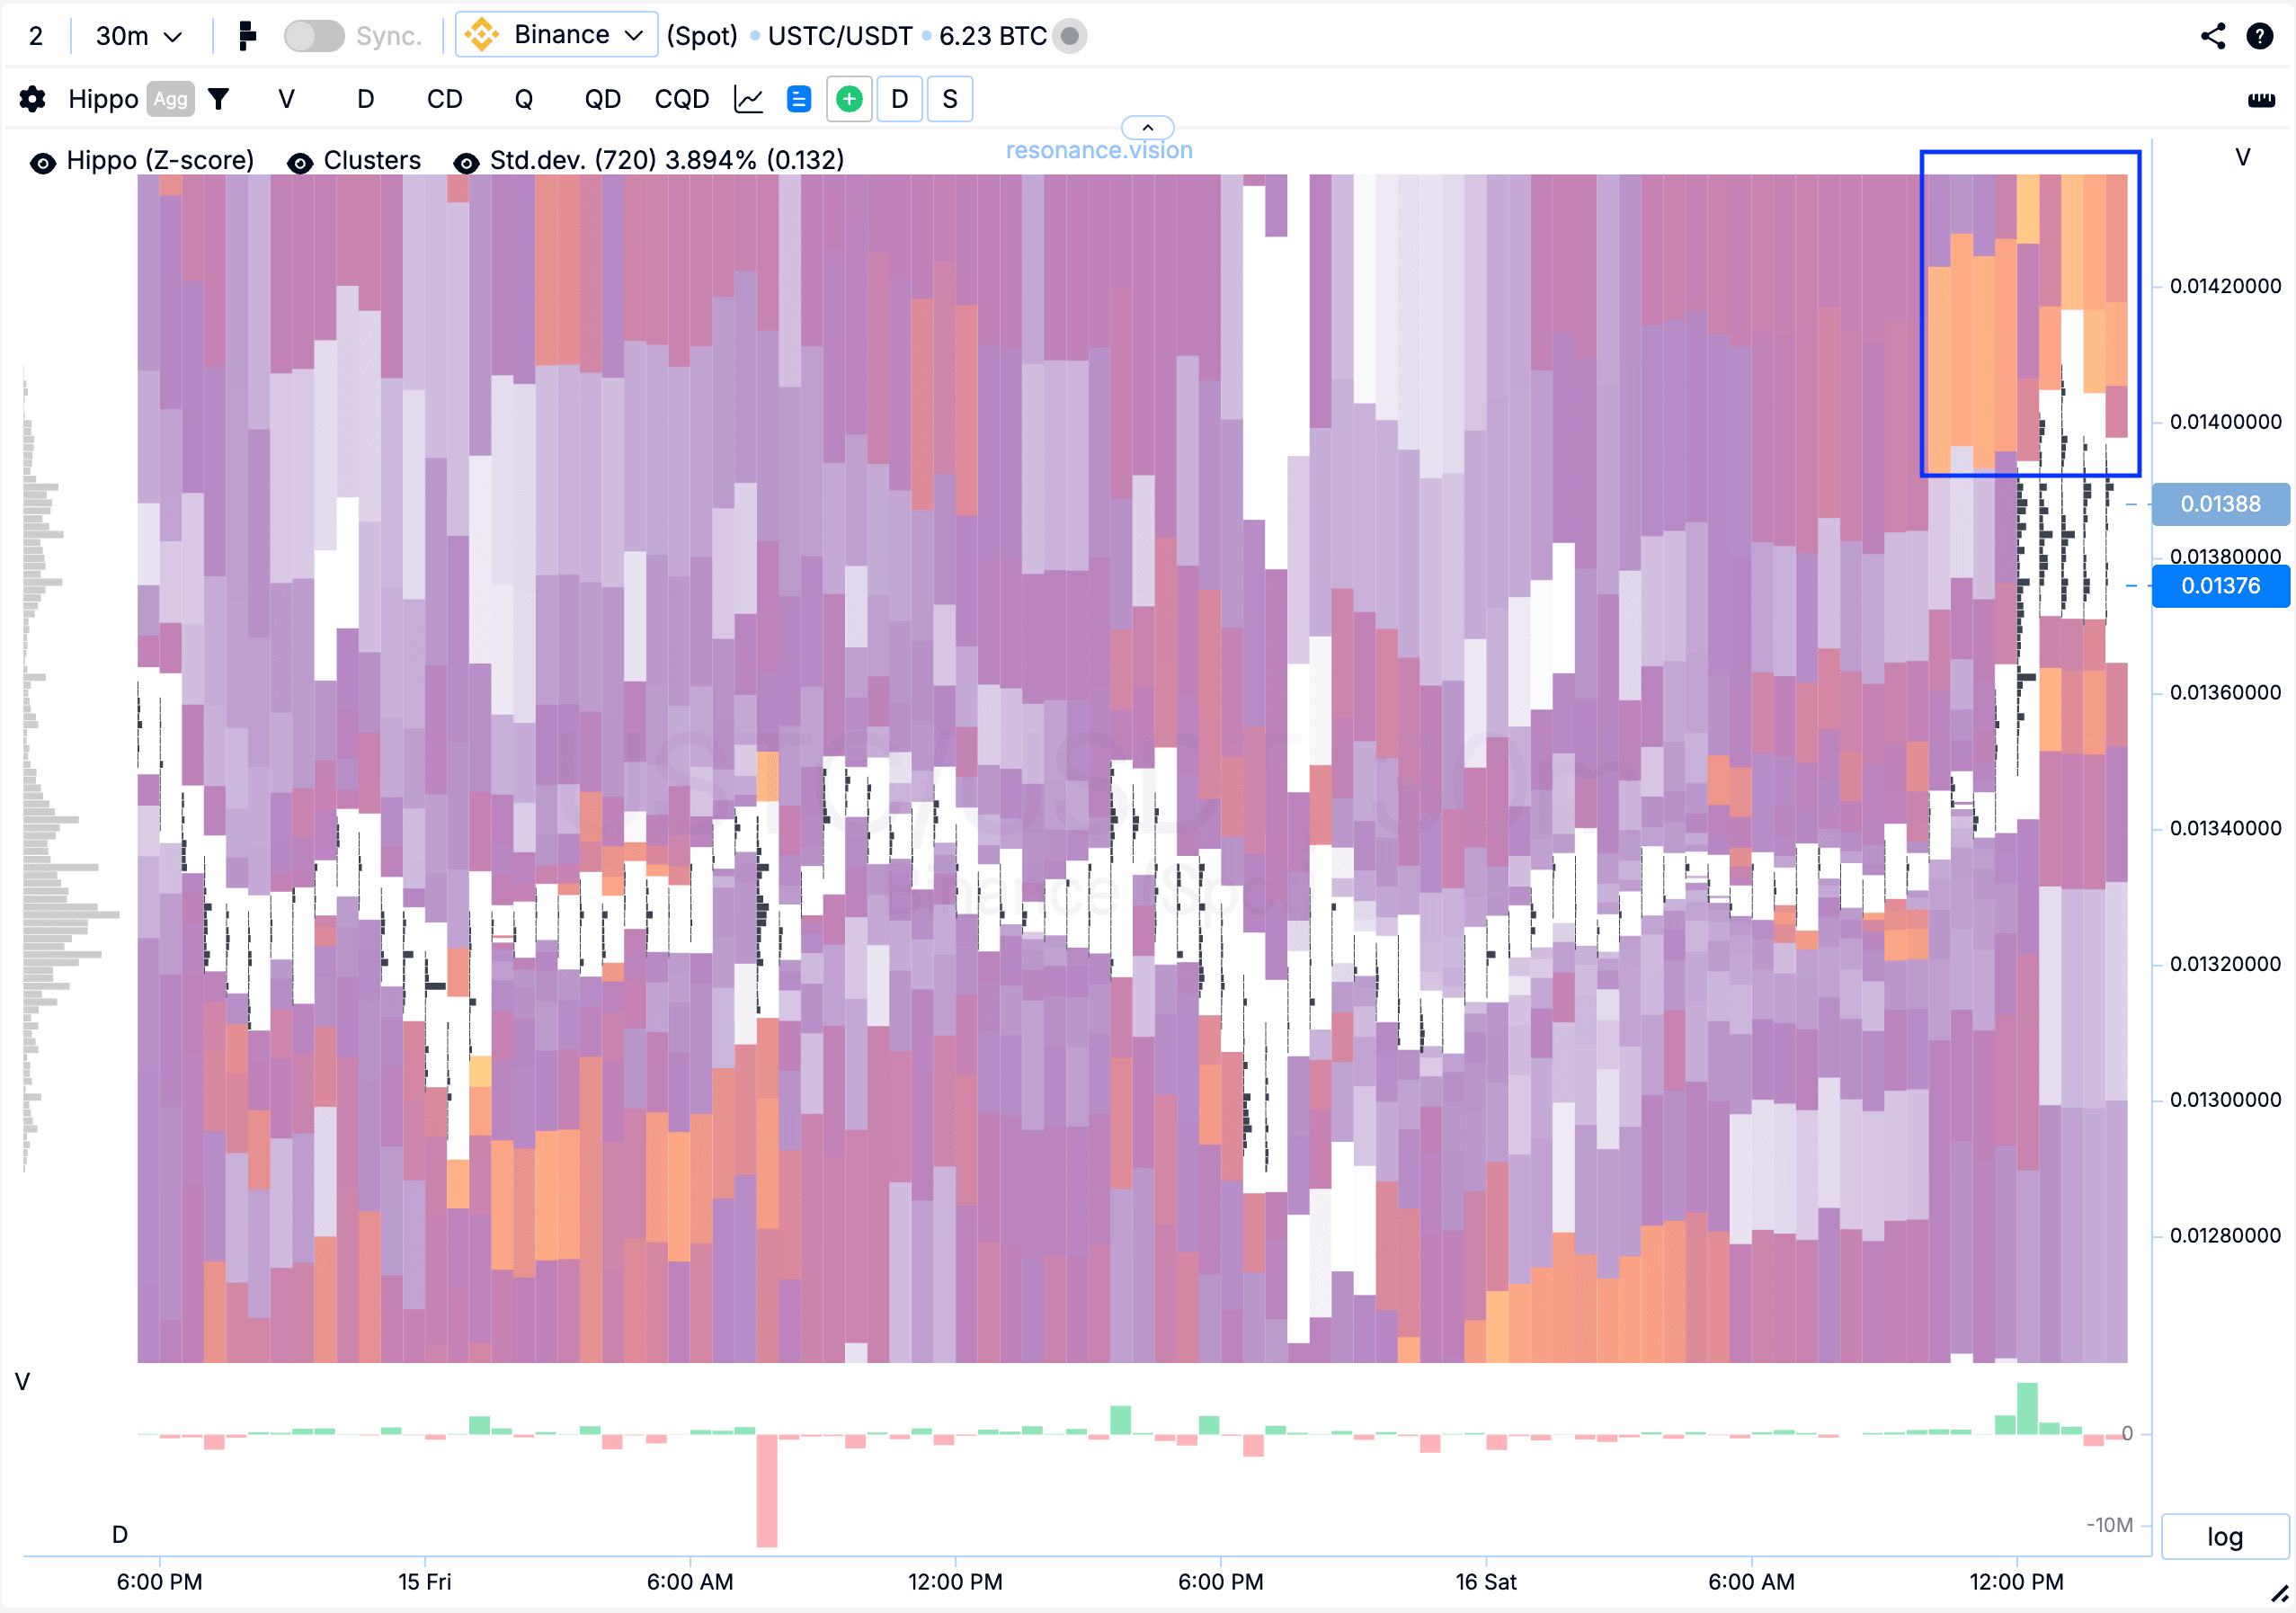
Кластерний графік: Після імпульсного зниження почали накопичуватися значні об’єми, при цьому по дельті чітко видно, що переважали продажі (червоний прямокутник), проте ціна не показала очікуваного продовження падіння. Тиск продавців у якому немає реакції на ціну, свідчить про ознаки локального дефіциту.
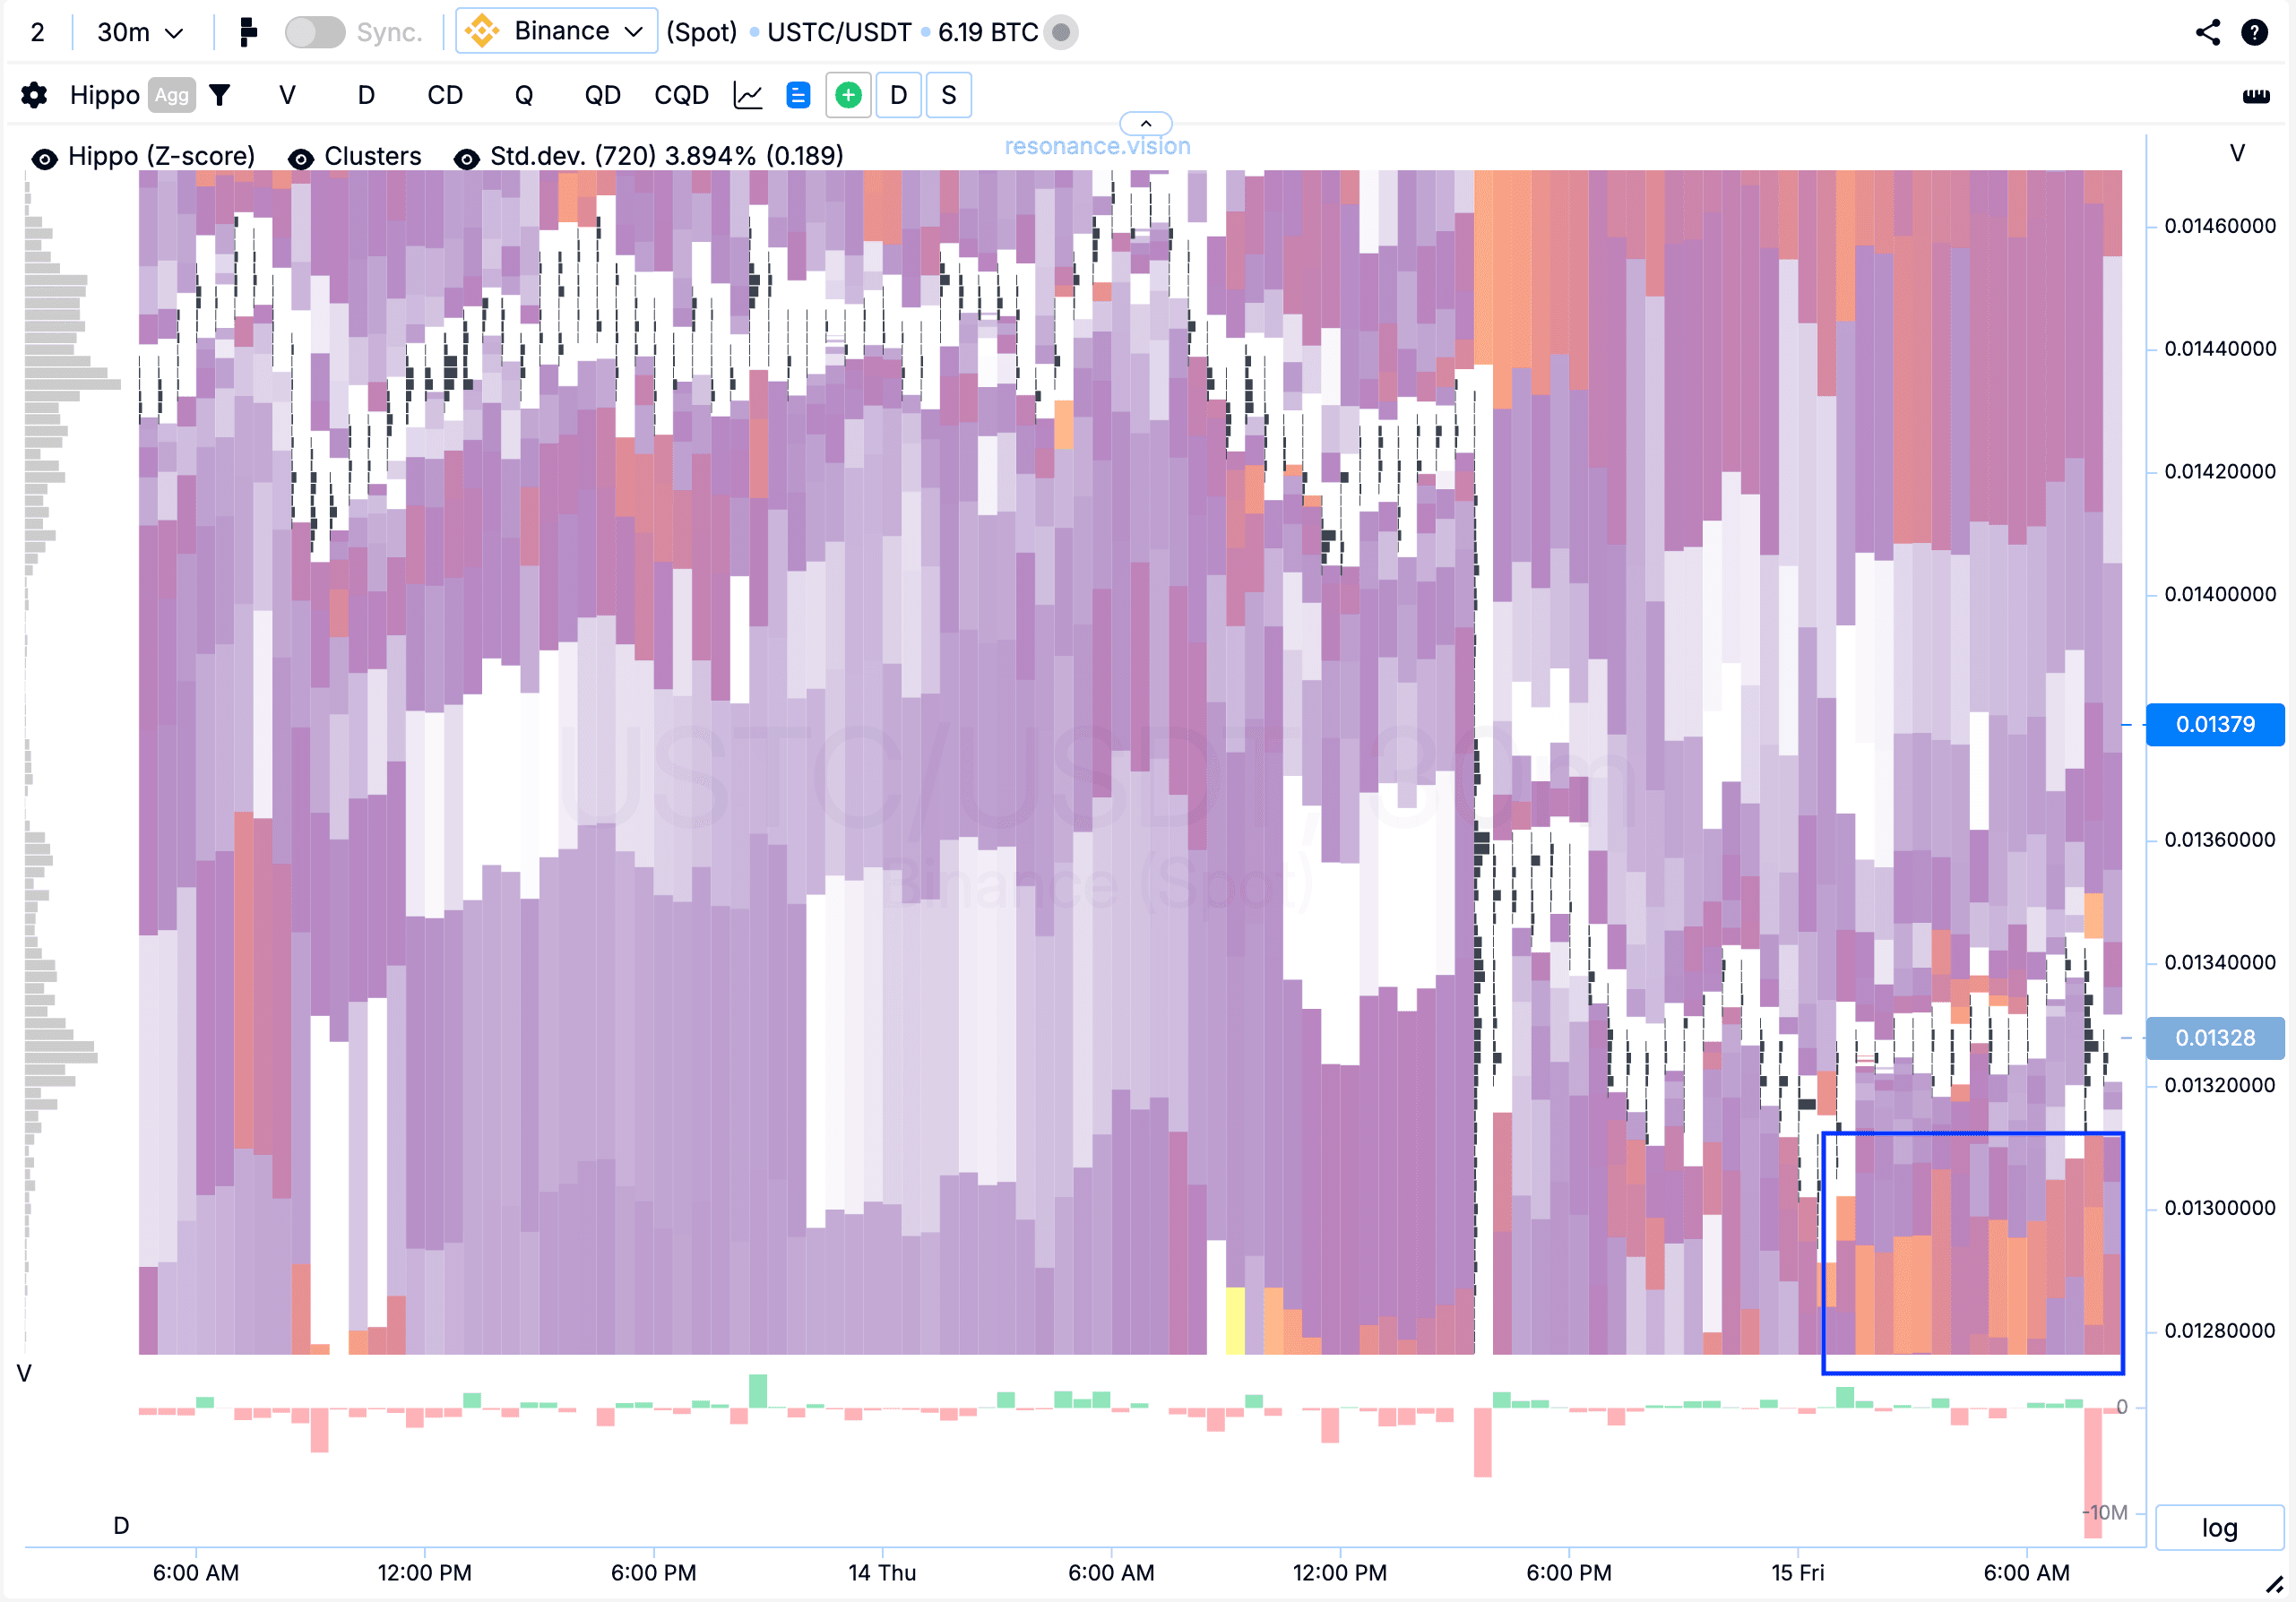
Теплова карта (Z-Score): також у нижній частині діапазону почали формуватися яскраво виражені лімітні скупчення (сині прямокутники). Подібна лімітна активність вказує на наявність підтримки – учасники готові поглинати об’єми та утримувати ціну у поточному діапазоні.
У Дешборді
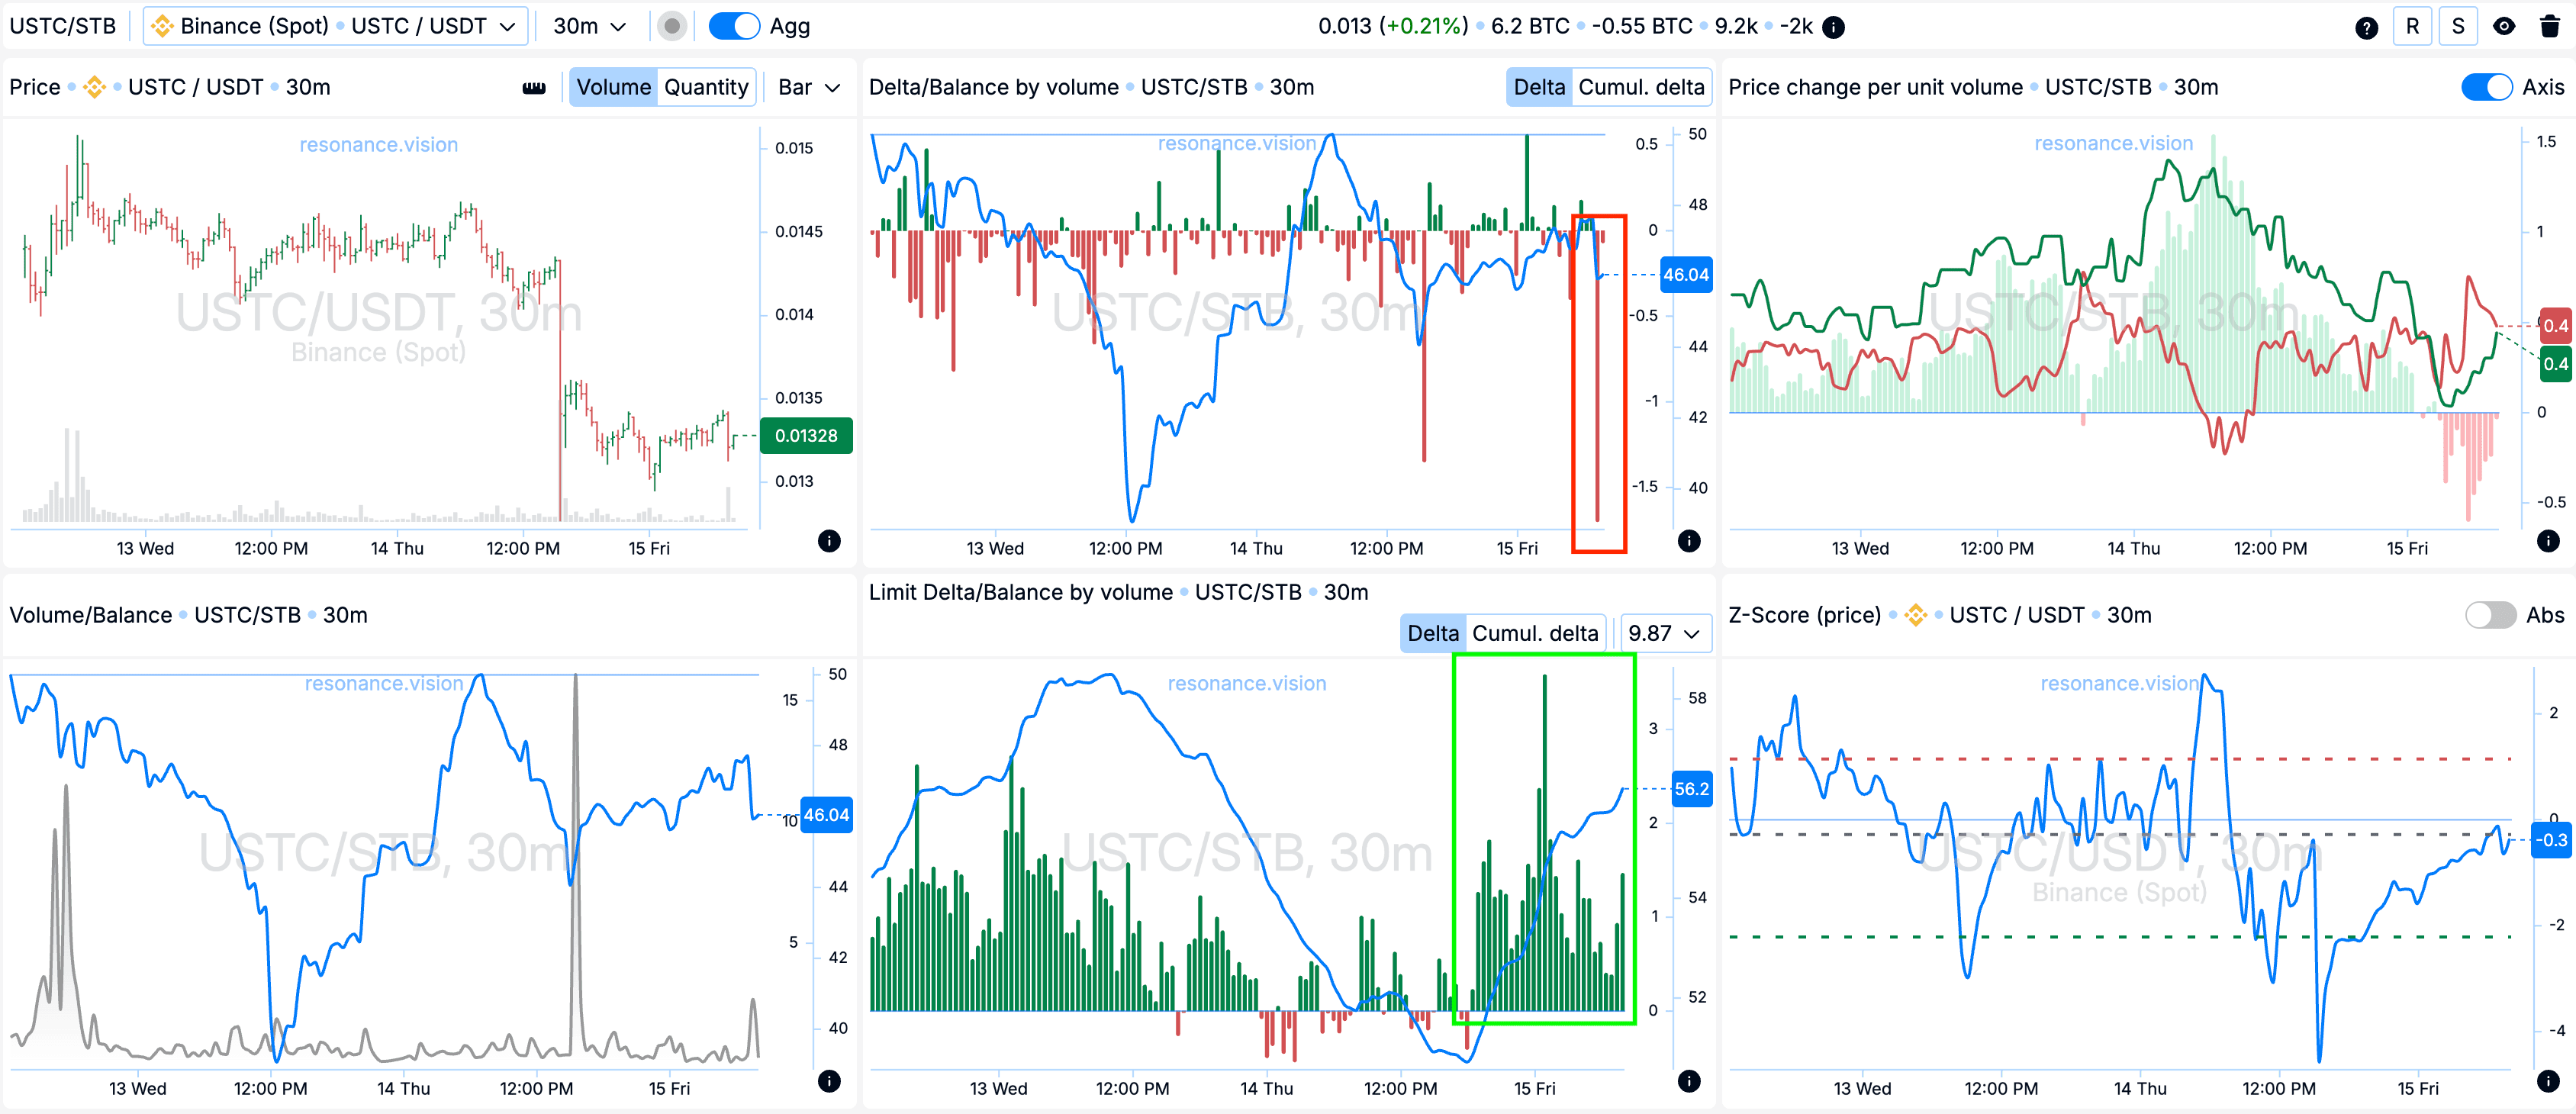
Дельта/Баланс за об’ємом та лімітна дельта: Агреговані дані показують сплеск ринкових продажів - це чітко відображається в гістограмі дельти (червоний прямокутник). Однак, незважаючи на такий виражений тиск, ціна залишається стабільною і не демонструє зниження, як і писав раніше.
Додатково, за лімітними заявками спостерігається зростання після імпульсного зниження – це видно з позитивної динаміки лімітної дельти (зелений прямокутник). Подібна поведінка вказує на переважання лімітних заявок на купівлю та готовність активно поглинати об’єми продажу в даному діапазоні.
Причини виходу
Кластерний графік: Тепер на зростанні почали формуватися об’ємні кластери, які супроводжувалися помітним збільшенням волатильності (синій прямокутник). Що додає ризику для утримання позиції.
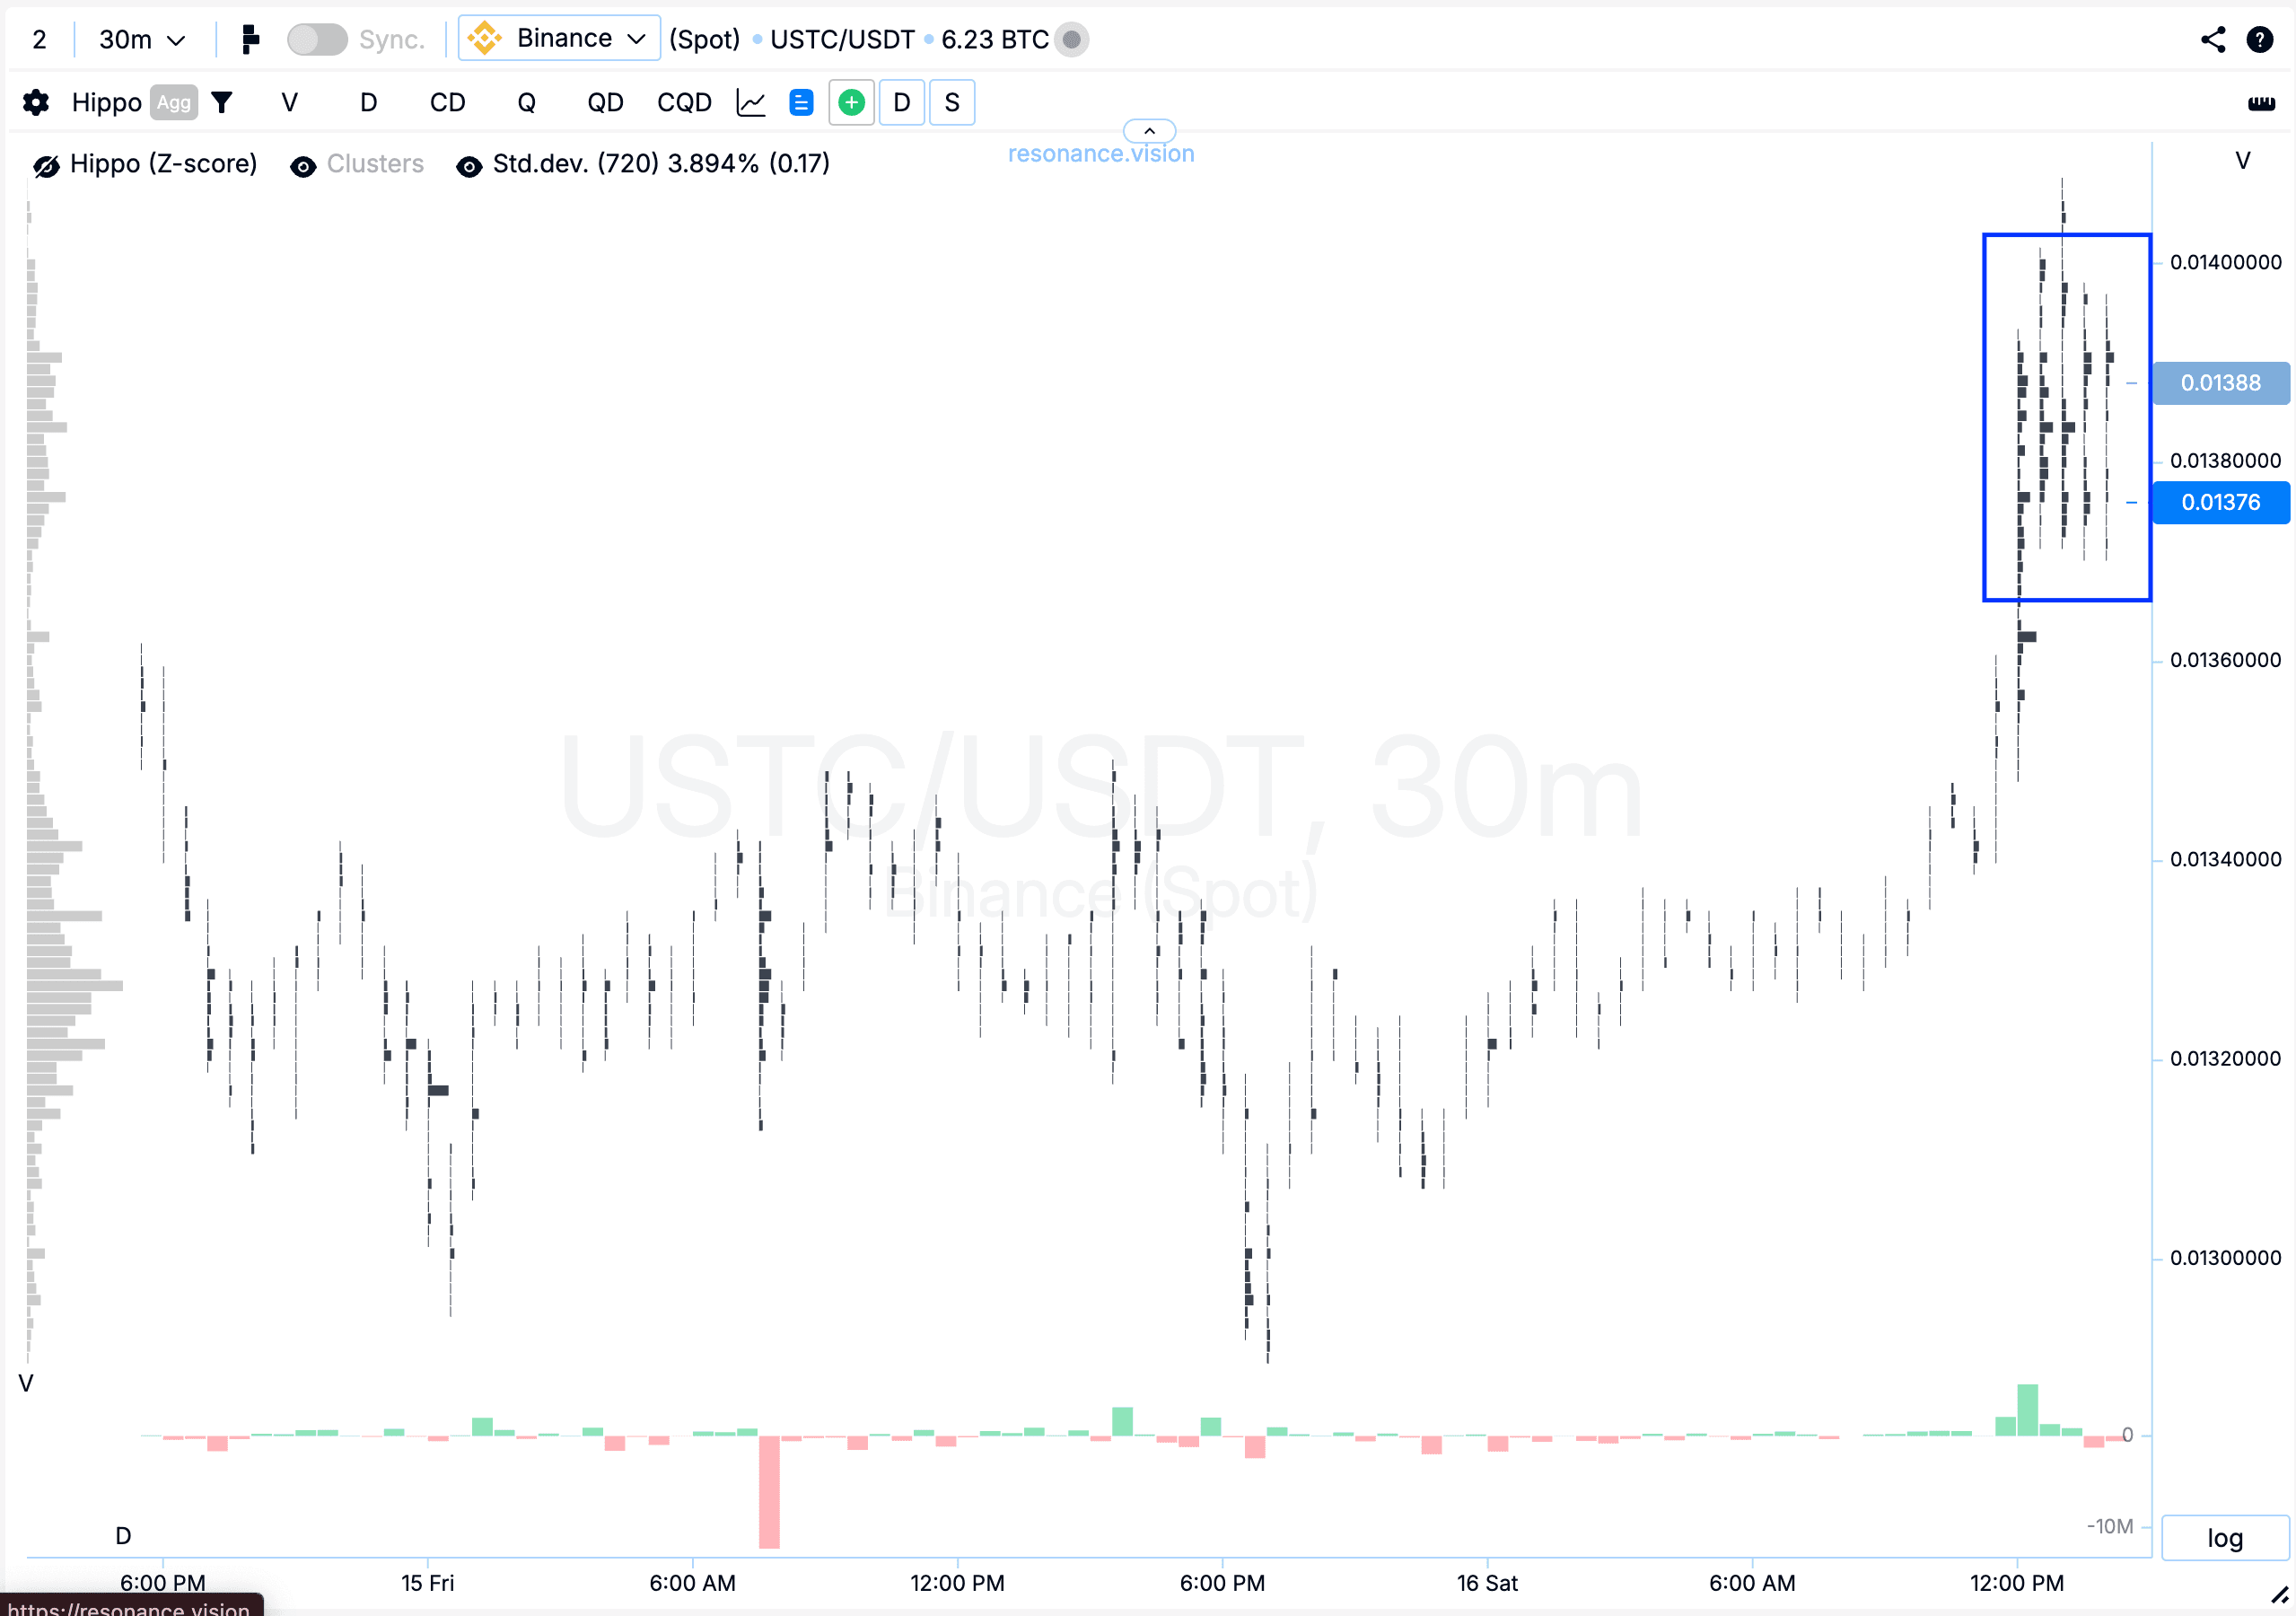
Теплова карта в режимі Z-Score: Зверху почали формуватися яскраво виражені лімітні скупчення (сині прямокутники). Подібна лімітна активність може свідчити про наявність значного опору в поточному ціновому діапазоні.
Підсумок
Вдалося зафіксувати прибуток у розмірі +78,73%.
Висновок
У цій угоді вдалося відпрацювати ідею, засновану на явних ознаках локального дефіциту та активності лімітного покупця. Незважаючи на значні ринкові продажі, ціна не знижувалася, що підтвердило слабкість продавців та наявність підтримки у ціновому діапазоні.
На зростанні ситуація змінилася: формування об’ємних кластерів і зростання волатильності вказували на підвищені ризики утримання позиції. Додатковим фактором стала поява зверху лімітних скупчень, що формують потенційний опір.
Стеж за новими статтями у нашому телеграм каналі.
Не треба вигадувати складних схем та шукати “грааль”. Використовуйте інструменти платформи Resonance.
Реєструйся за посиланням - отримуй бонус і починай заробляти:
OKX | BingX | KuCoin.
Промокод TOPBLOG дає тобі 10% знижки на будь-який тарифний план Resonance.
Рекомендовані статті


