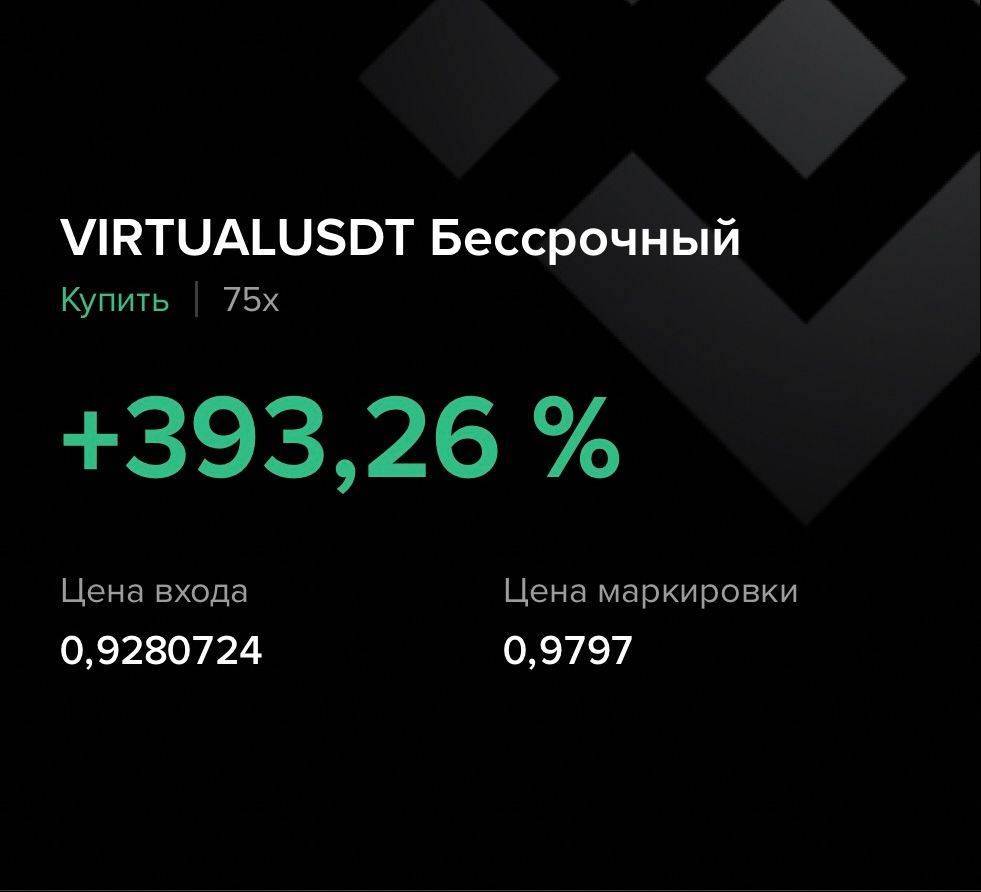
VIRTUAL +393.26% (Напрямкова стратегія Резонанс)

У розборі розглянуто ситуацію, де на зниженні покупці почали виявляти локальну ініціативу: продавці тиснули по ринку, але ціна вже майже не реагувала, що вказувало на послаблення тиску та перші ознаки дефіциту. Далі агреговані дані підтвердили зменшення продажу та усунення балансу у бік покупок. На зростанні ціна показала посилення волатильності та формування великих кластерів, а маркет-купівлі почали поступово переходити у продажі – сигнал до послаблення ініціативи. У таких умовах фіксація позиції стала оптимальним та раціональним рішенням.
Зміст

Монета: VIRTUAL/USDT
Ризик: середній
Рівень розуміння: новачок
Причини входу
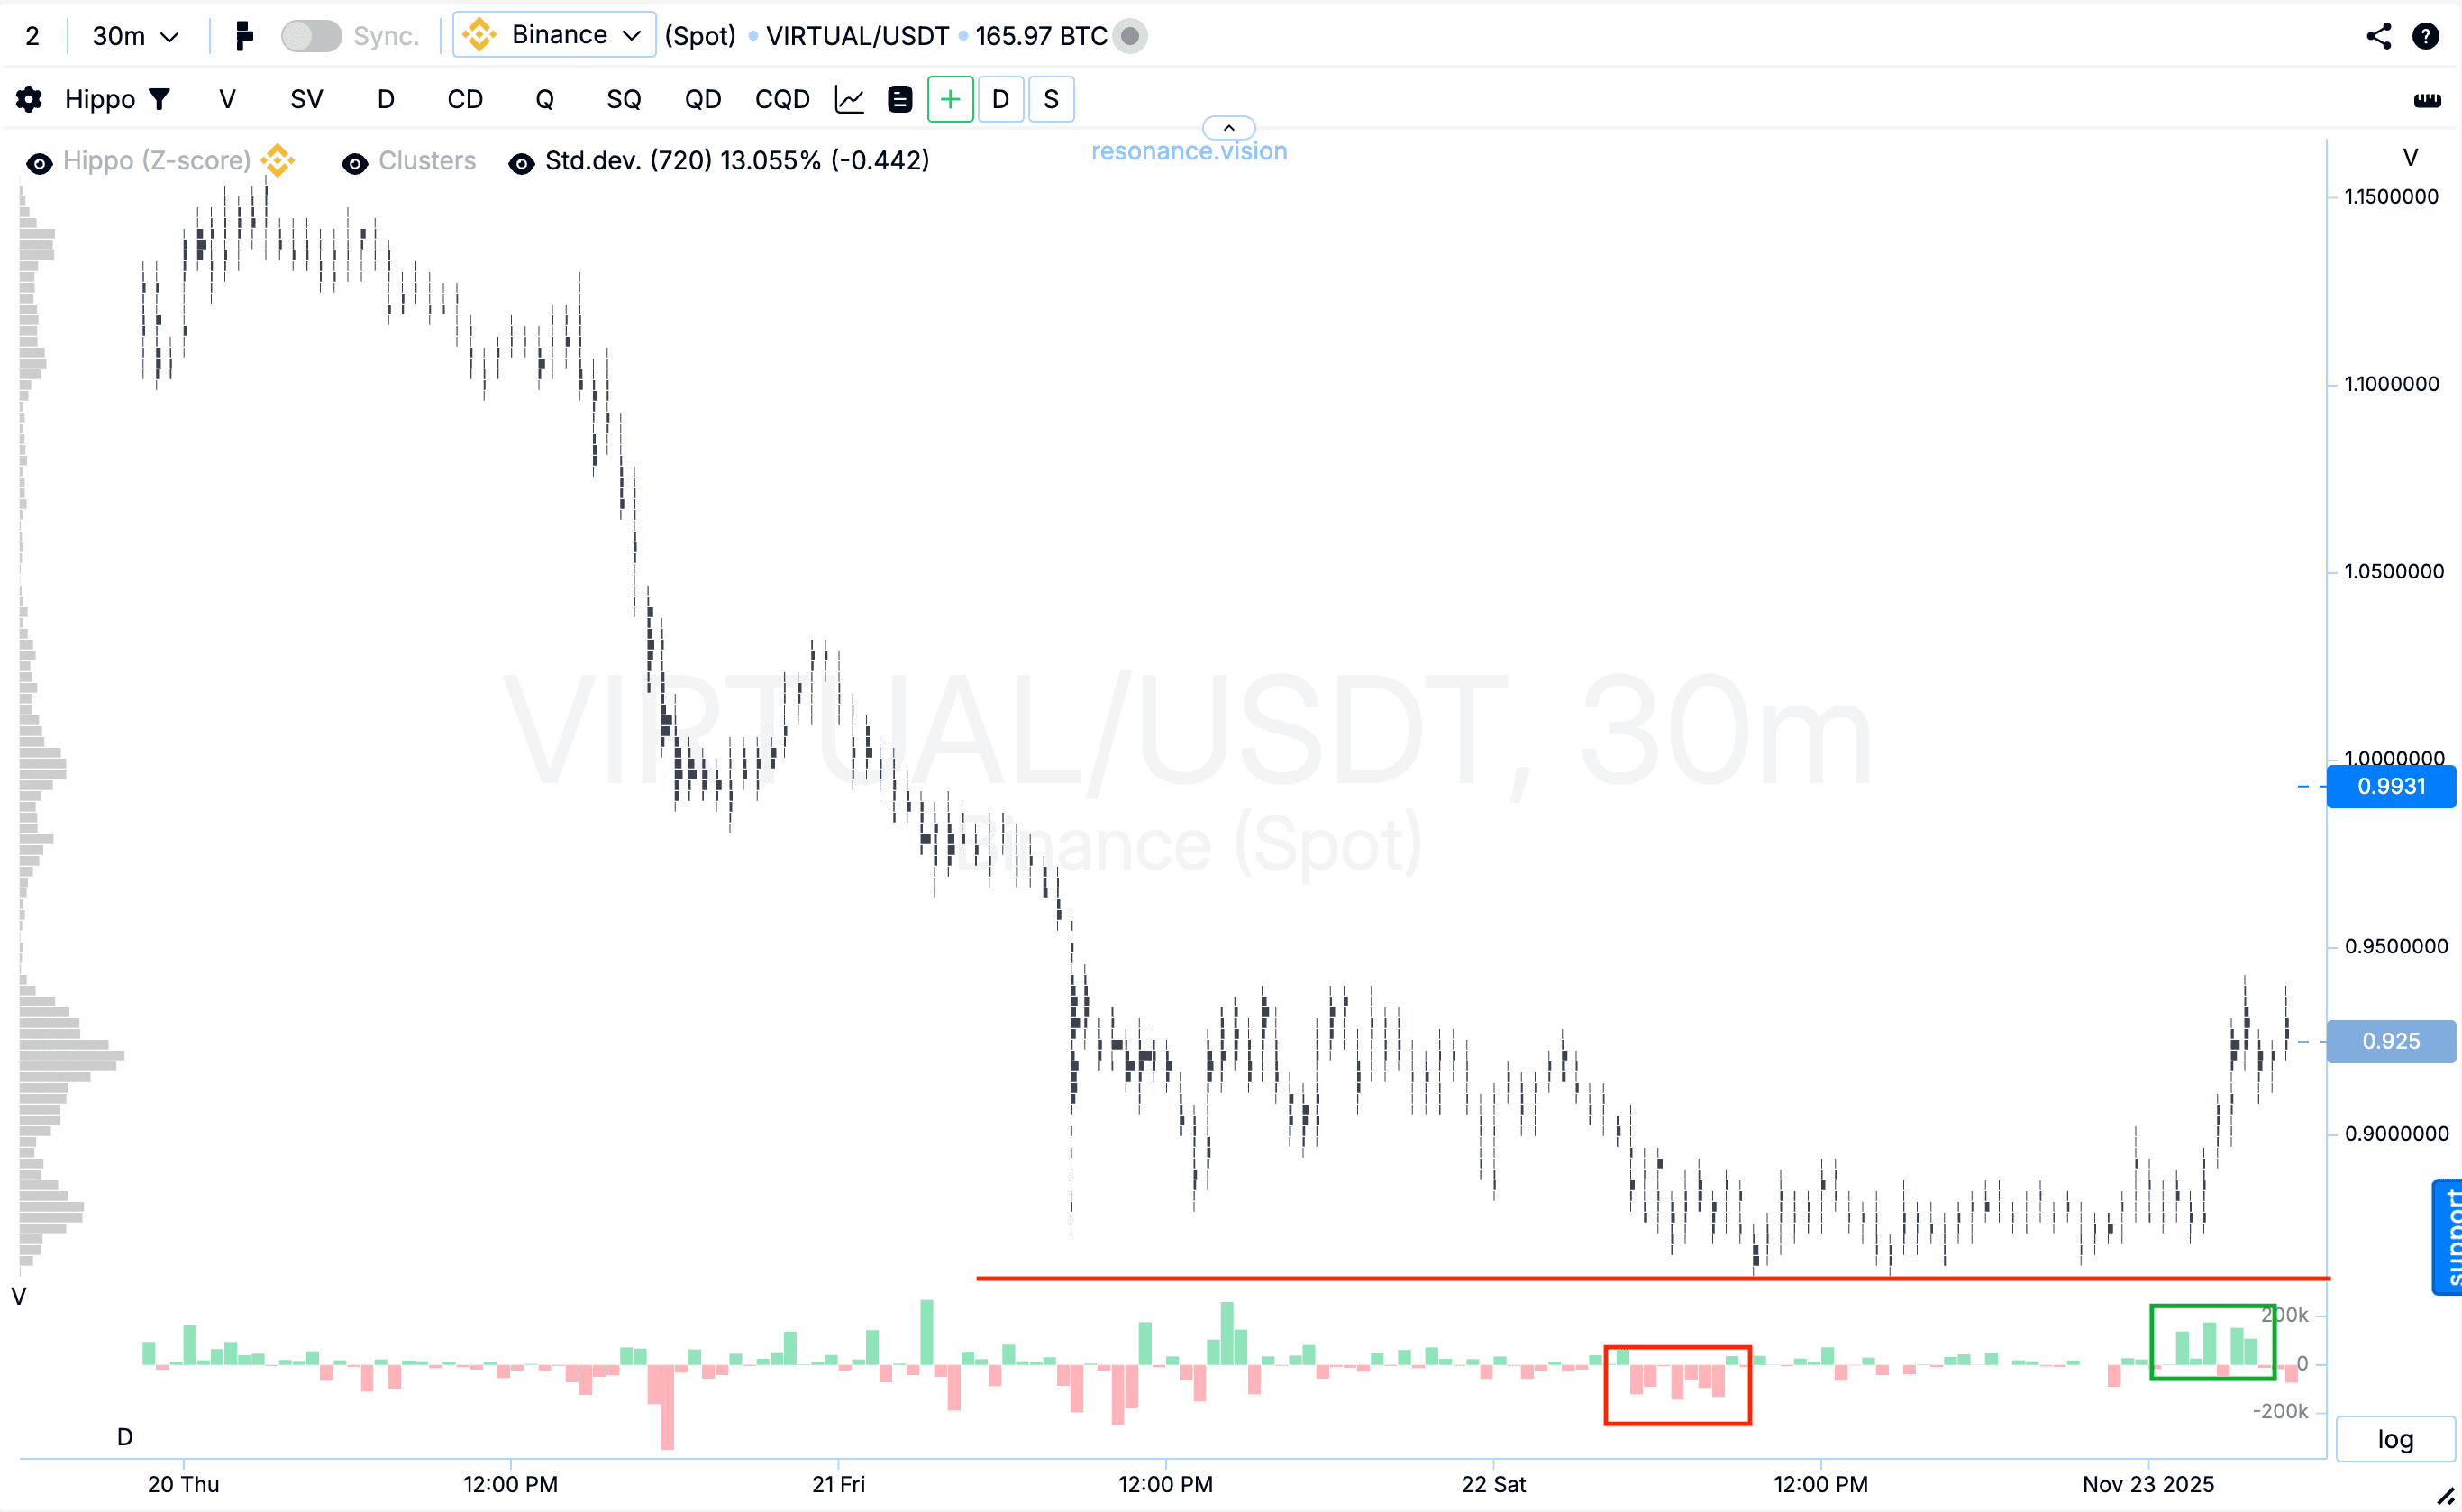
Кластерний графік: на зниженні видно, що незважаючи на продажі, ціна вже практично не реагує і не йде нижче (червоний прямокутник та лінія). Потім починають з’являтися покупки, які витягують ціну вгору та демонструють перемикання ініціативи у бік покупців (зелений прямокутник).
У Дешборді
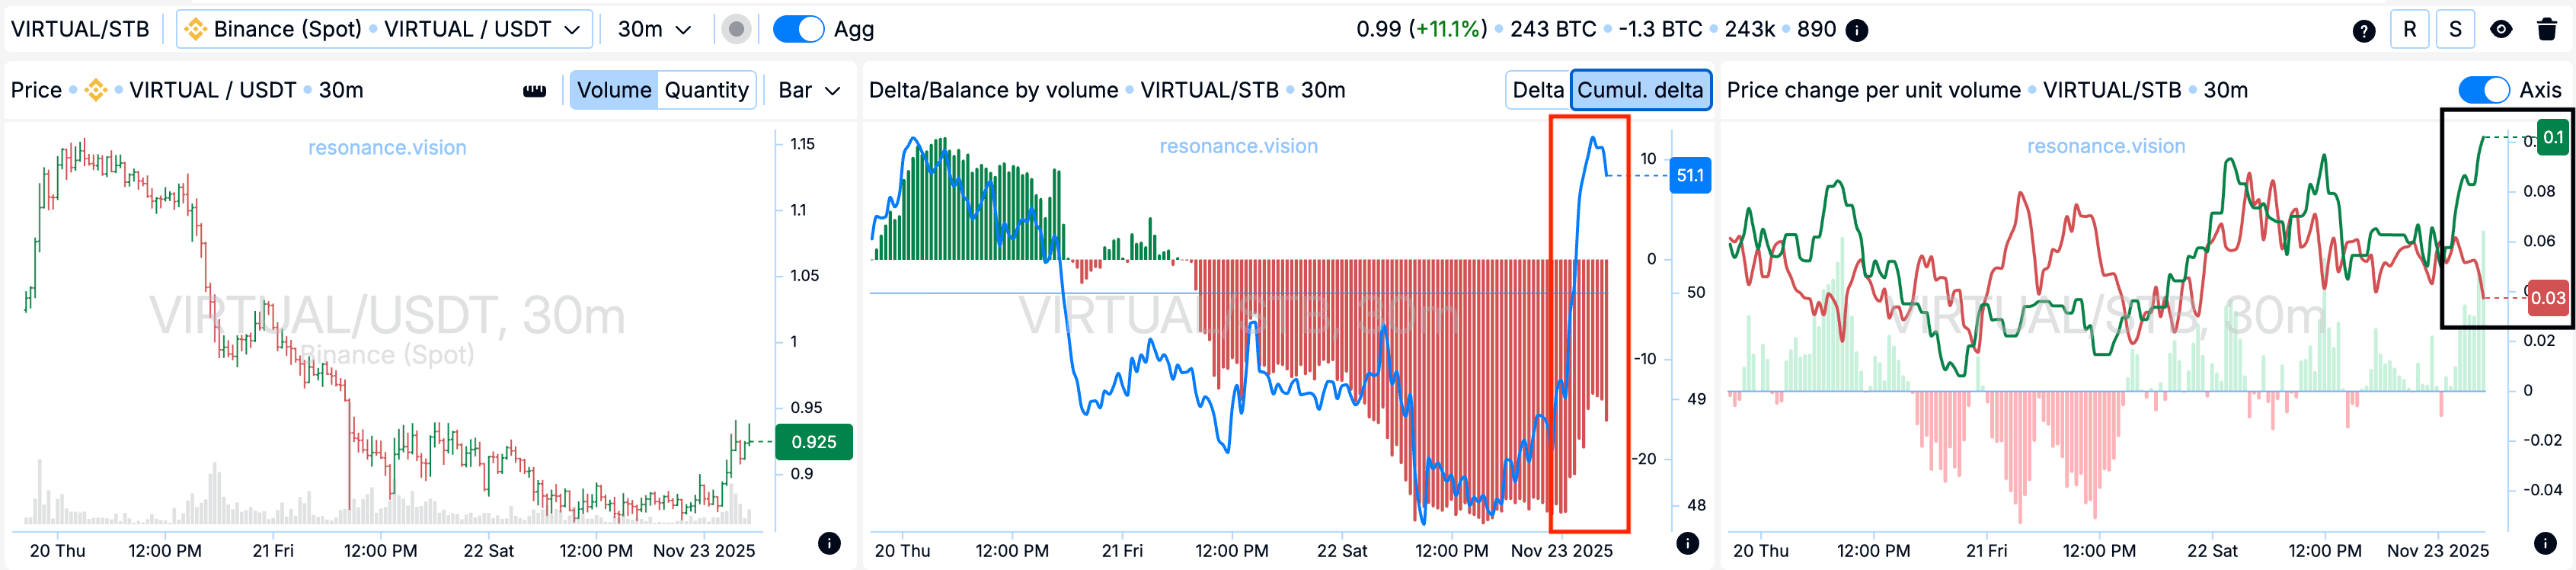
Дельта / Баланс за об’ємом: за агрегованими даними по всіх парах та біржах помітно, що в цей період домінували ринкові продажі - це добре відображає кумулятивна дельта. Проте об’єм продажів поступово знижувався, а баланс почав зміщуватися у бік покупок (червоний прямокутник). Така динаміка вказує на можливе послаблення продавців та перехід контролю до покупців.
Зміна ціни на одиницю об’єму: ефективність впливу ринкових ордерів на ціну початку розходиться на користь покупців (чорний прямокутник), що є додатковим аргументом на користь відкриття позиції в лонг.
Причини виходу
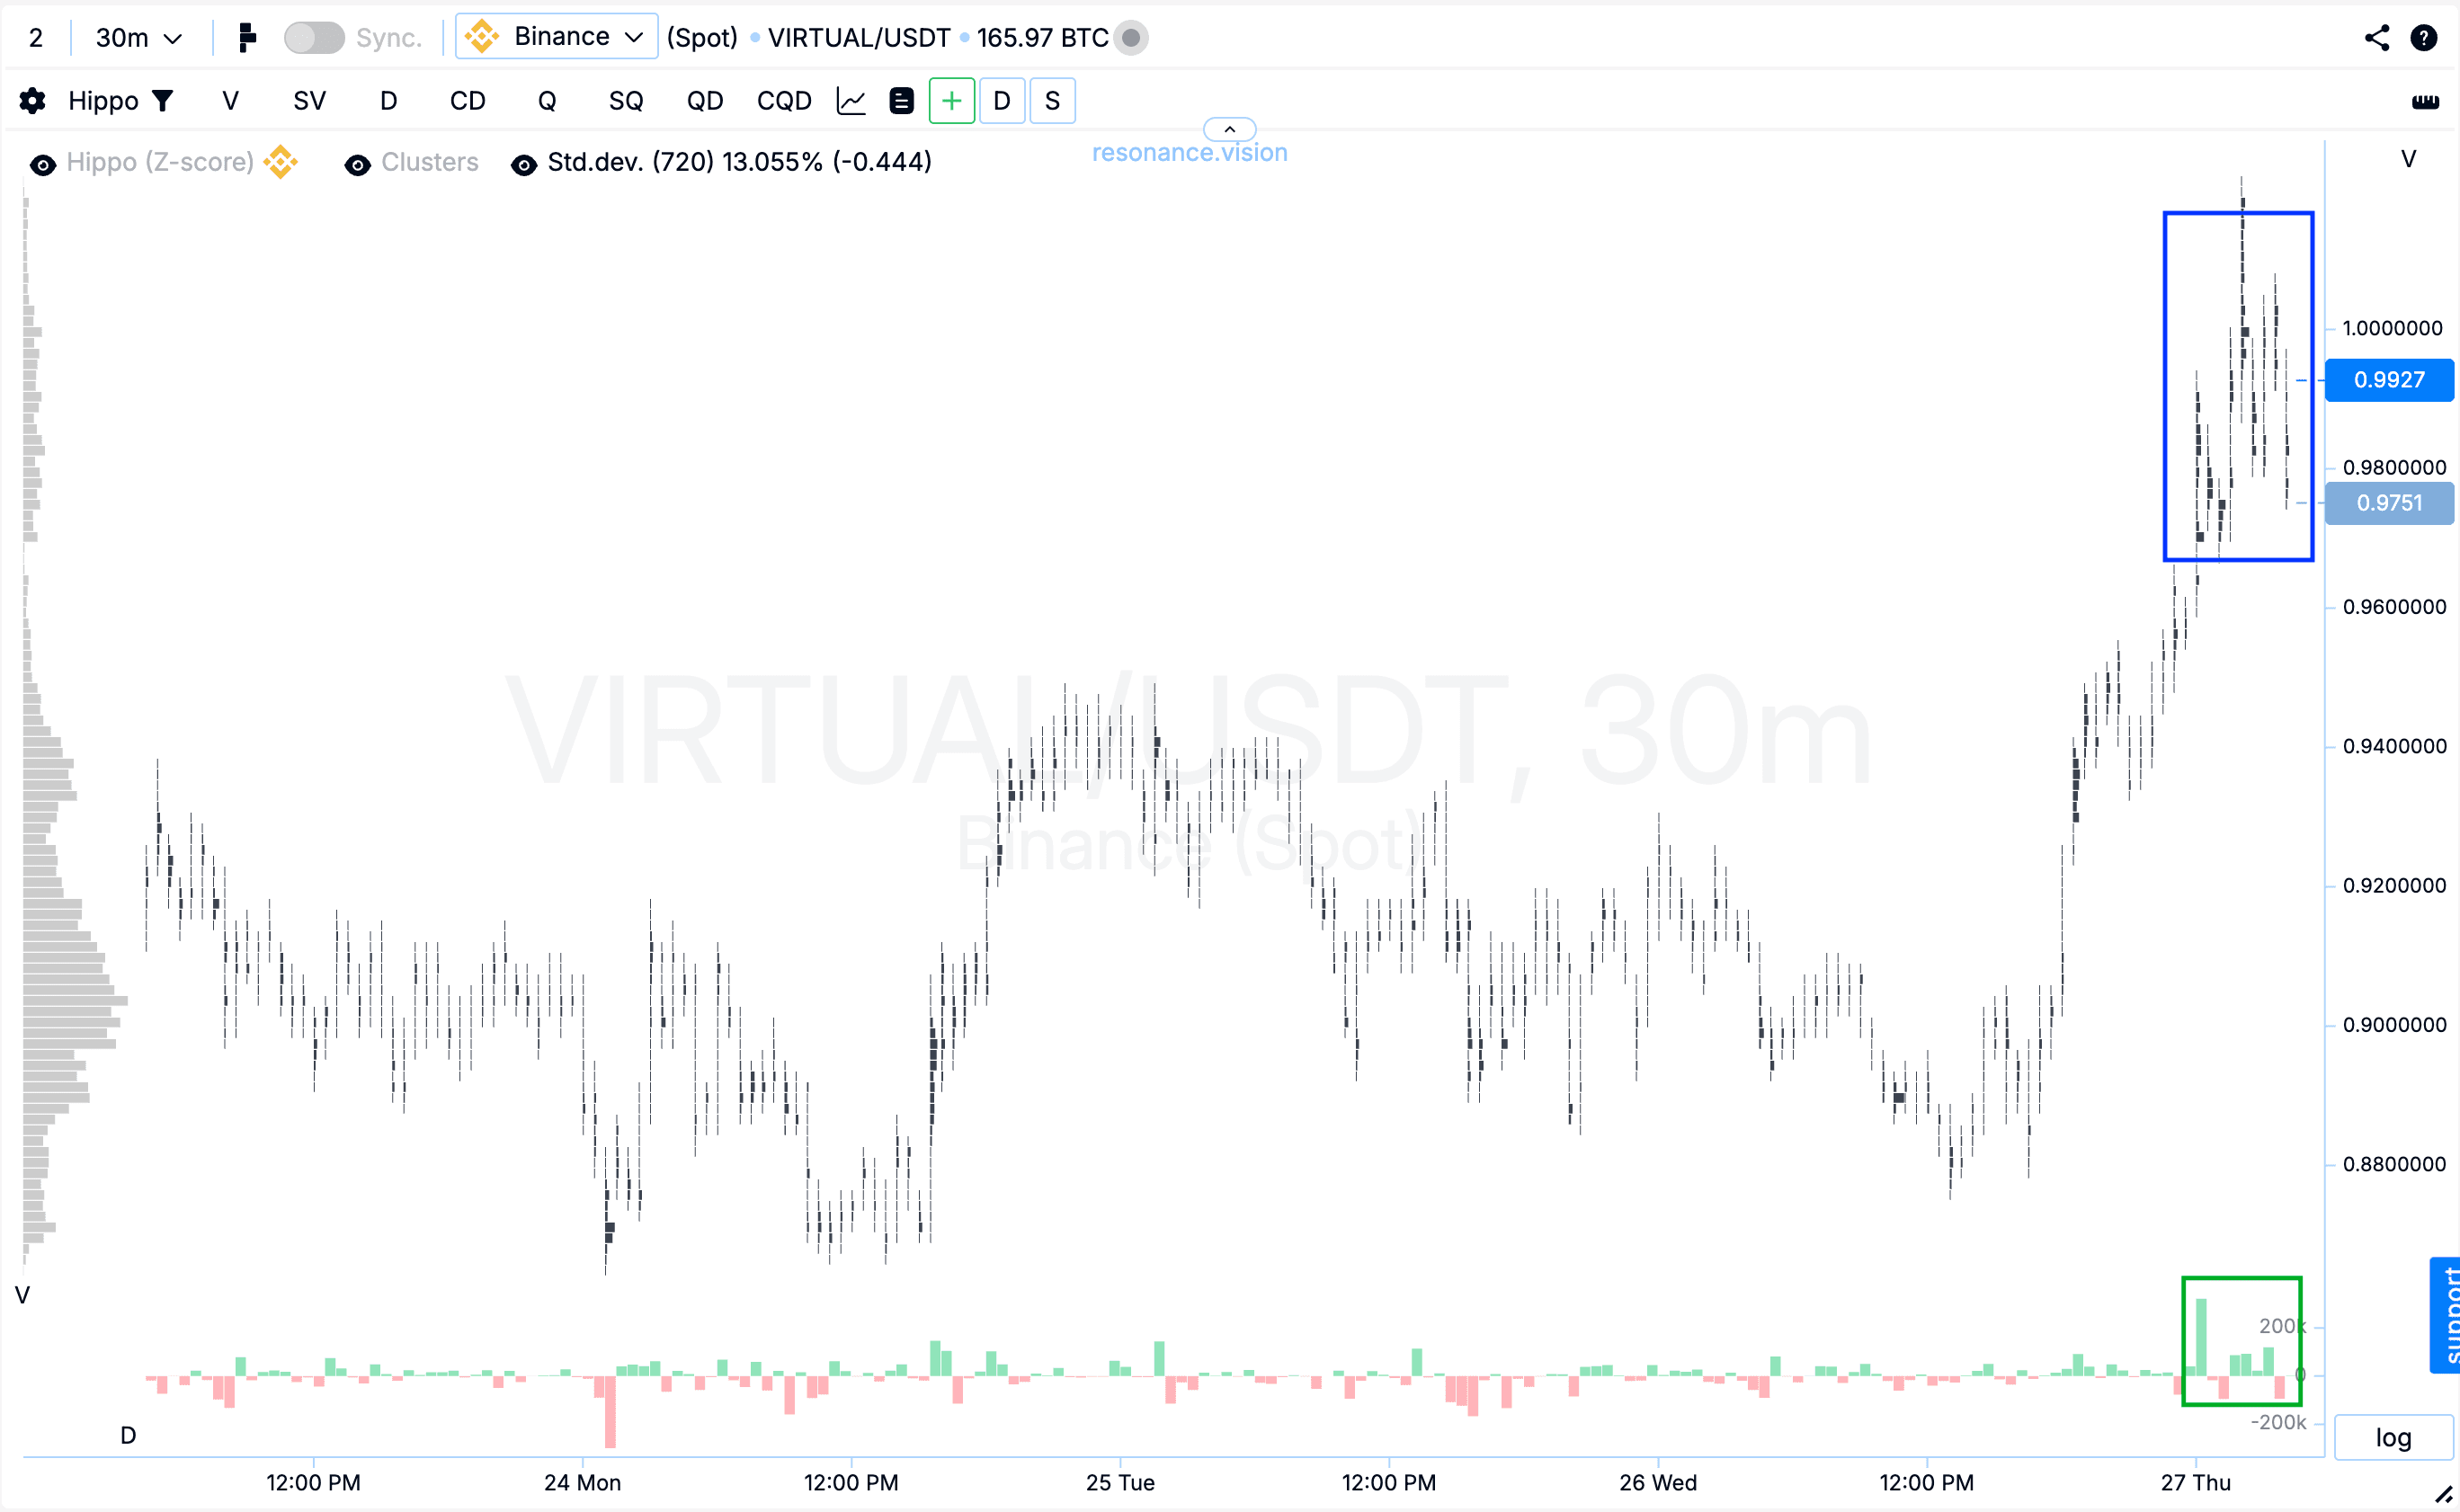
Кластерний графік: на зростанні почали формуватися великі кластери за об’ємом, одночасно збільшилася волатильність (синій прямокутник). При цьому ринкові покупки поступово змінилися продажами (зелений прямокутник), що призвело до відкату. У такій ситуації фіксація позиції виглядала оптимальним рішенням – висока волатильність та ослаблення ініціативи покупців збільшували ризик подальшого утримання.
Підсумок
В результаті вдалося зафіксувати прибуток у розмірі 393,26%.
Висновок
Угода з VIRTUAL стала гарним прикладом того, як поєднання кластерного аналізу, агрегованих даних та метрик ефективності об’єму допомагає заходити в момент ослаблення продавців і фіксувати результат тоді, коли покупці реально втрачають чинність.
Ми побачили перемикання ринкового балансу, помітили ознаки дефіциту на зниженні та увійшли після того, як ініціативу взяли покупці.
Подальший розвиток руху підтвердив сценарій, і угоду вдалося провести спокійно та дисципліновано: зафіксував прибуток вчасно та не пересиджував ризик. Це чудовий приклад того, як системний підхід допомагає не лише знаходити точку входу, але й грамотно керувати виходом, зберігаючи результат.
Стеж за новими статтями у нашому телеграм каналі.
Не треба вигадувати складних схем та шукати “грааль”. Використовуйте інструменти платформи Resonance.
Реєструйся за посиланням - отримуй бонус і починай заробляти:
OKX | BingX | KuCoin.
Промокод TOPBLOG дає тобі 10% знижки на будь-який тарифний план Resonance.
Рекомендовані статті


