WLD +116% (Directional Strategy Resonance)

This analysis examines a WLD/USDT trade, where the key factor was the price stability under obvious pressure from sellers. Analysis of the cluster chart, heat map and dashboard showed signs of local deficit and buyer activity, which gave a strong entry signal. At the exit, the decisive factor was the increase in market sales and a gradual decrease in price, which allowed us to fix the result in time and save profits.
Table of contents

Coin: WLD/USDT
Risk: Medium
Skill Level: Beginner
Entry Reasons
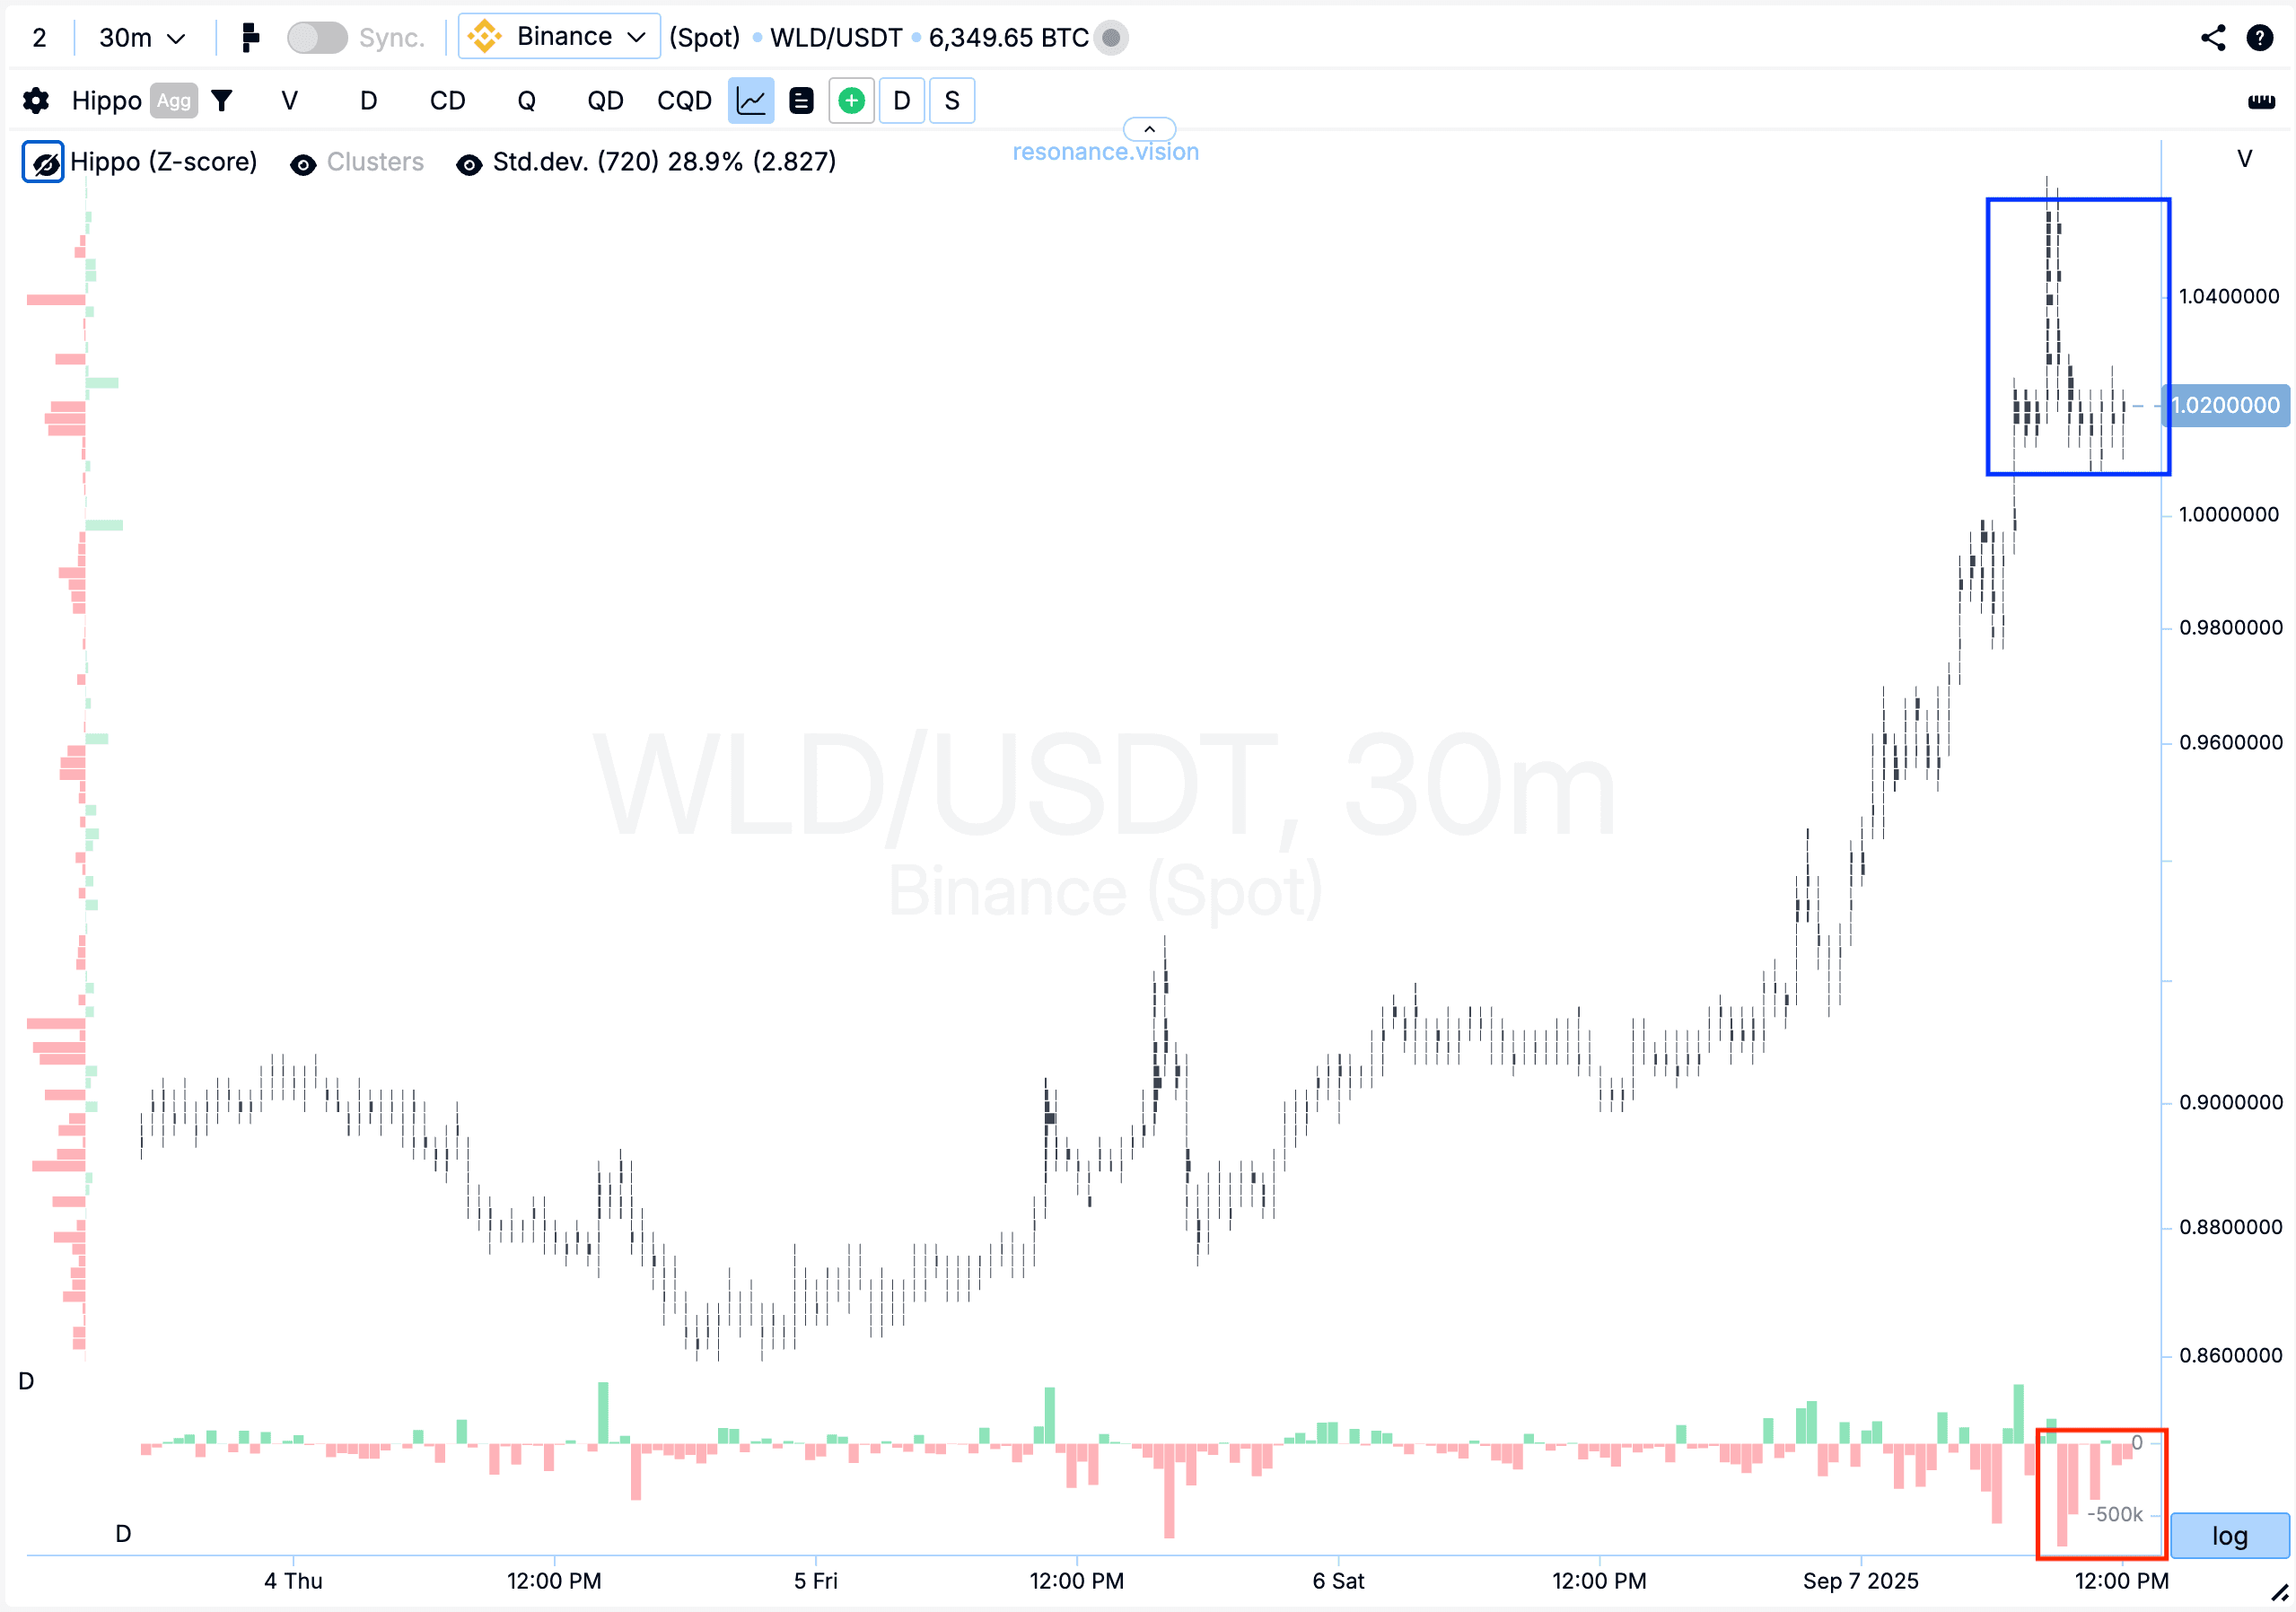
Cluster Chart: During the uptrend, volume clusters began to form (blue rectangle). In these clusters, selling dominated (red rectangle), but the price did not react to this pressure and did not decline.
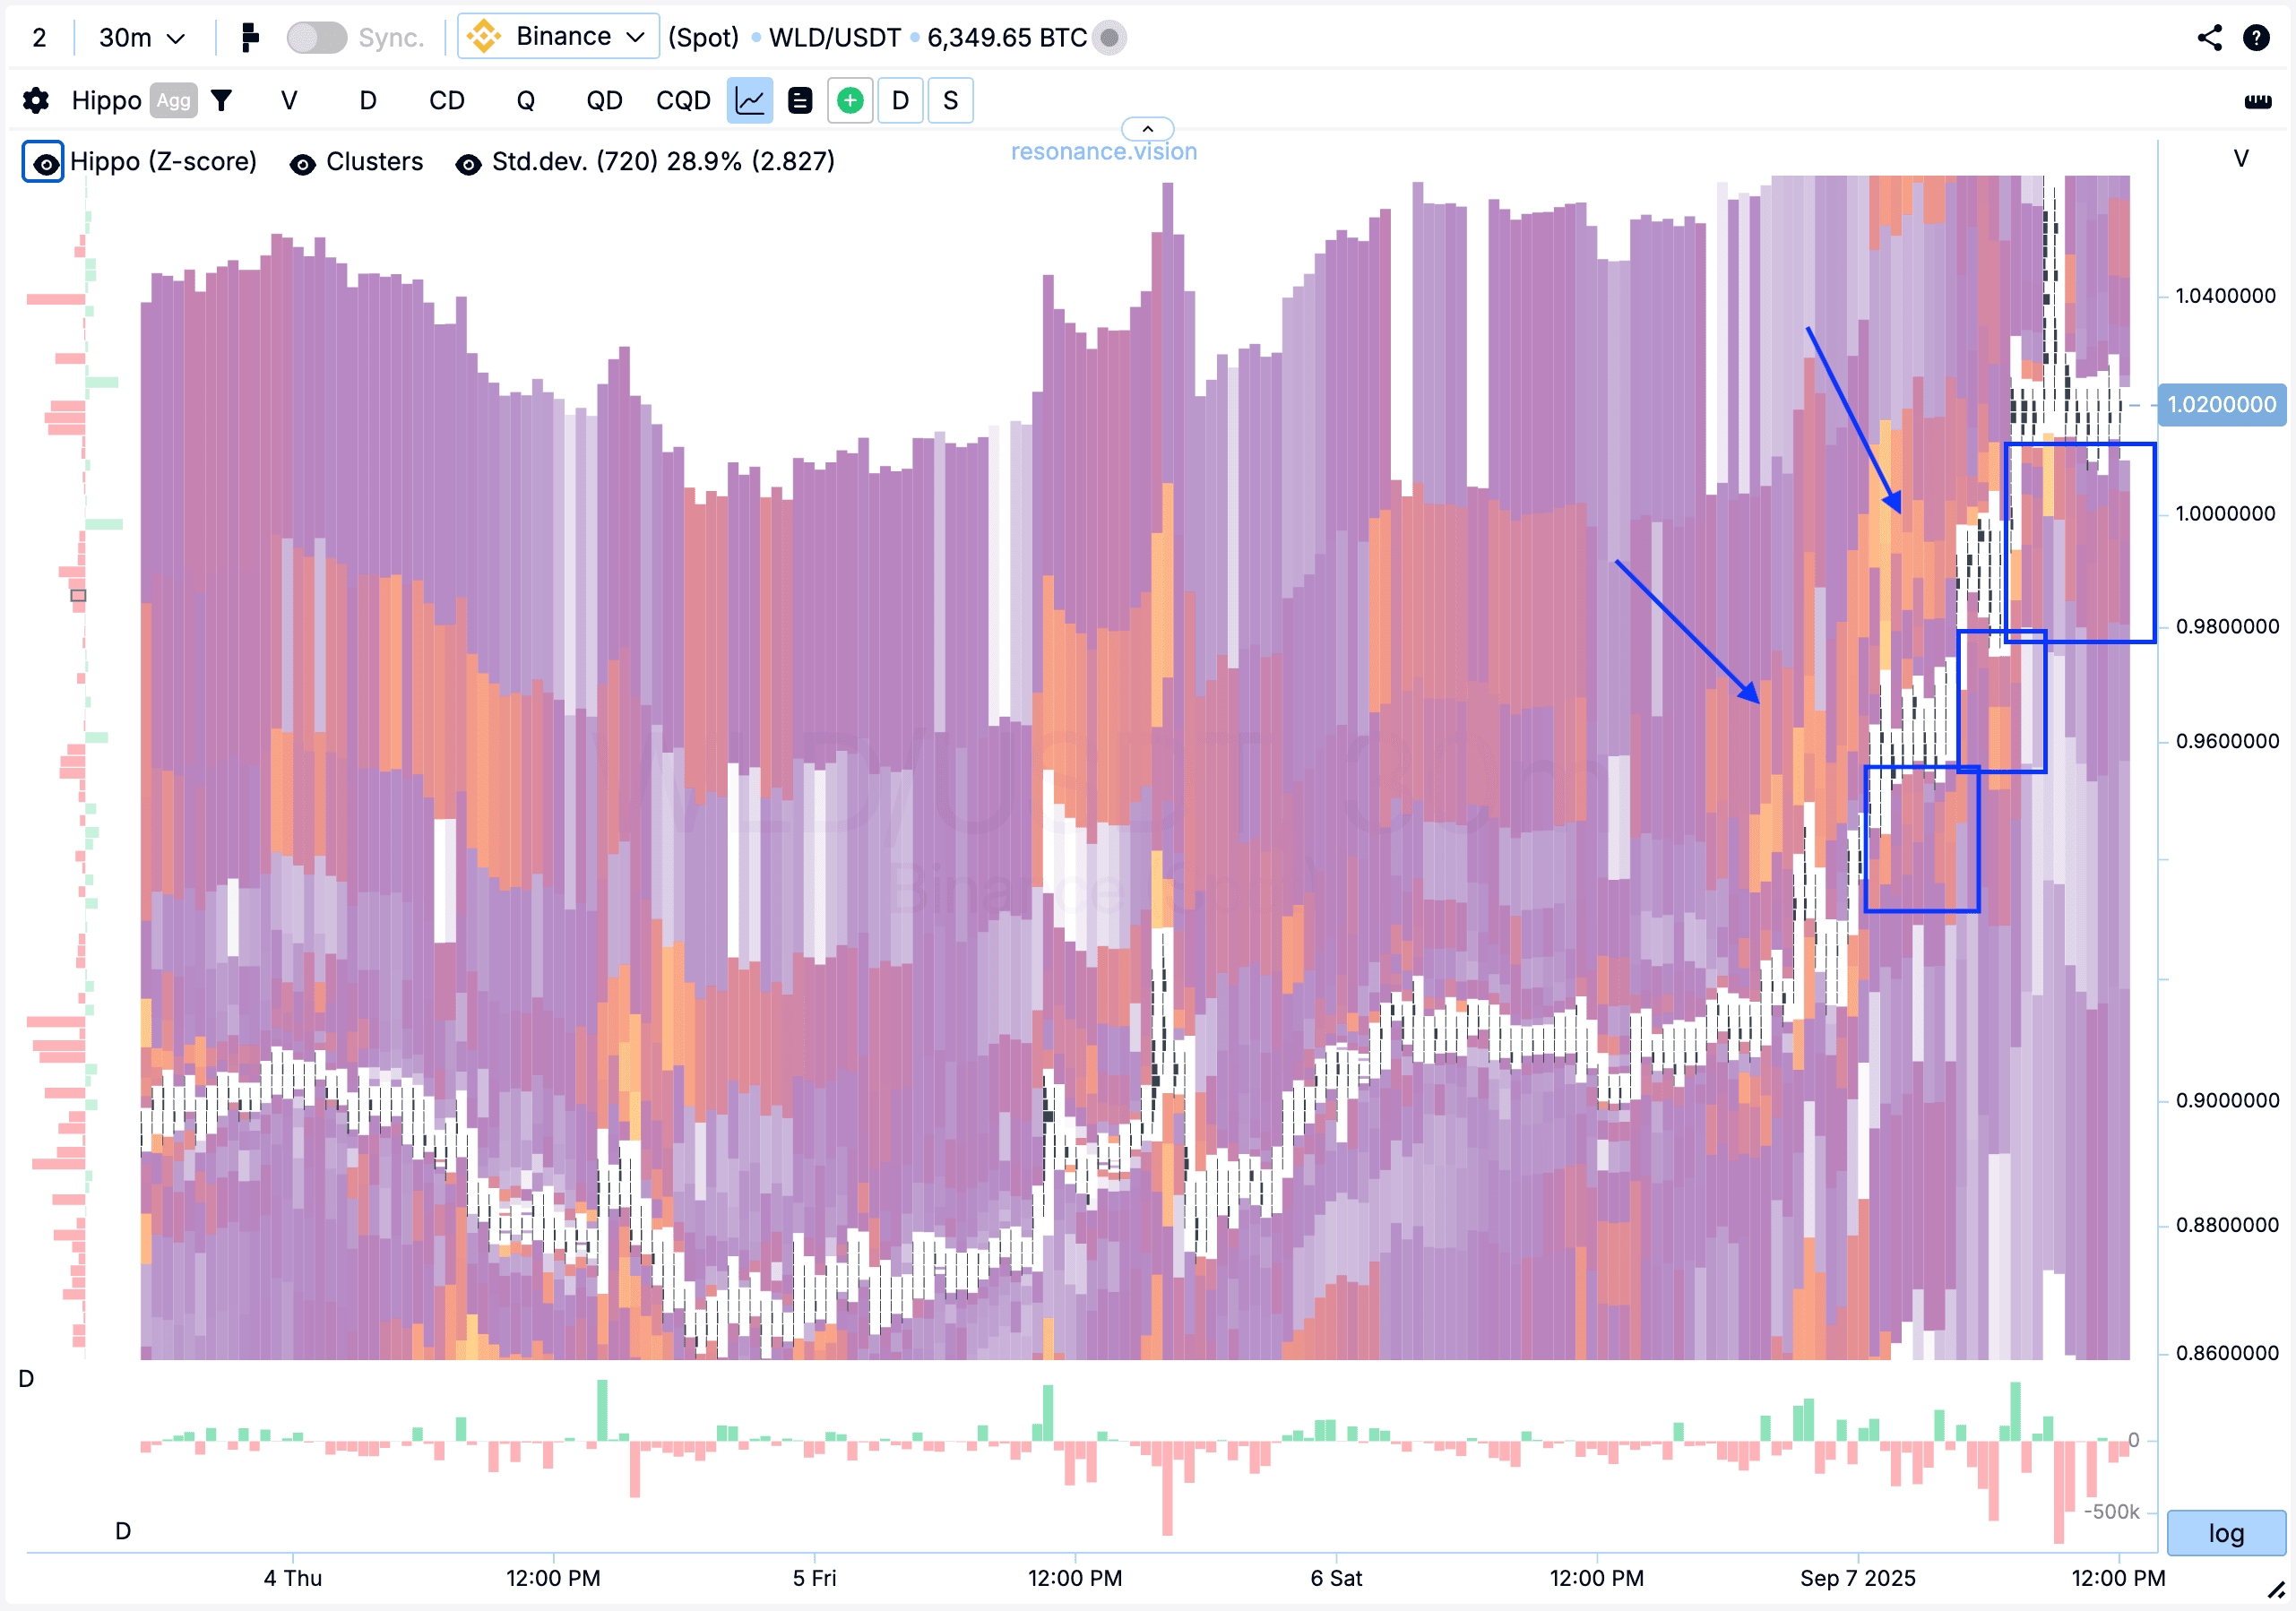
Heatmap (Z-Score): Abnormal sell-side limit densities appeared above, which were actively absorbed by market buys (blue arrows). This indicates that buyer demand exceeded the available sell-side limit supply. Additionally, buy limit orders were gradually moving higher — visible on the heatmap as abnormal accumulations (blue rectangles). Such dynamics may signal the persistence of local deficit conditions and participants’ readiness to hold the price.
On the Dashboard
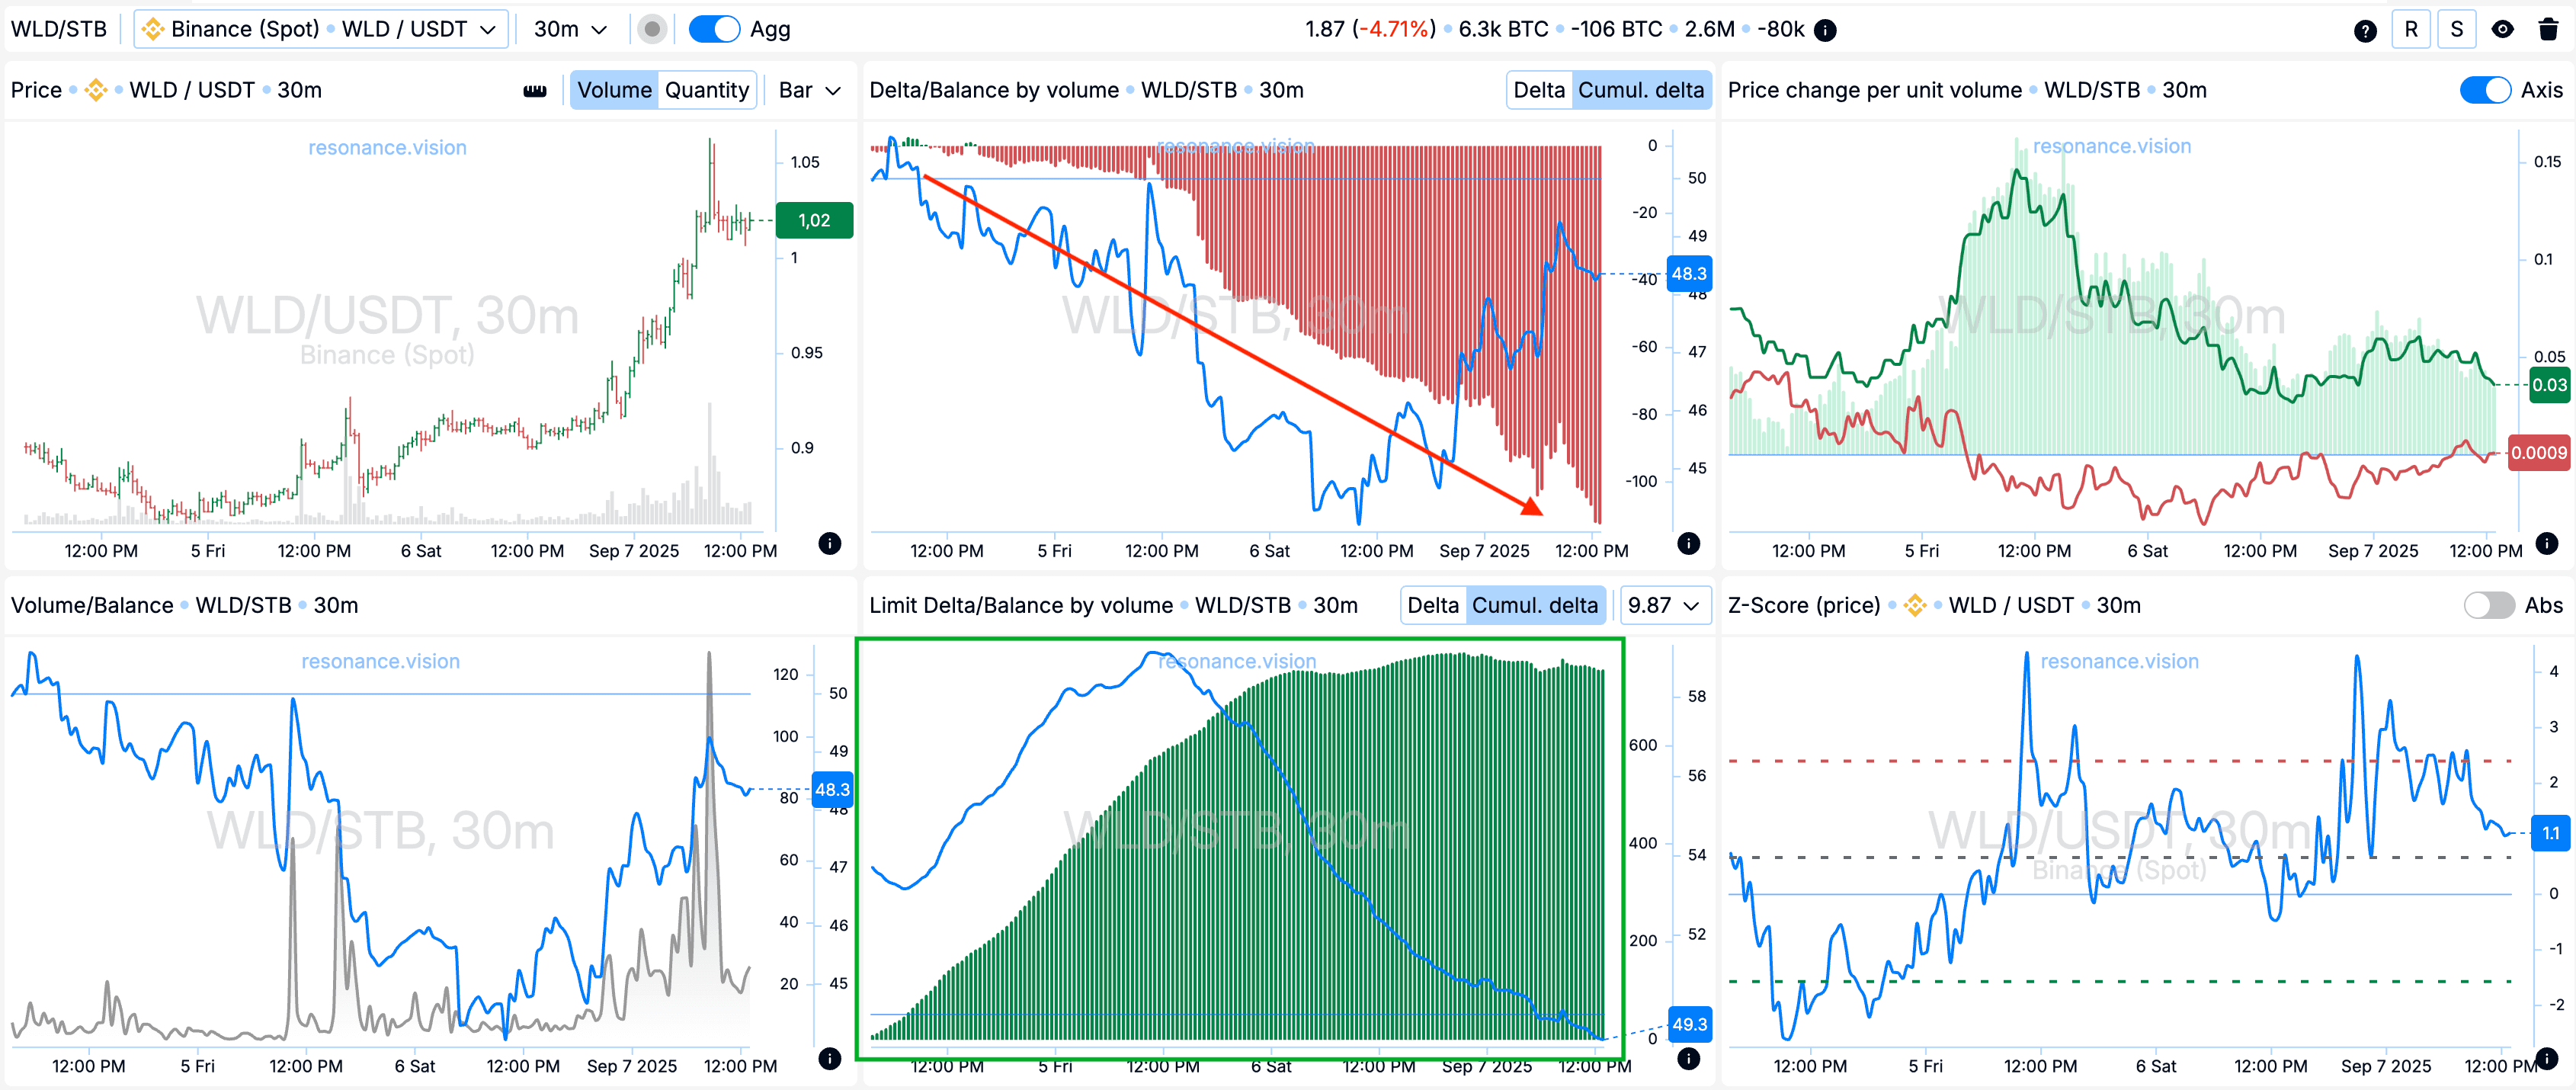
Delta/Volume Balance and Limit Delta: Aggregated data recorded continued growth of market selling — clearly shown by the cumulative delta trend (red arrow). However, despite strong pressure, the price remained stable and did not show the expected decline, which is consistent with observations from the cluster chart.
At the same time, a significant increase in cumulative delta for limit orders (green rectangle) was observed, reflecting the dominance of buy-side limit orders. This indicates buyers’ readiness to actively absorb selling volumes and support the price within the current range.
Exit Reasons
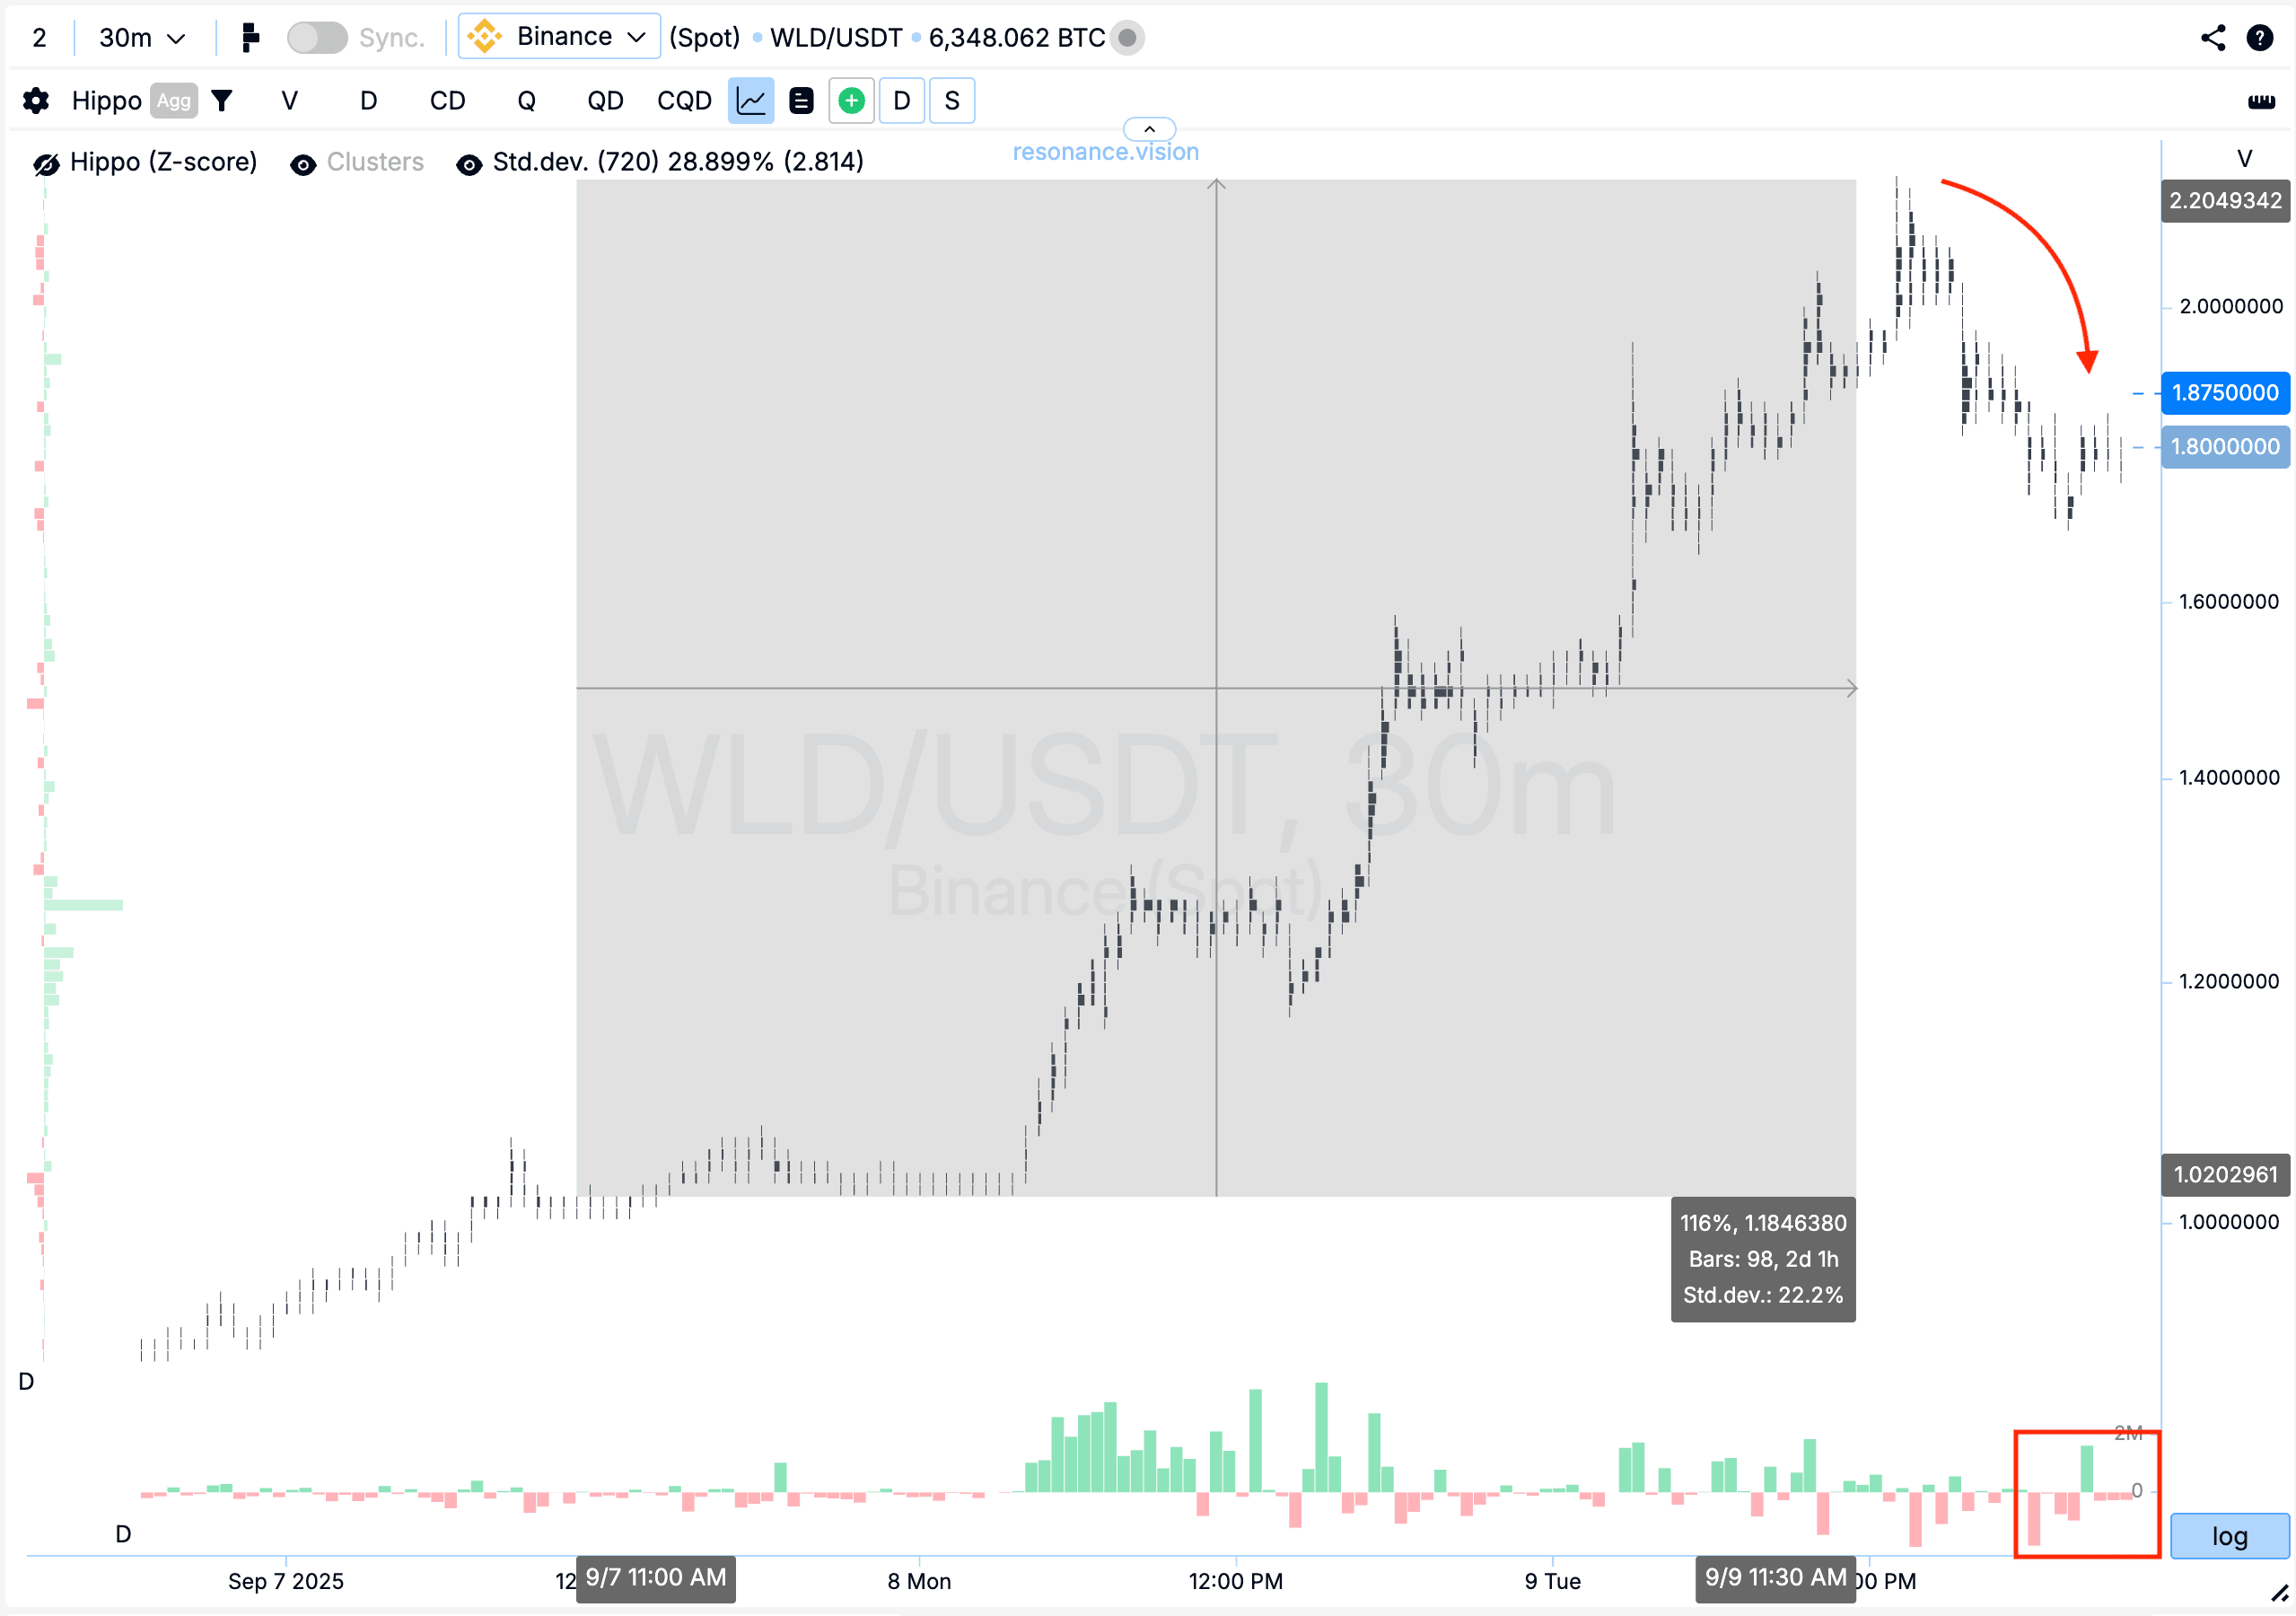
Cluster Chart: After entry, the price showed a confident rise without major pullbacks, delivering an additional +116% move. Then a decline formed, where selling market volumes began to exert noticeable pressure on price — it gradually moved lower (red rectangle and arrow). Such dynamics signaled the need to take profit, as market participants were likely starting to unload previously accumulated positions and secure profits.
Conclusion
This trade illustrates how important it is to monitor the imbalance between market selling and price reaction. Despite clear selling pressure, the price remained resilient — giving grounds to assume a local deficit and strong buyer interest. Confirmation via the heatmap and limit order dynamics reinforced the hypothesis of sustained demand.
On the exit, the key signal was increased selling volumes and gradual price decline, pointing to unloading of previously accumulated positions. Securing profits at this stage was the right move, helping preserve gains while avoiding additional risk.
This strategy once again confirms the value of comprehensive analysis: combining the cluster chart, heatmap, and dashboard helps identify both entry points and timely exits.
Follow new insights in our telegram channel.
No need to invent complex schemes and look for the "grail". Use the Resonance platform tools.
Register via the link — get a bonus and start earning:
OKX | BingX.
Promo code TOPBLOG gives you a 10% discount on any Resonance tariff plan.
Recommended articles


