WLD +43.9% (Resonance Directional Strategy)

An example of a trade in which the key factor was the loss of market selling efficiency and the price’s reaction to volume. Cluster analysis and aggregated data indicated the formation of a local shortfall, which allowed the momentum to be reversed and the position to be locked in a high-risk zone.
Table of contents

Coin: WLD/USDT
Risk: medium
Level of understanding: beginner
Reasons for entry
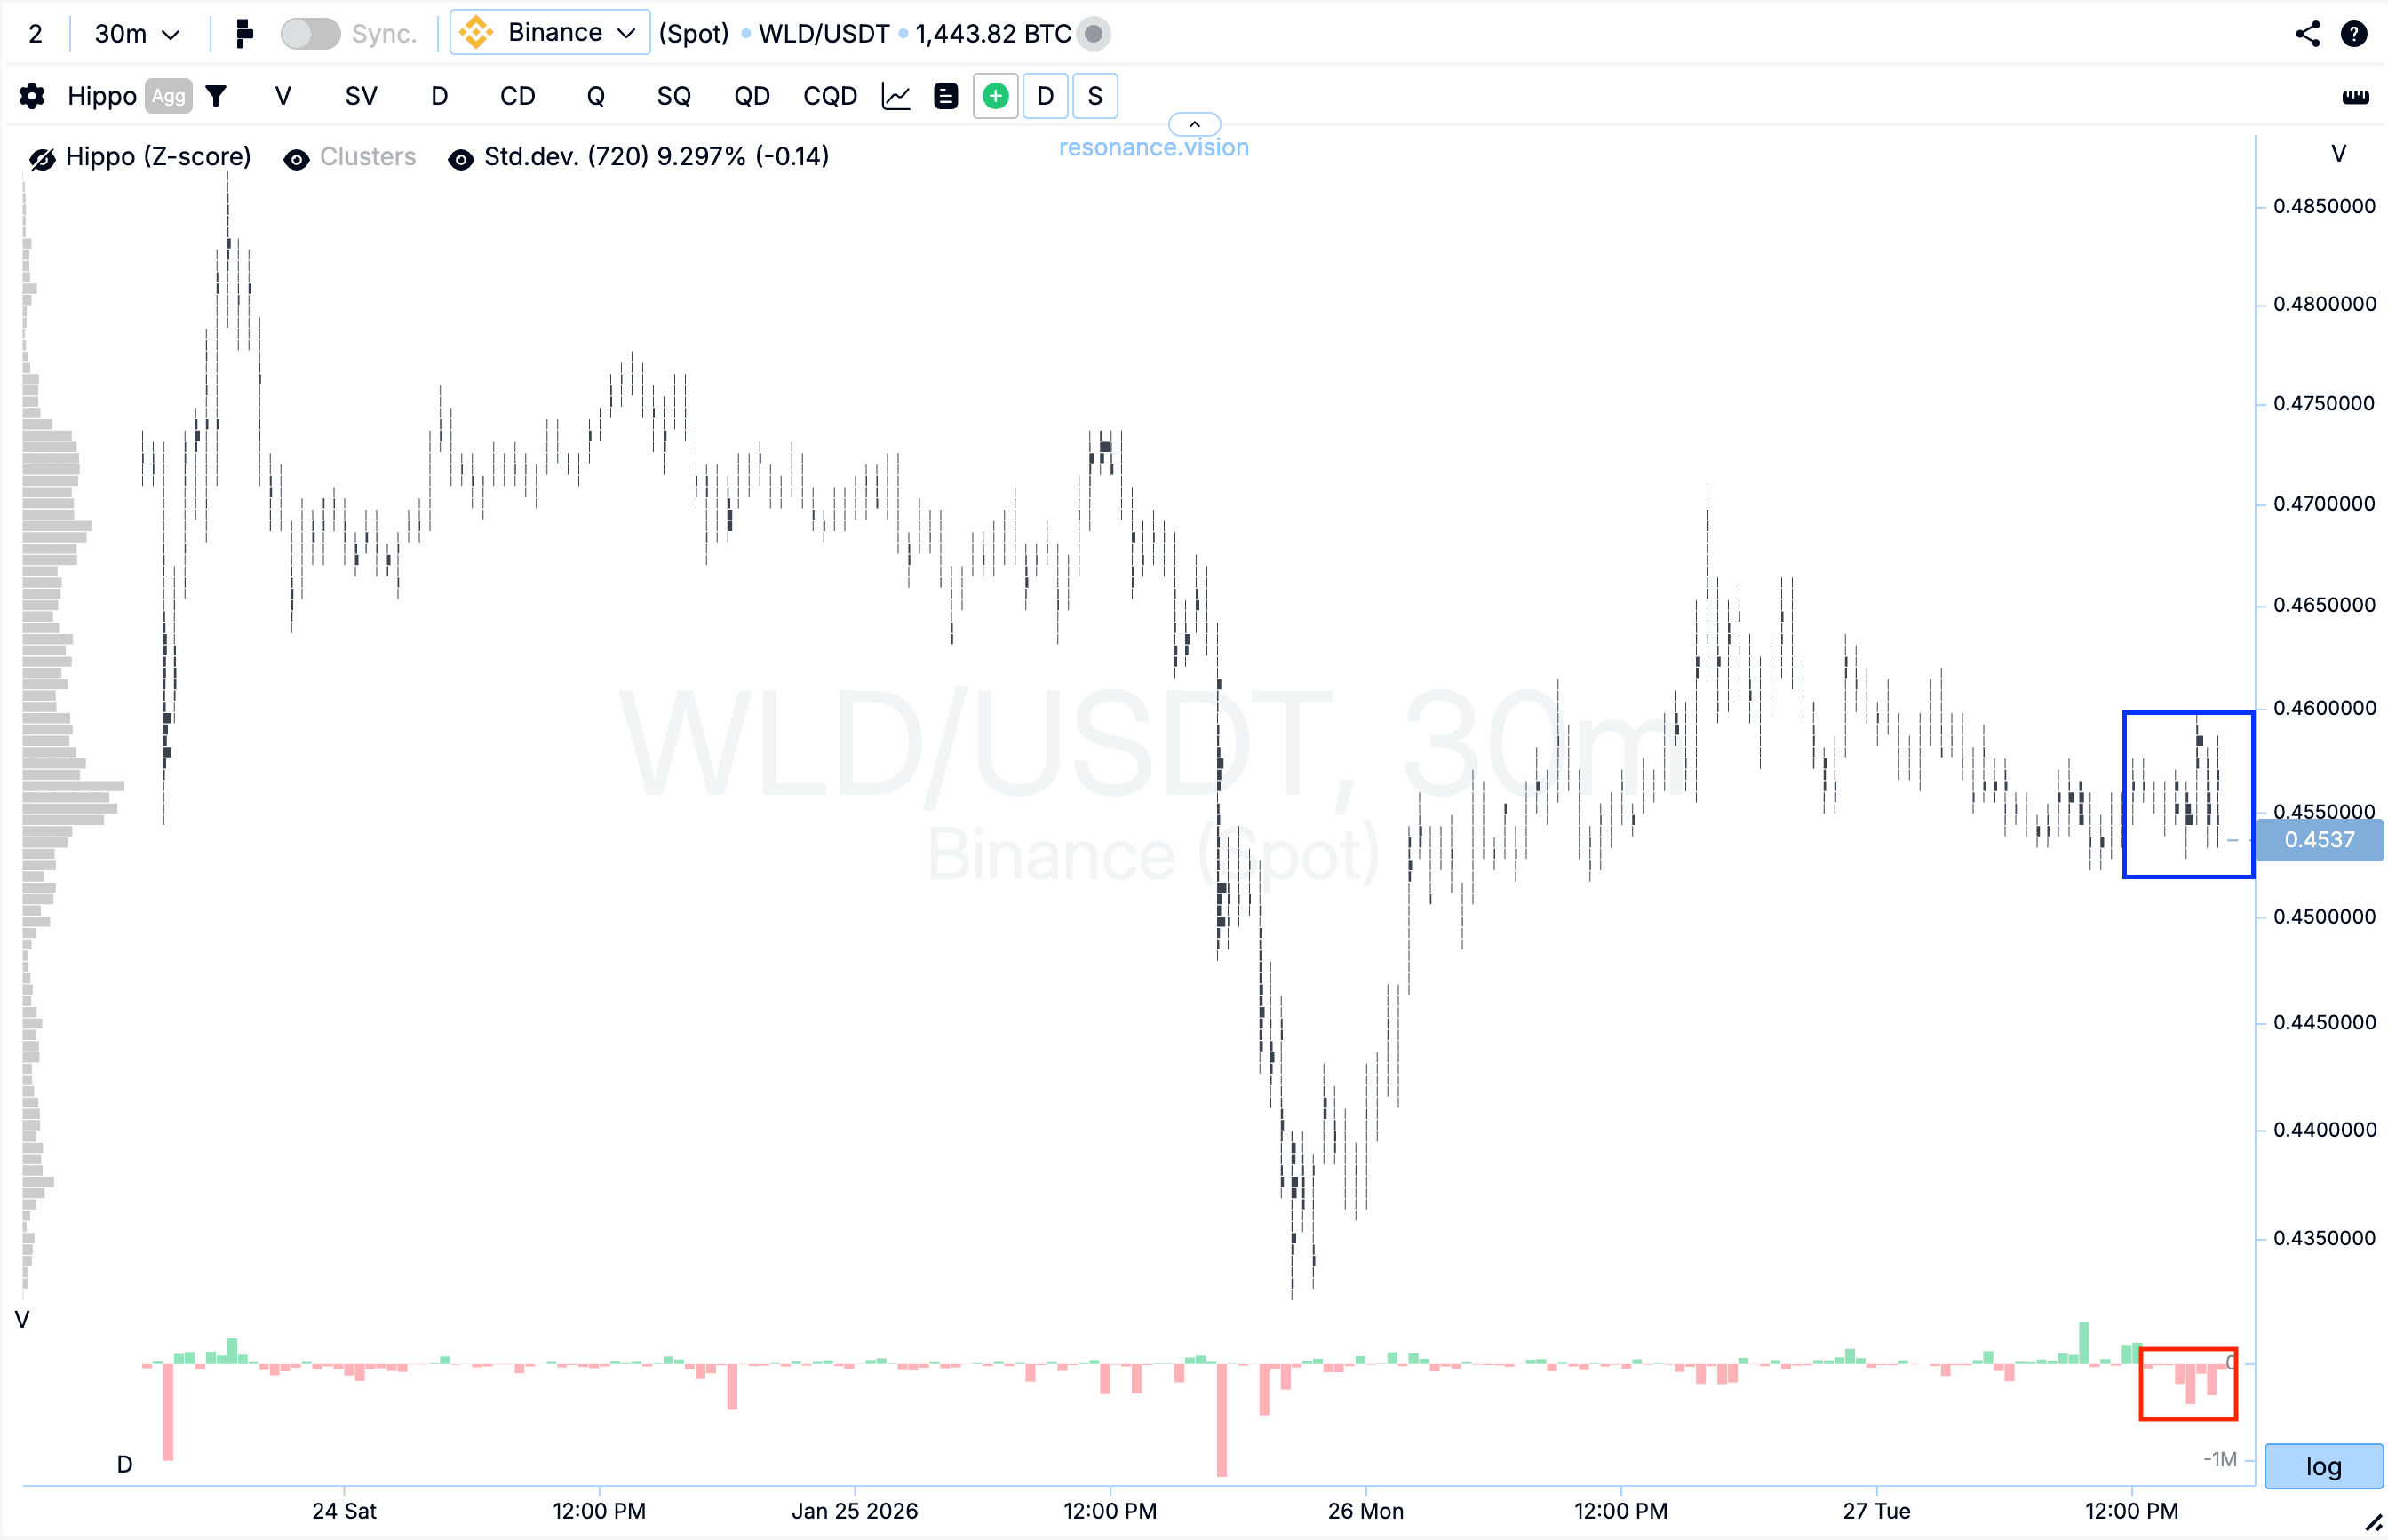
Cluster chart: Locally, during the sideways consolidation phase, large volume clusters were formed (blue rectangle), within which noticeable market sell orders were observed (red rectangle). However, despite the increasing pressure from sellers, the price stopped declining.
Such a market reaction indicates growing demand and the presence of signs of a local deficit: sellers continue to expend volume, but their impact on price becomes ineffective. This kind of imbalance between volume and price result often acts as the first signal of weakening bearish initiative.
In the Dashboard
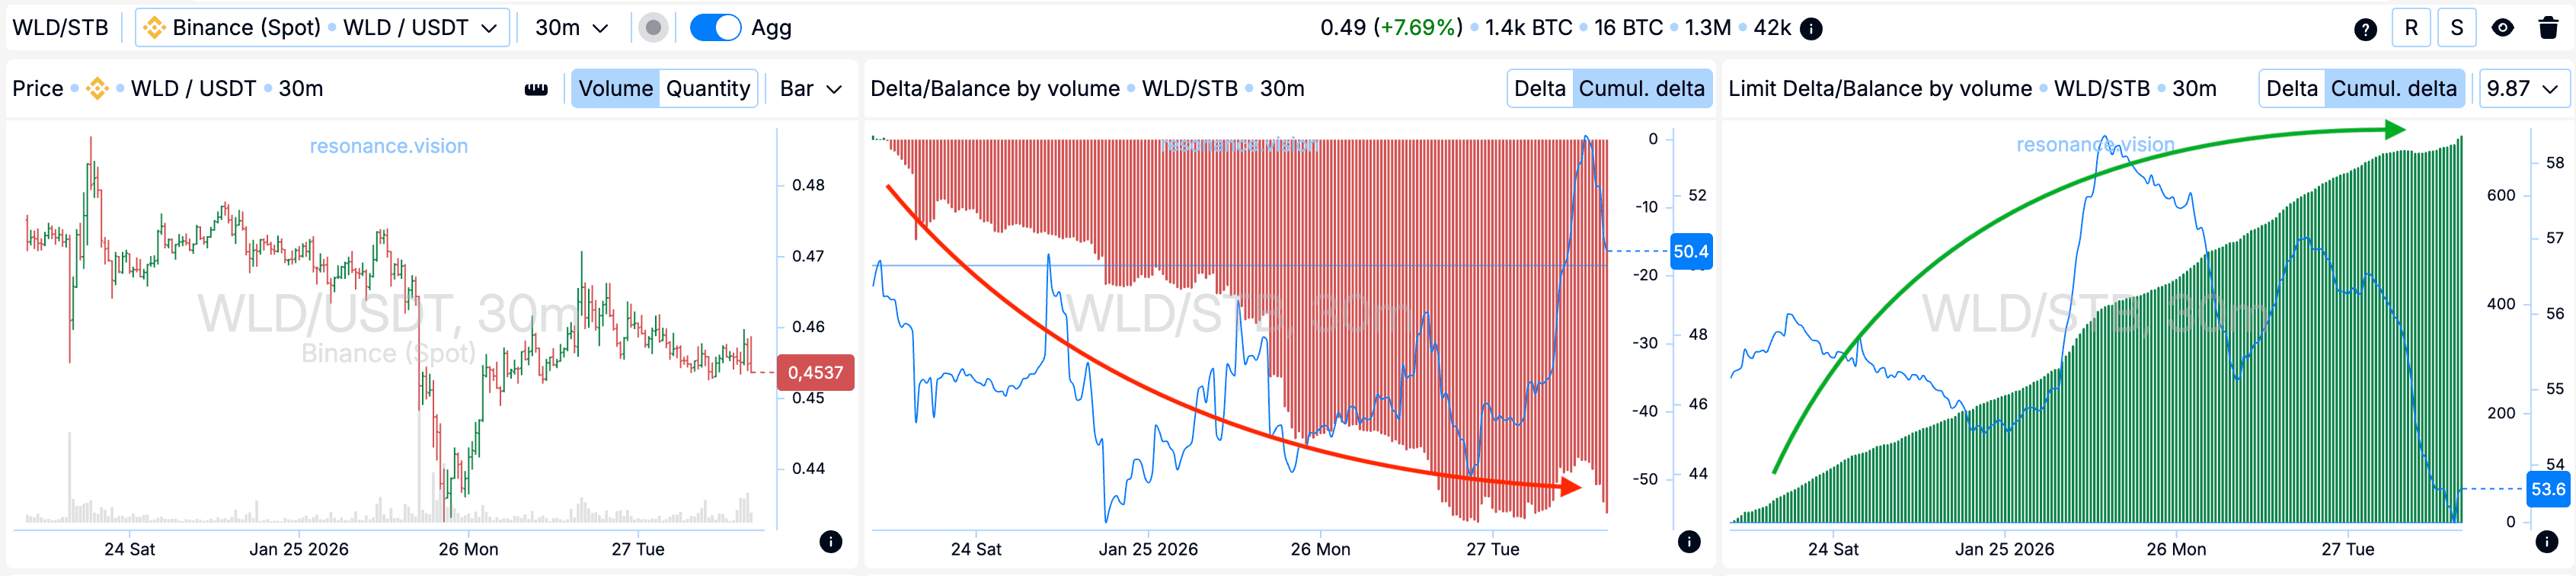
Delta / Volume balance and limit delta: Aggregated data across all pairs and exchanges confirm the observations from the cluster chart. During the analyzed period, the market was under pronounced cumulative pressure from market sell orders, which is clearly visible on the cumulative delta histogram (red arrow).
At the same time, the limit delta shows a cumulative increase in limit buy orders (green arrow). This combination indicates active absorption of incoming market sell volume by limit buyers, forming local support in this price range and further confirming signs of supply deficit.
Reasons for exit
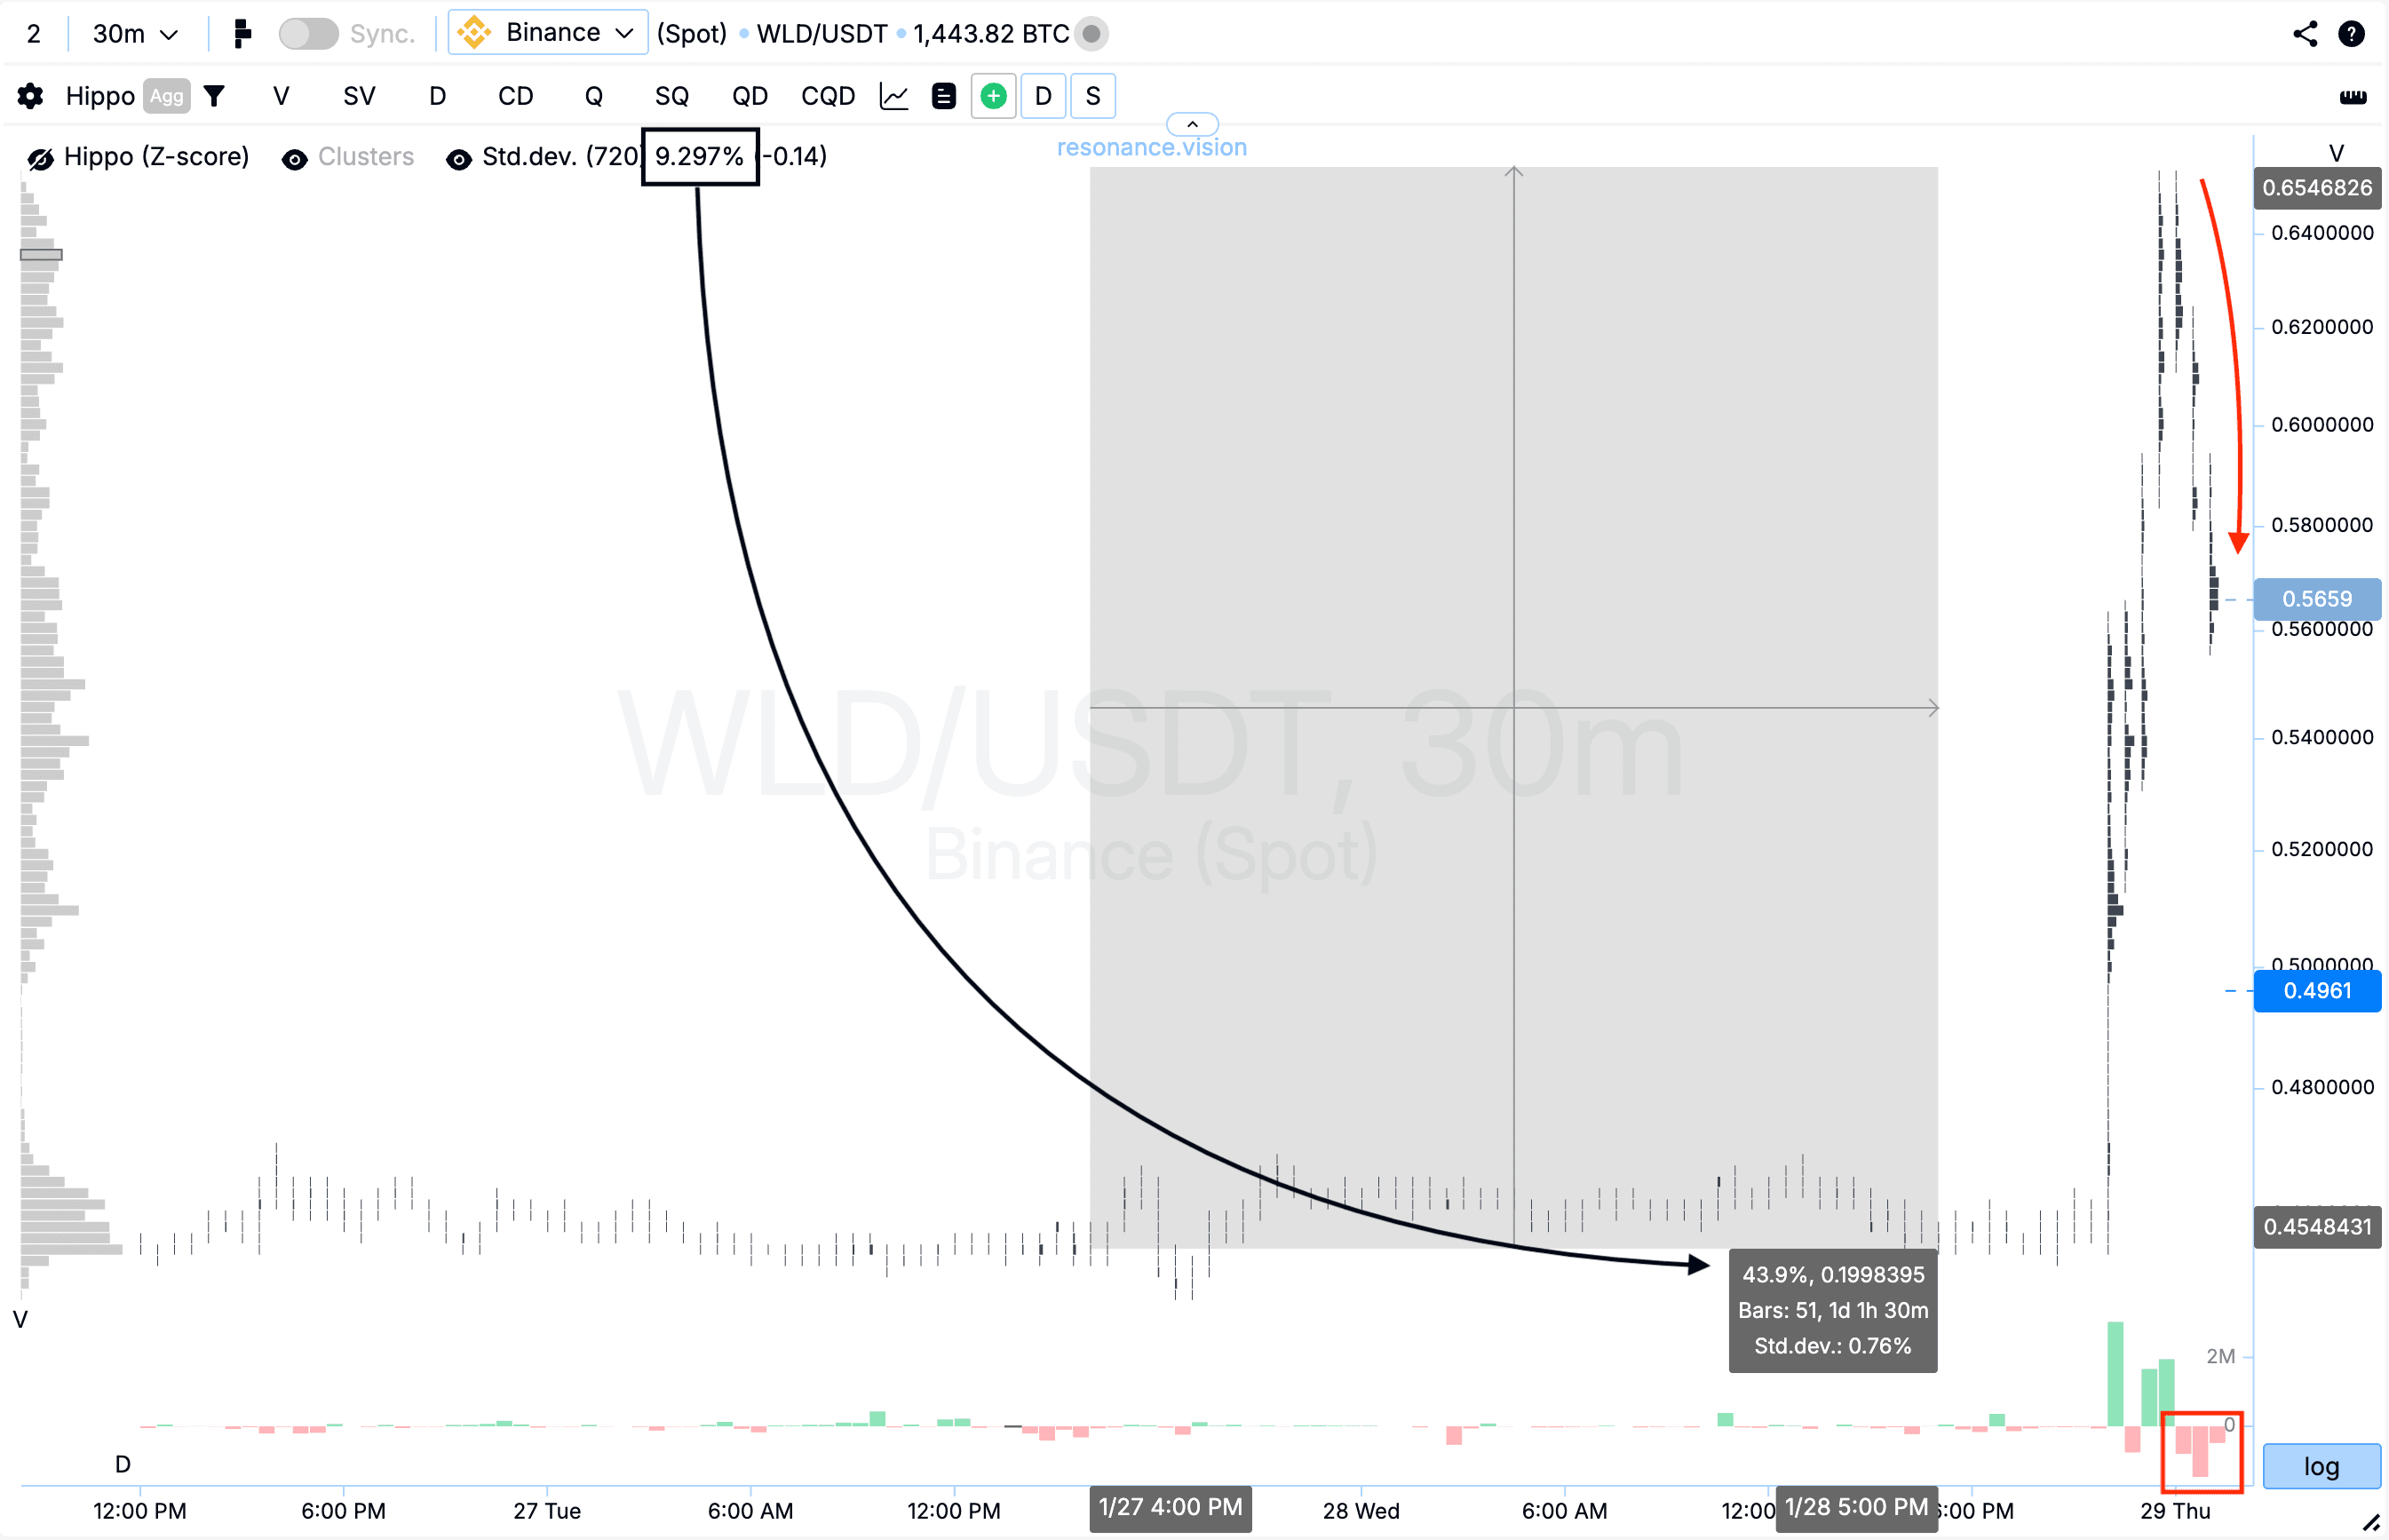
Cluster chart: After the entry point, an impulsive move of more than 40% occurred, which is a significant price movement and corresponds to almost five standard moves, i.e., statistically anomalous (black rectangle and arrow).
After that, market sell orders began to dominate, on the background of which a significant pullback formed (red rectangle and arrow). Such dynamics indicate growing uncertainty and often signal a transition of the market into a balance-search phase. Under these conditions, further holding of the position would increase risk, therefore closing the position appeared to be the most rational and balanced decision, allowing the realized move to be locked in and the result to be protected.
Conclusion
This analysis clearly illustrates that significant market moves are formed not by volume itself, but by the price reaction to that volume. Despite prolonged pressure from market sell orders, the price stopped declining, which indicated a decrease in sellers’ effectiveness and the emergence of signs of a local deficit.
Such situations occur quite often, however, the key factor here is not the fact of volume growth or decline itself, but the behavior of price in response to it.
Follow new insights in our telegram channel.
No need to invent complex schemes and look for the "grail". Use the Resonance platform tools.
Register via the link — get a bonus and start earning:
OKX | BingX | KuCoin.
Promo code TOPBLOG gives you a 10% discount on any Resonance tariff plan.
Recommended articles


