XPL: Trend-Continuation Long Setup

A good example of when you look for mid-term ideas but end up finding an excellent intraday trade. It all started with observing a strong uptrend on the 1H timeframe. Special attention was paid to how price reacted to selling: the sells did not trigger a deep correction, which often points to buyer strength. A detailed 15M analysis and confirmation with aggregated metrics helped identify an entry with strong risk/reward potential.
Table of contents
Sometimes you’re looking for a mid-term idea, but the market delivers a great intraday trade. In this XPL case, the key signal was simple: market sells were present, but they didn’t produce a pullback. When selling pressure exists without a meaningful result, it often indicates absorption and buyer strength. From there, two steps remain: refine the entry on a lower timeframe and confirm the idea with aggregated metrics.
1H context: why the idea stood out
On the 1H timeframe, XPL was in a strong uptrend (green arrow). The cluster view shows an active buyer (green rectangles) and fresh local highs.
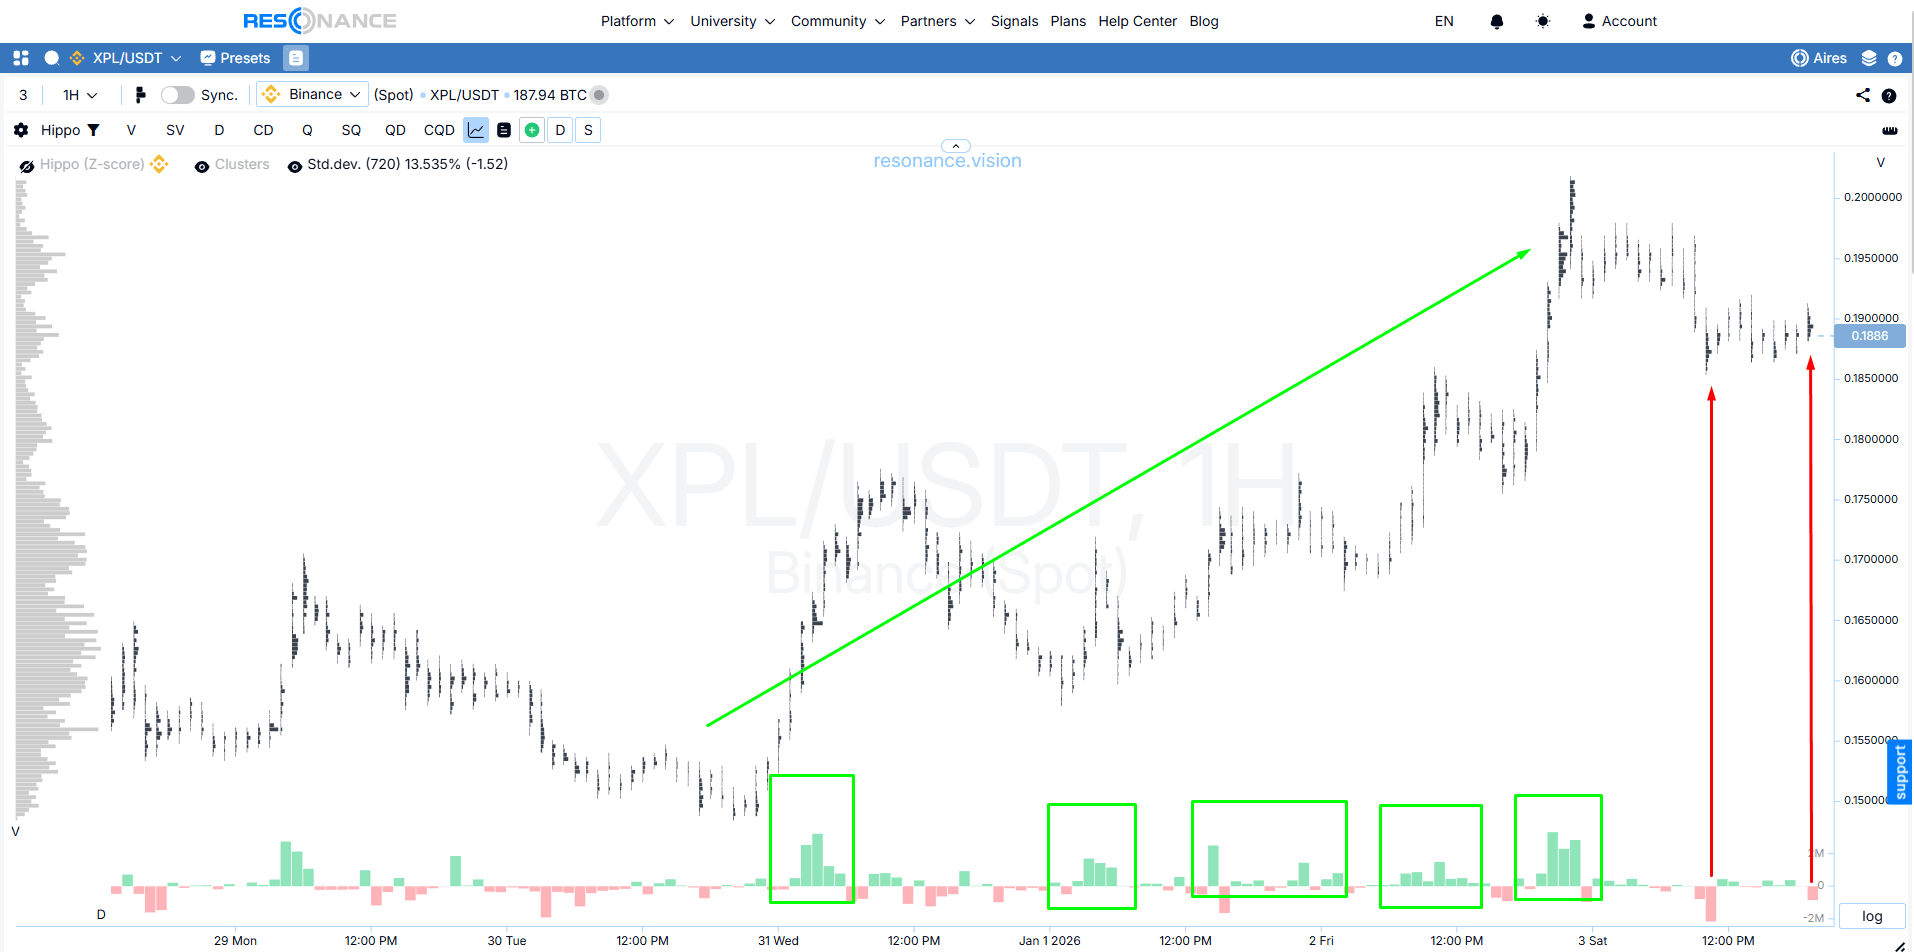
The key point is the reaction to selling (red arrows): selling does not lead to a meaningful price drop. This is a sign of selling inefficiency—volume “pushes,” but price does not deliver a strong pullback.
The logic for the next step is straightforward: if selling can’t push price down on the higher timeframe, the lower timeframe often offers a clean long entry structure (range/holding).
15M entry: range holding after the pullback
On 15M, after a small pullback, price moves sideways (blue rectangle). Inside the range, selling is visible again, but it fails to print new local lows (green arrows).
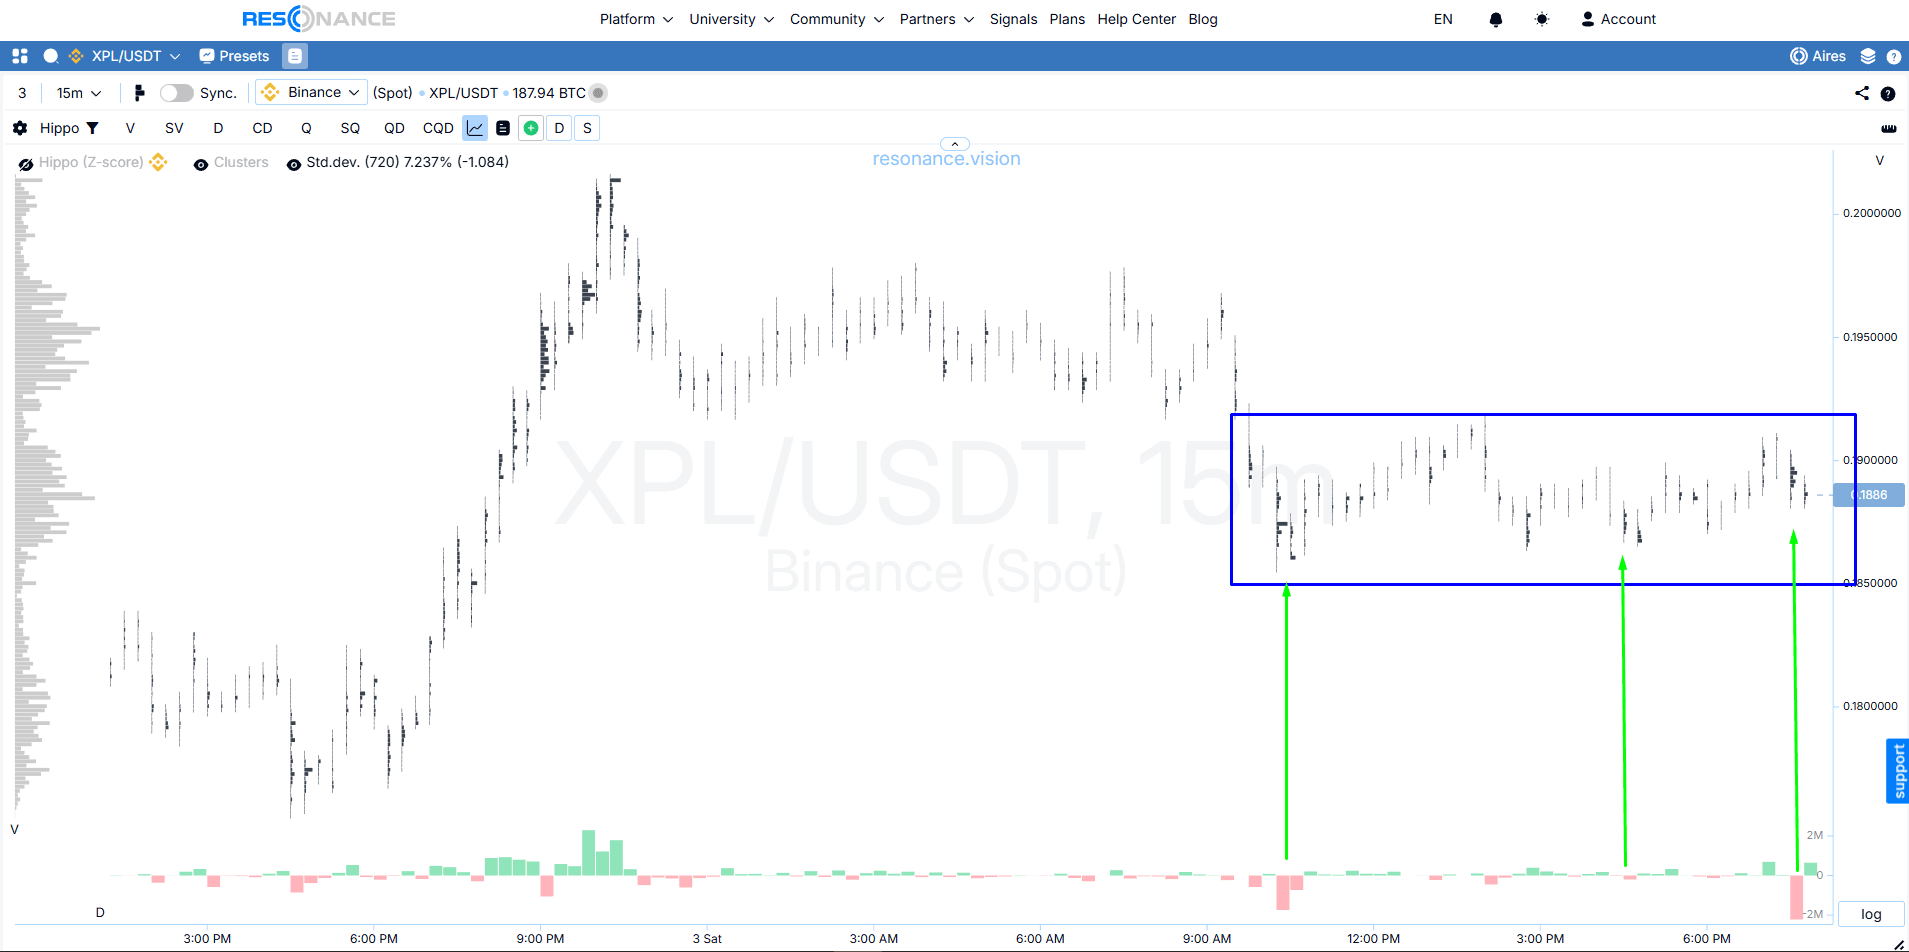
This type of holding most often means that limit demand continues to absorb market sells. The probability of an upside break increases.
Where to enter: after the hold is confirmed (price stays within the range and attempts to push lower fail to produce results).
Where to place the stop: below the lower boundary of the range / below the local 15M low. This makes risk clear and capped.
Confirmation via aggregated metrics (dashboard)
To strengthen the trade idea, we look at aggregated metrics.
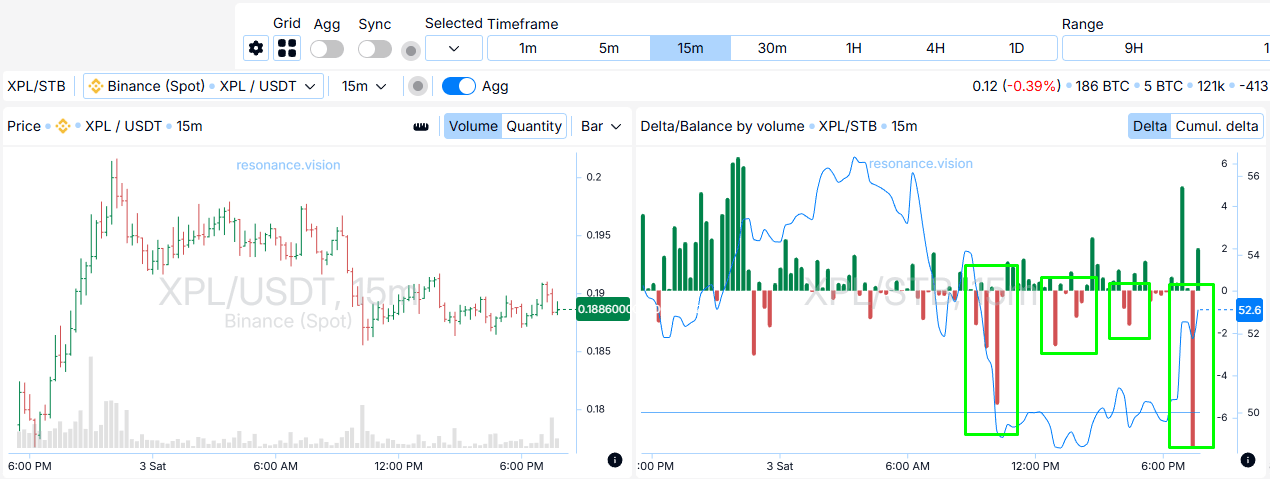
Delta / volume balance: on an aggregated view, substantial selling dominates, yet price does not fall. This reinforces the idea: the seller is active but inefficient—meaning demand is absorbing supply.
Exit reasons and position management
From the moment the idea was identified, the coin moved up by almost 7% (a strong intraday move).
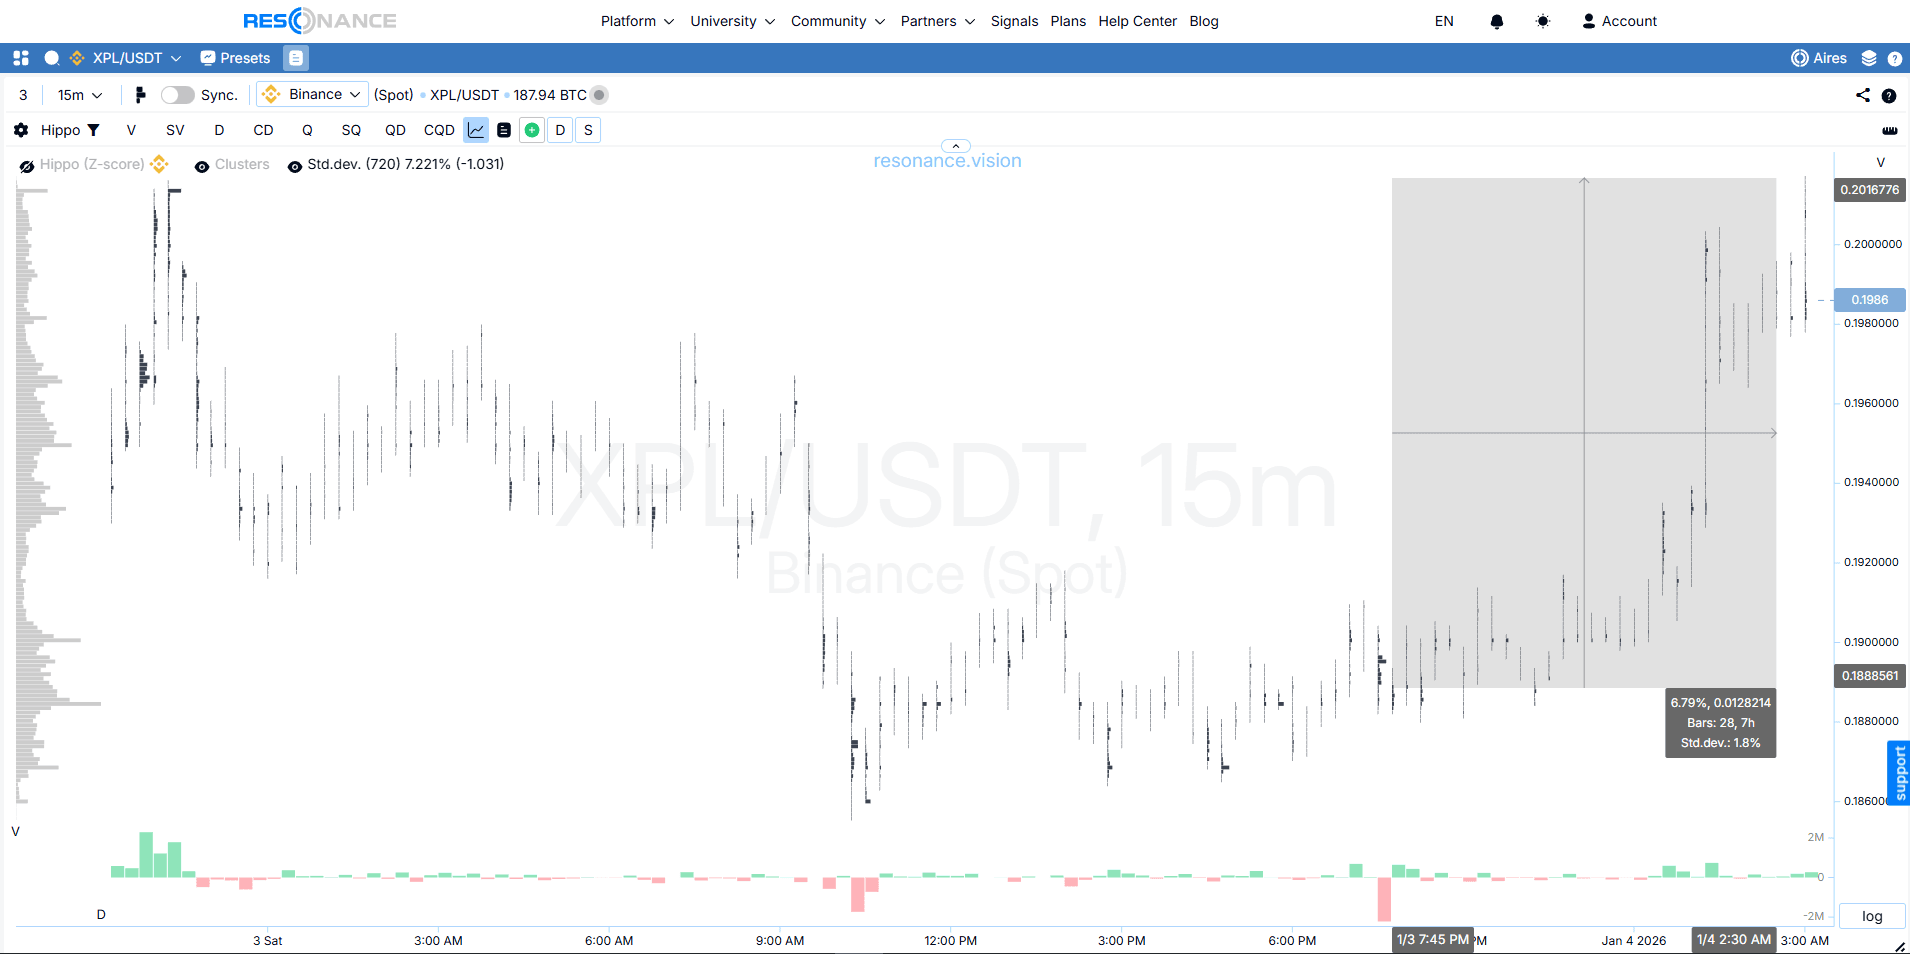
From there, two clear scenarios make sense:
Take profit after the impulse.
If the goal is to capture the “clean part” of the move, exiting right after the impulse is logical. In this case, the risk/reward stayed at no less than 1:2.
Trail with a stop.
If you want to give price room and try to capture more, you can manage the position by moving the stop into profit as the move develops. A pullback then closes you in profit without having to guess the exact top.
Trade conclusion
This example highlights the core principle of the Resonance directional approach: edge comes from evaluating volume and its impact on price.
Recommended articles


