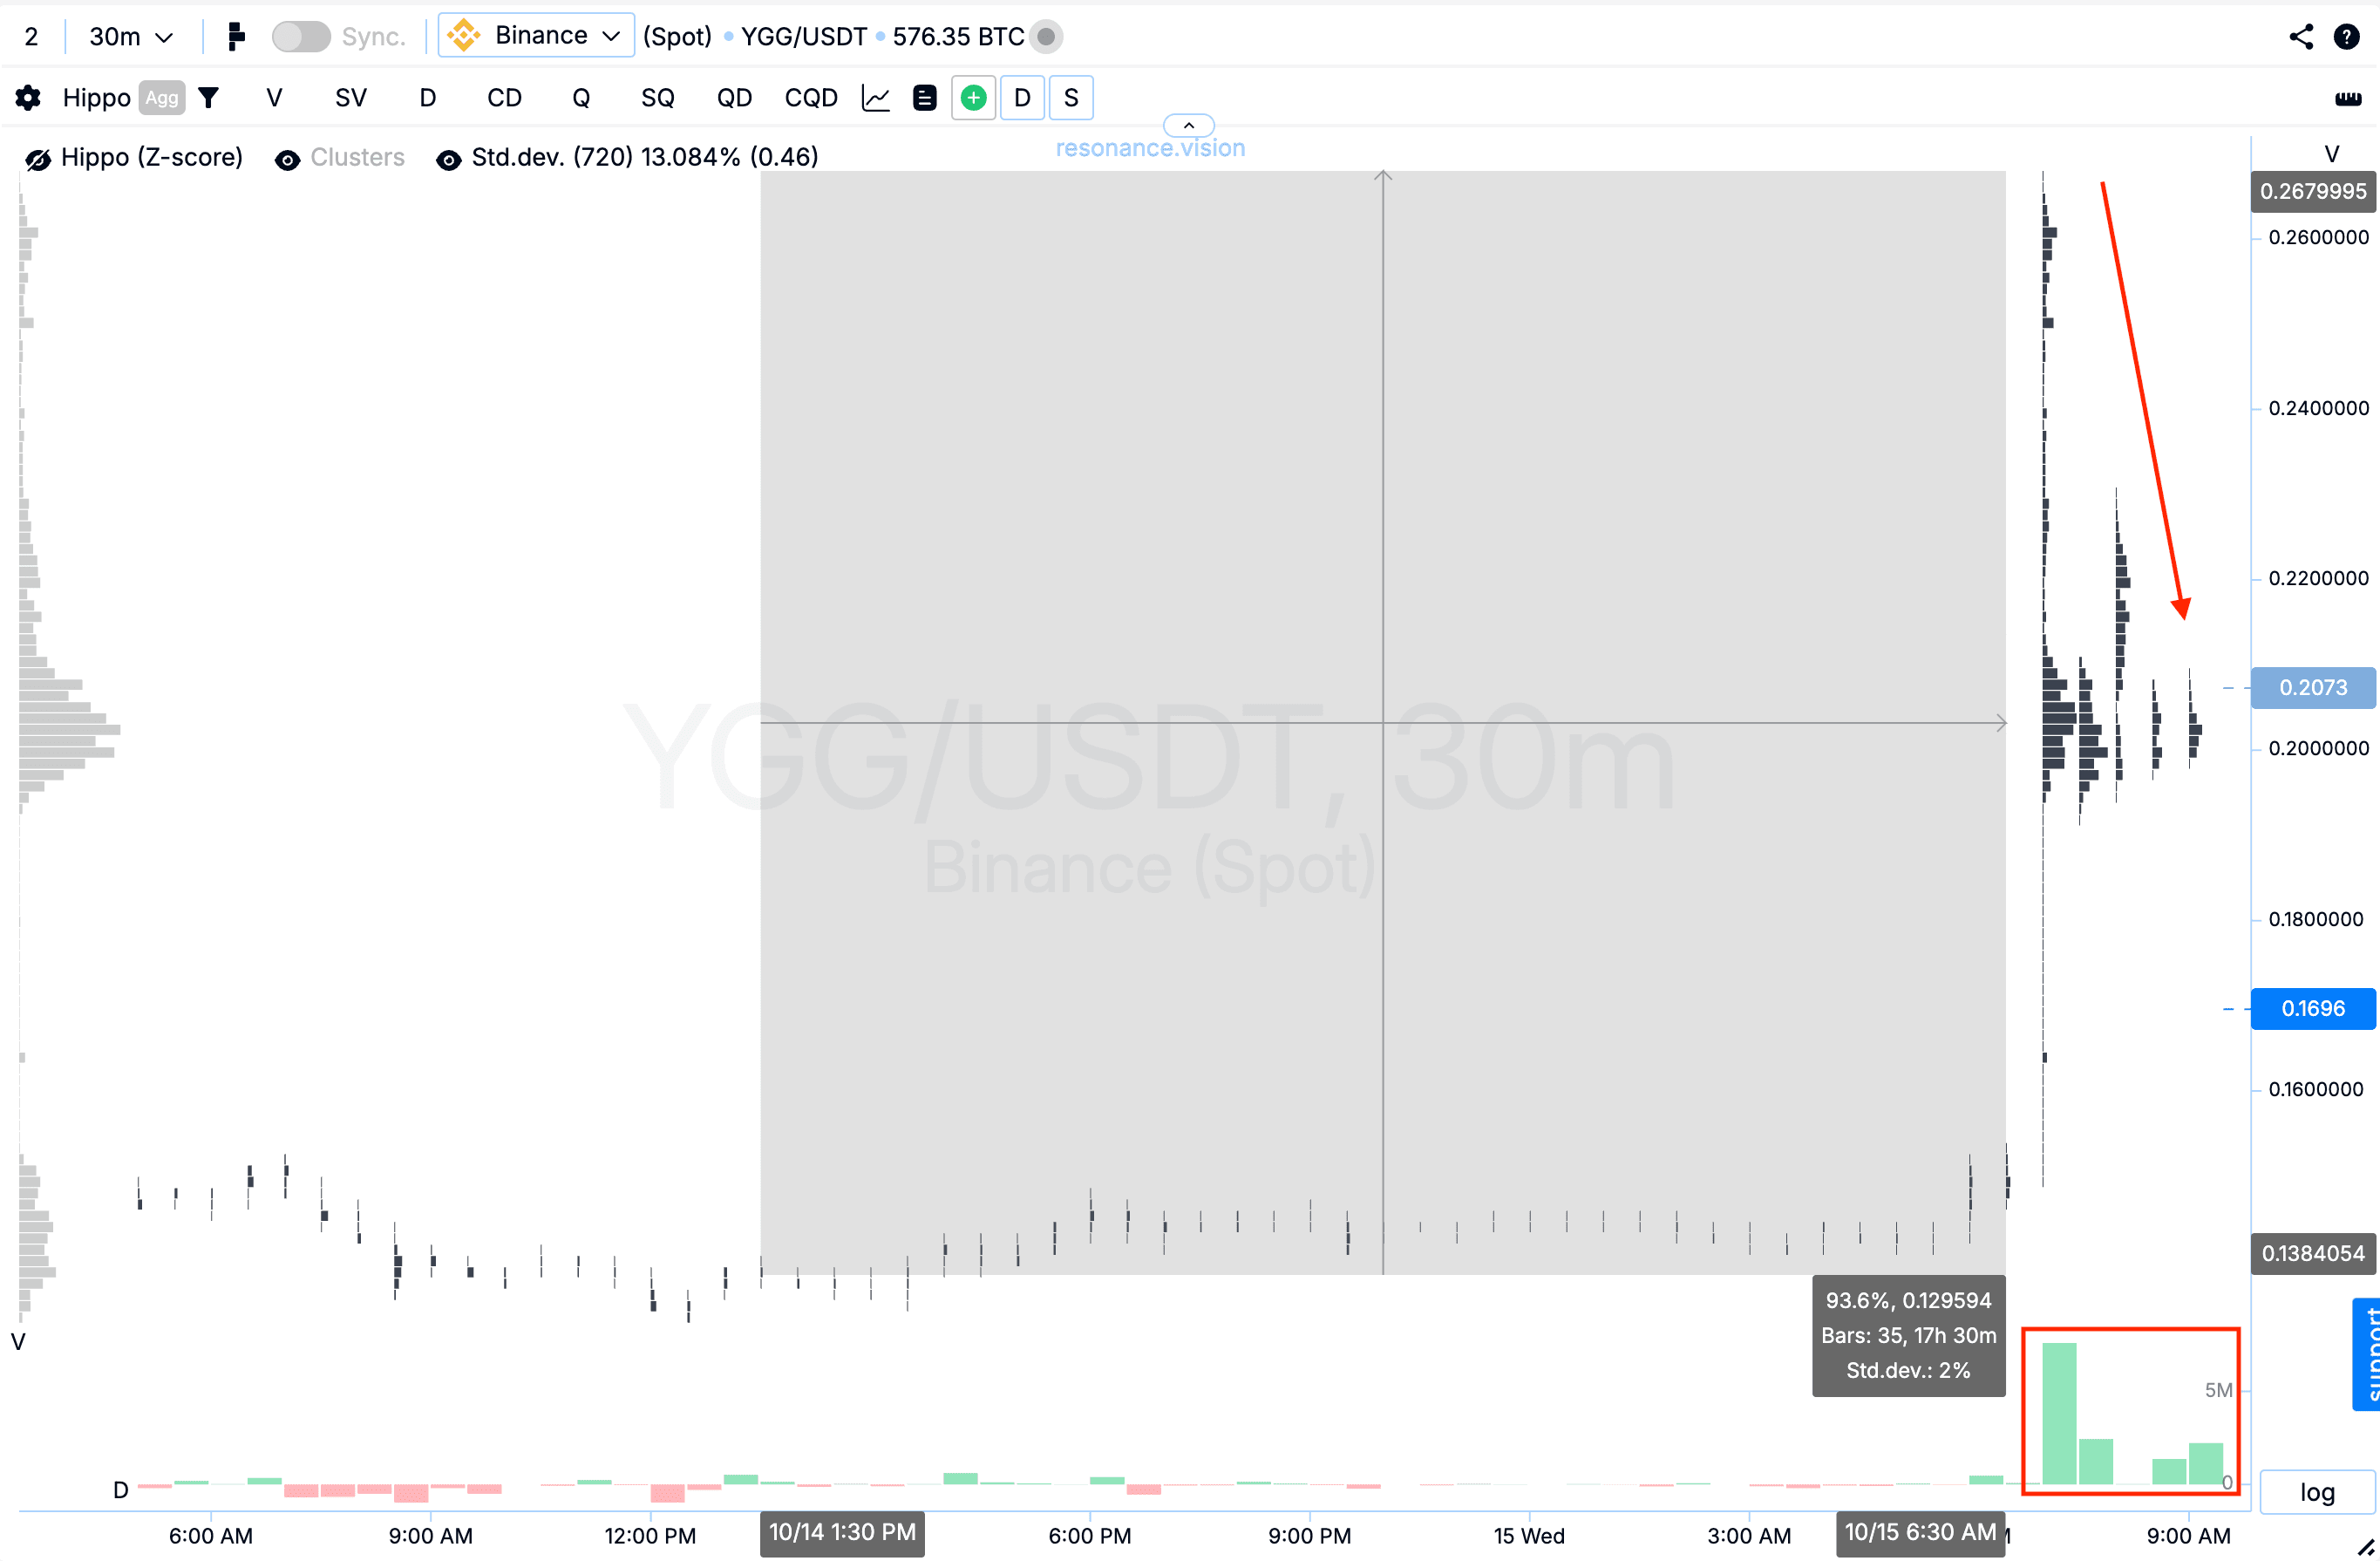
YGG +93.6% (Напрямкова стратегія Resonance)

Монета YGG/USDT показала чіткий приклад розвороту після локального дефіциту продавців. Вхід був підтверджений кластерним аналізом та агрегованими даними, включаючи аномальне відхилення Z-Score та низьку волатильність. Після імпульсного зростання майже на 100% зниження ефективності покупок стало сигналом до фіксації прибутку та завершення угоди.
Зміст

Монета: YGG/USDT
Ризик: середній
Рівень розуміння: новачок
Причини входу
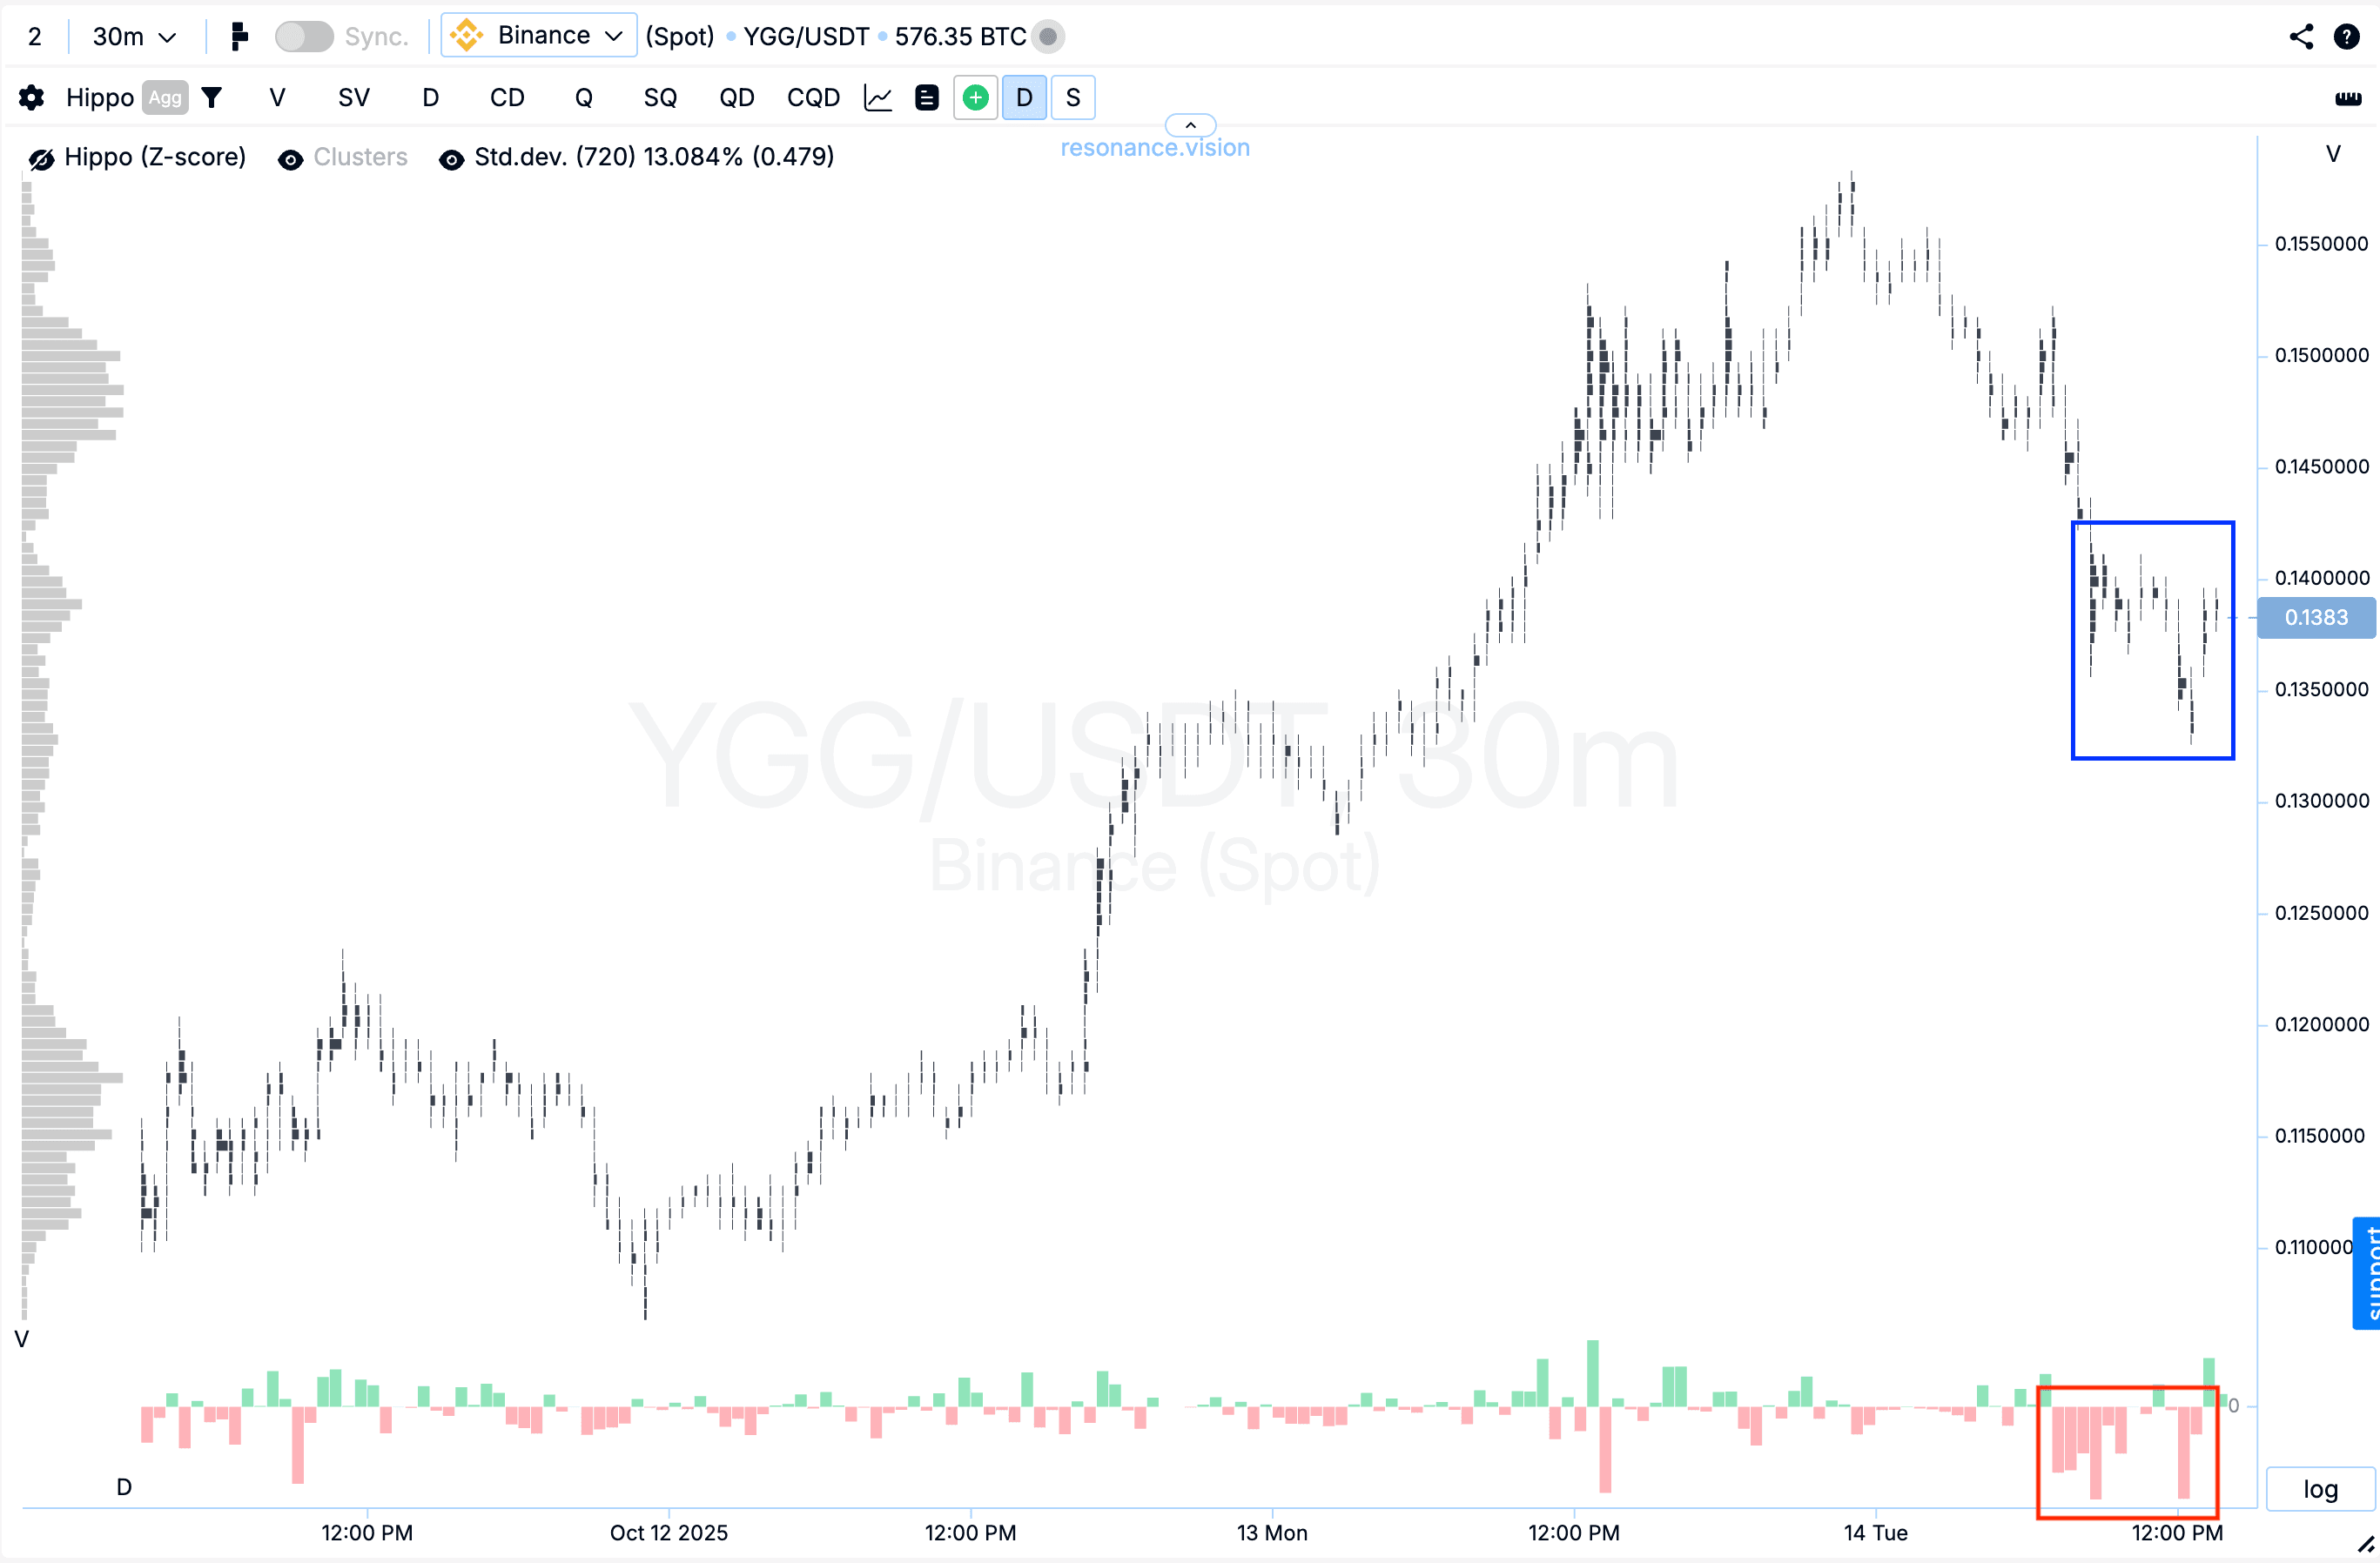
Кластерний графік: на відкаті почали формуватися великі об’ємні кластери (синій прямокутник), усередині яких помітно домінували продажі (червоний прямокутник). Проте ціна практично не відреагувала та не змогла оновити локальний мінімум, що може вказувати на локальний дефіцит пропозиції та послаблення тиску з боку продавців.
У Дешборді
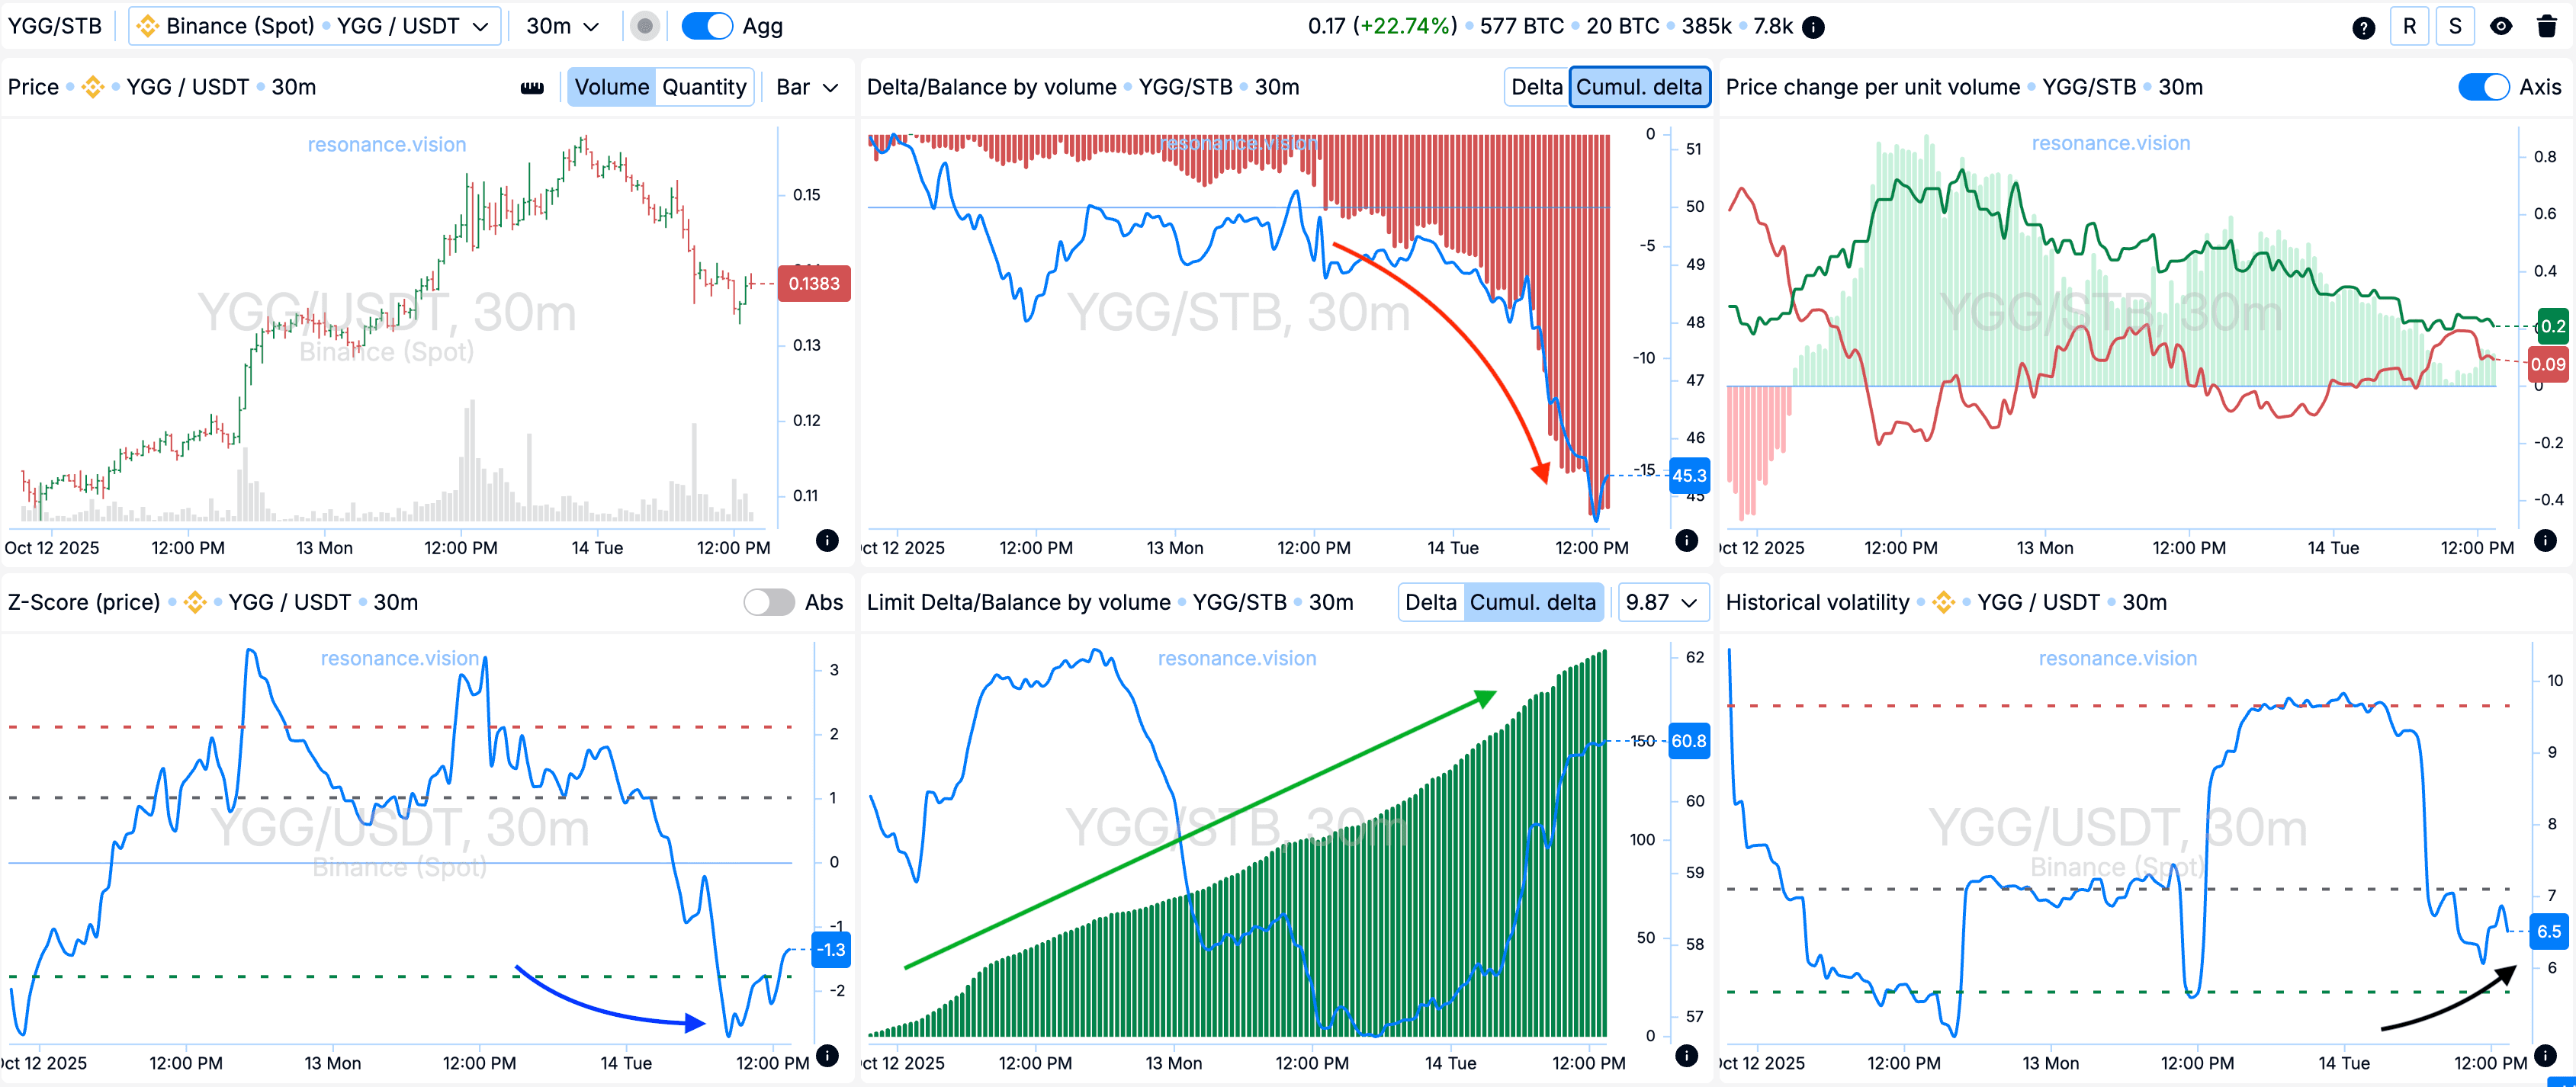
Дельта/Баланс за об’ємом та лімітна дельта: агреговані дані показують помітне зростання об’ємів продажів по всіх парах та біржах, що добре видно по гістограмі кумулятивної дельти (червона стрілка). Однак, незважаючи на виражений тиск із боку продавців, ціна не продовжує знижуватися, що вже зазначалося раніше на кластерному графіку.
Одночасно за лімітними заявками видно активне підставлення заявок на купівлю - гістограма кум. дельти (зелена стрілка) потенційно об’єми за лімітними заявками приймають весь об’єм продажів, тим самим утримуючи ціну від подальшого зниження.
Z-Score (ціна): на піку зафіксовано відхилення ціни вниз більш ніж на 2 стандартні відхилення (синя стрілка). Подібна аномалія часто вказує на ймовірність локального розвороту та подальшого зростання.
Історична волатильність: в даний момент залишається на низьких значеннях (чорна стрілка), що може говорити про її подальше збільшення та формування сильного цінового руху.
Причини виходу
Кластерний графік: після імпульсного зростання майже на 100% ціна сформувала сильний відкат. У цей момент по дельті видно, що ринкові покупки продовжувалися, проте тиск на ціну вони не чинили (червоний прямокутник і стрілка). Така динаміка вказує на зниження ефективності покупок, тому подальше утримання позиції було б нераціональним.
Висновок
Вхід у позицію був обґрунтований поєднанням ознак локального дефіциту та ослаблення тиску з боку продавців, підтверджених як за кластерами, так і за агрегованими даними. Додаткові сигнали у вигляді аномального відхилення Z-Score і низької волатильності посилювали ймовірність формування розворотного руху.
Імпульсне зростання підтвердило ефективність комплексного аналізу, проте подальший відкат та ослаблення реакції ціни на покупки вказували на зниження ефективності. Закриття позиції в цей момент дозволяє зафіксувати результат до початку можливої корекції чи подальшого зниження.
Стеж за новими статтями у нашому телеграм каналі.
Не треба вигадувати складних схем та шукати “грааль”. Використовуйте інструменти платформи Resonance.
Реєструйся за посиланням - отримуй бонус і починай заробляти:
OKX | BingX | KuCoin.
Промокод TOPBLOG дає тобі 10% знижки на будь-який тарифний план Resonance.
Рекомендовані статті


