YGG +17% (Directional Strategy Resonance)

YGG/USDT analysis: the market showed weakening sellers on W-formations and a loss of buyer effectiveness during local growth. The combination of cluster charts, delta, and limit volumes allowed for timely entry and exit of positions. An excellent example of working with volume deficits and surpluses.
Table of contents

Coin: YGG/USDT
Risk: low
Level of understanding: beginner
Reasons for entry
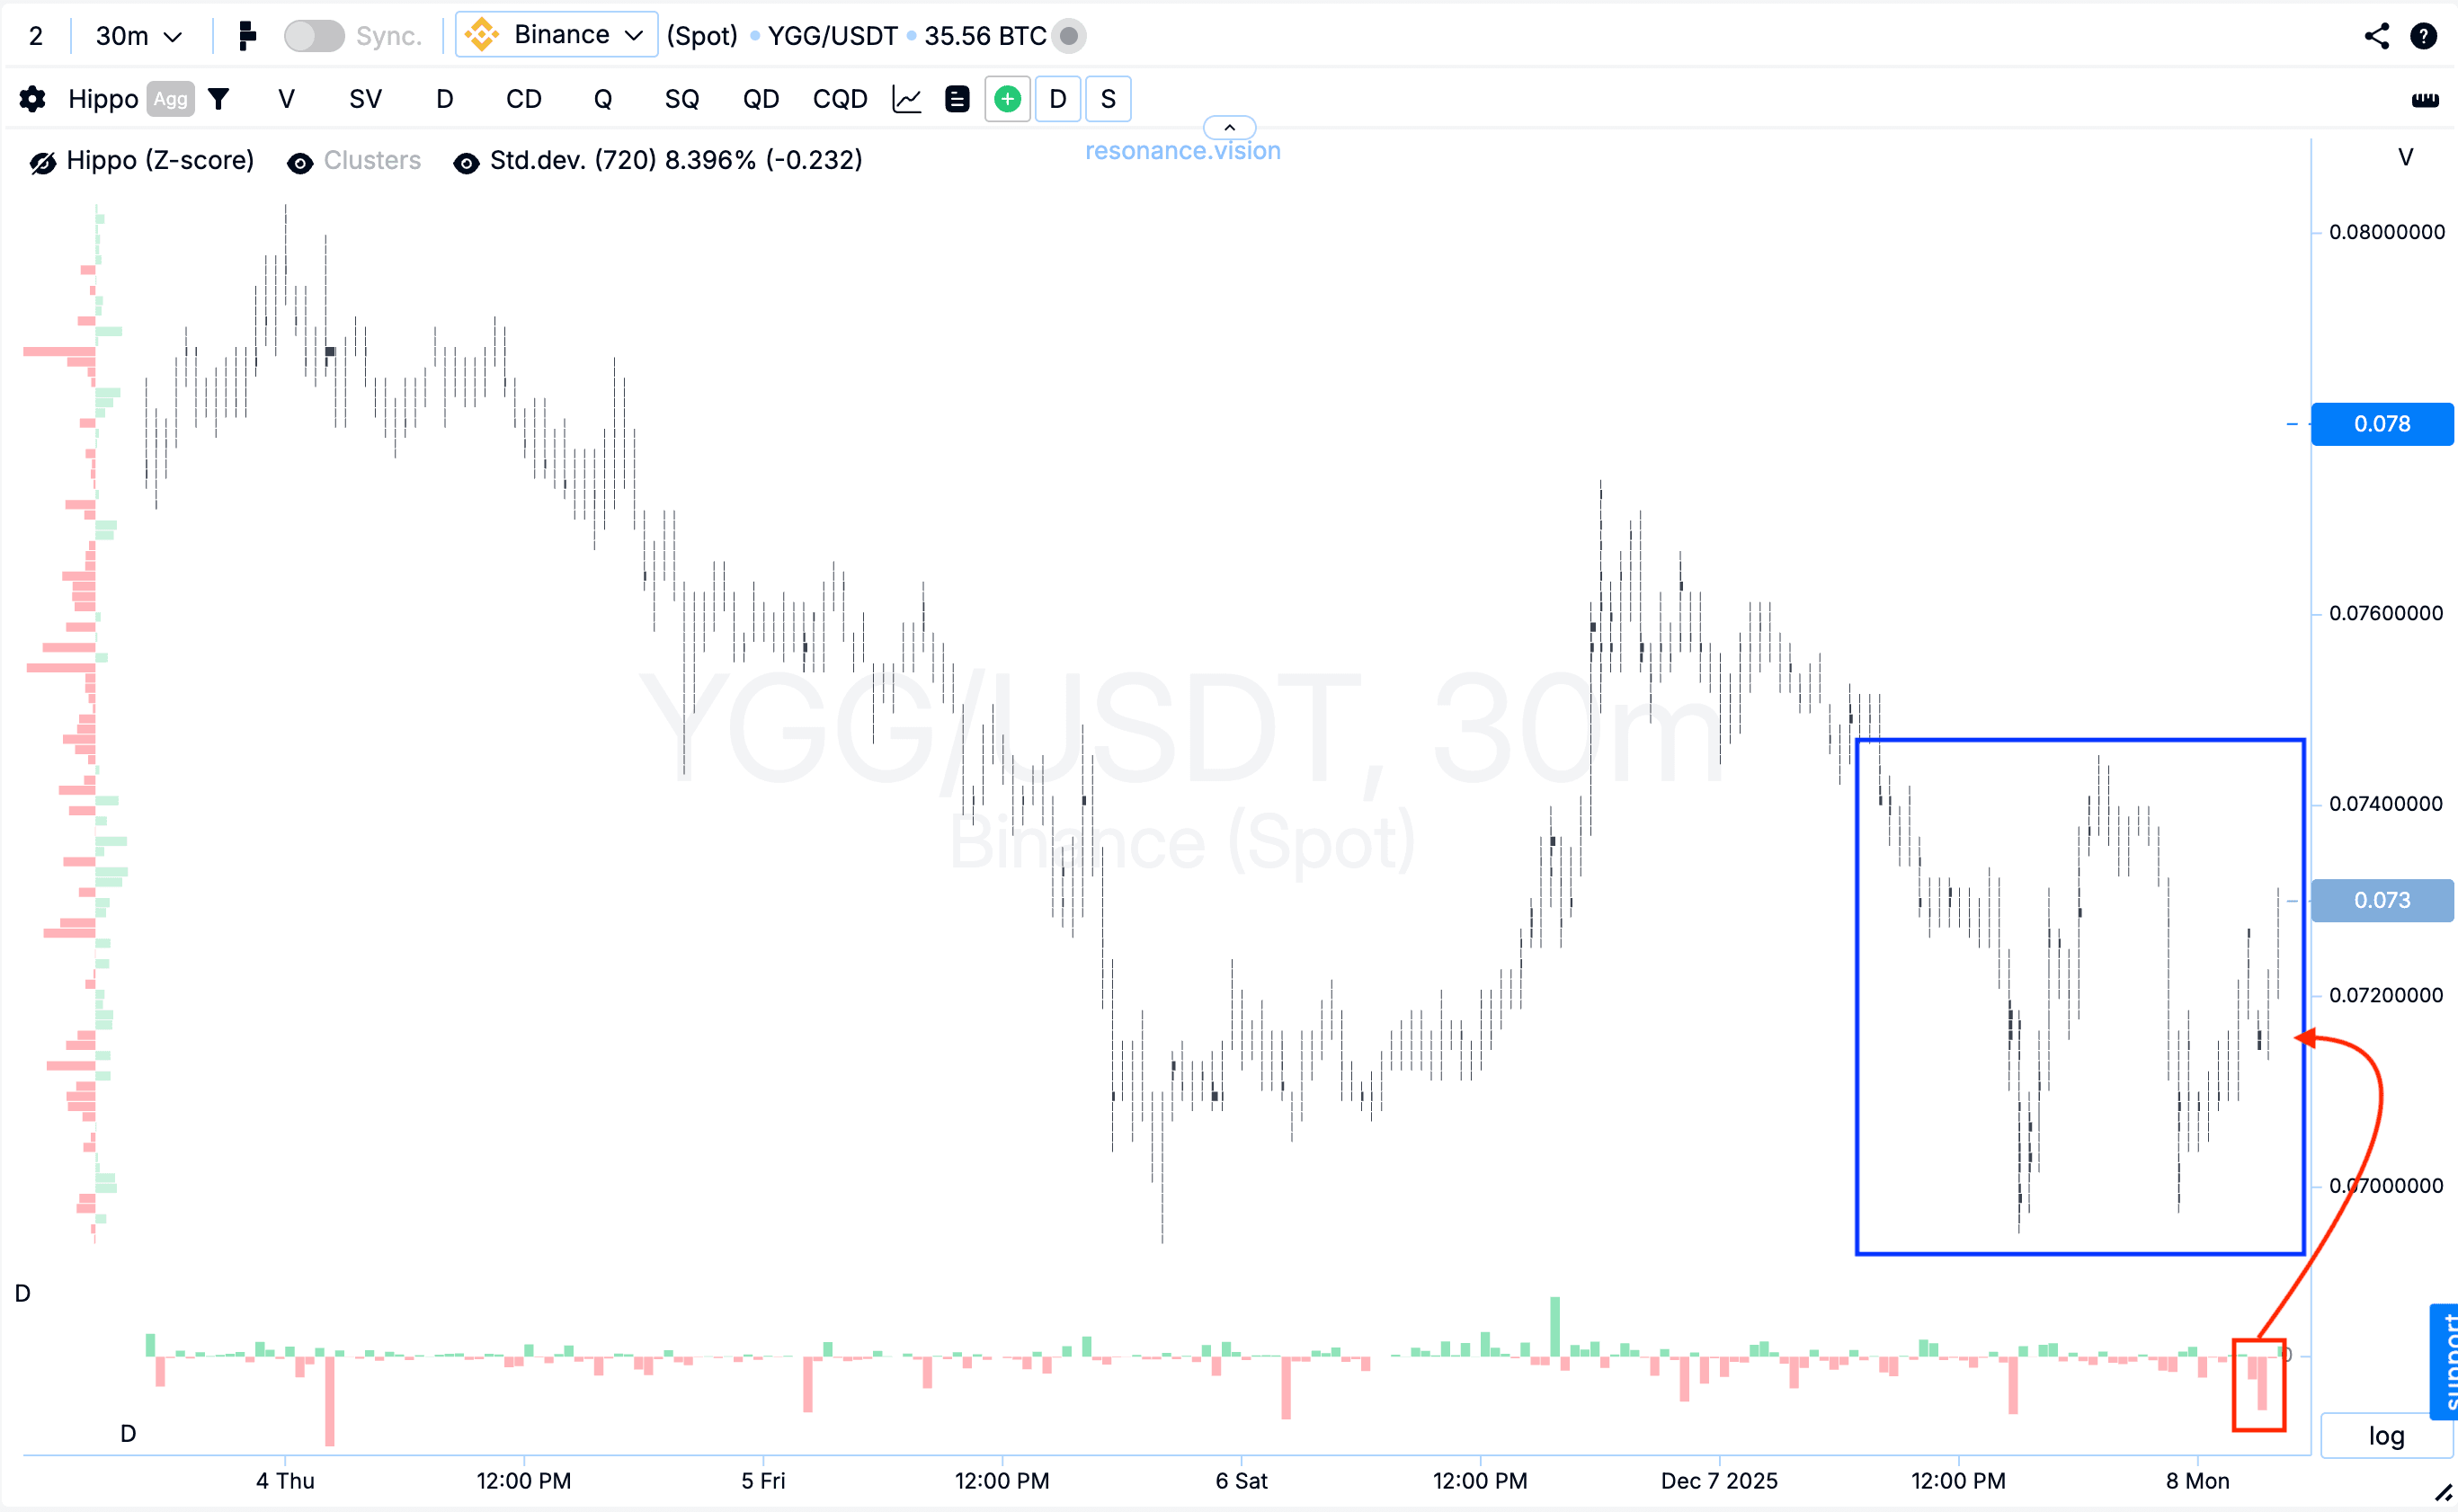
Cluster chart: a W-shaped formation appeared (blue rectangle). On the repeated decline, selling volumes increased significantly, but their effectiveness dropped — the price stopped falling (red rectangle and arrow). Such a reaction indicates a local seller deficit and weakening pressure, which often becomes the first signal of a possible reversal or a shift in initiative.
In the Dashboard
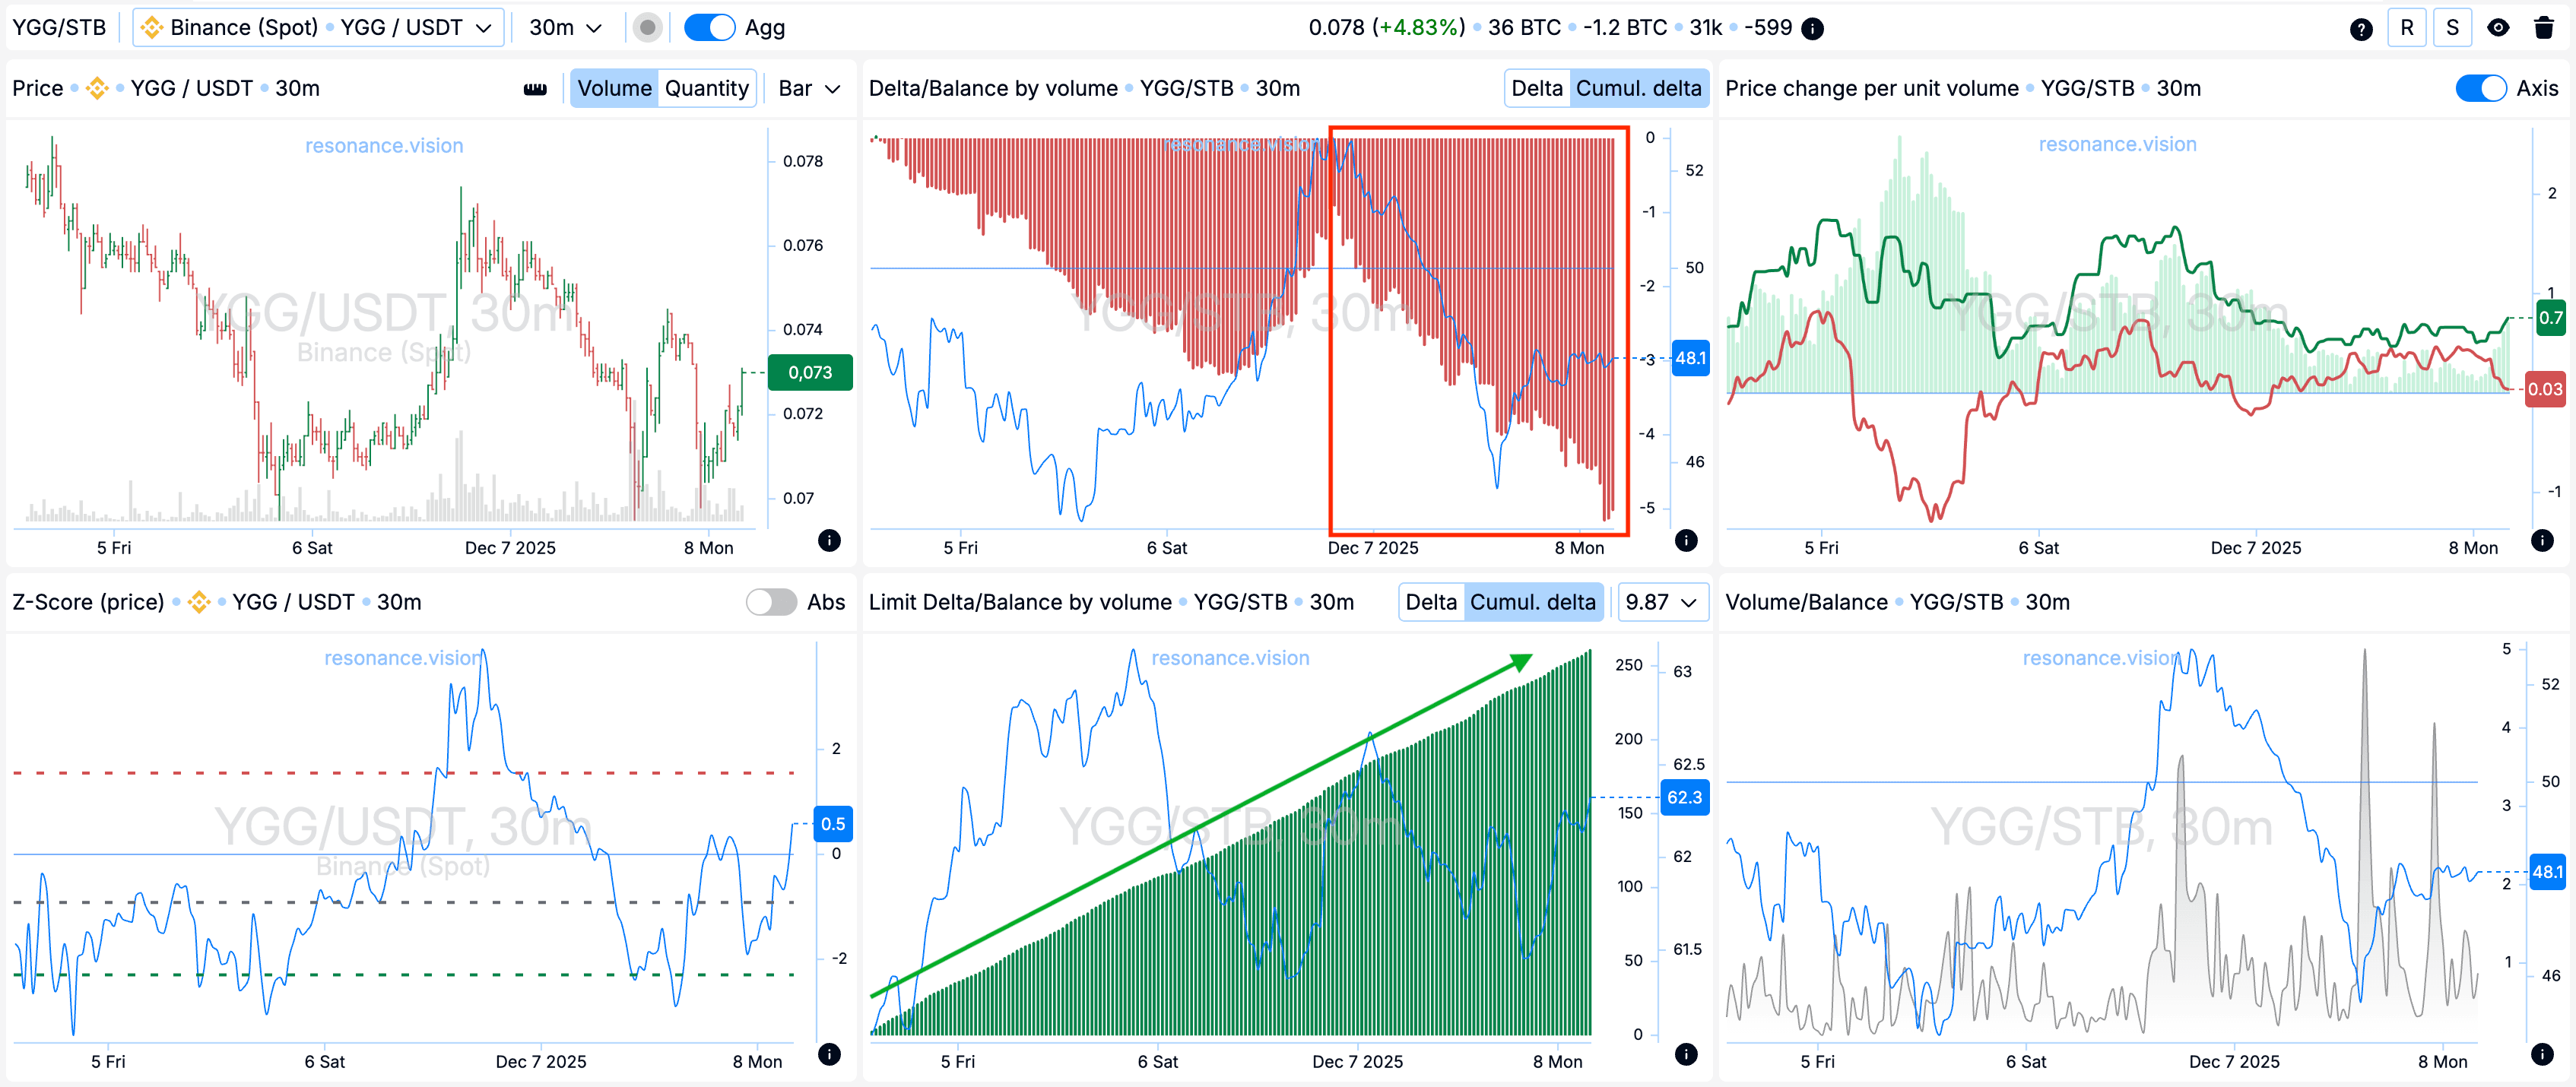
Delta / Volume balance and limit delta: aggregated data across all pairs and exchanges fully confirms the picture shown by the cluster chart. During this period, the market was under strong pressure from market sells — this is clearly visible on the cumulative delta histogram (red rectangle). But at the same time, limit order data shows a steady increase in buy-side limit orders (green arrow).
This combination indicates that limit participants are actively absorbing the entire incoming market sell volume, creating local support, and preventing the price from updating the low.
Reasons for exit
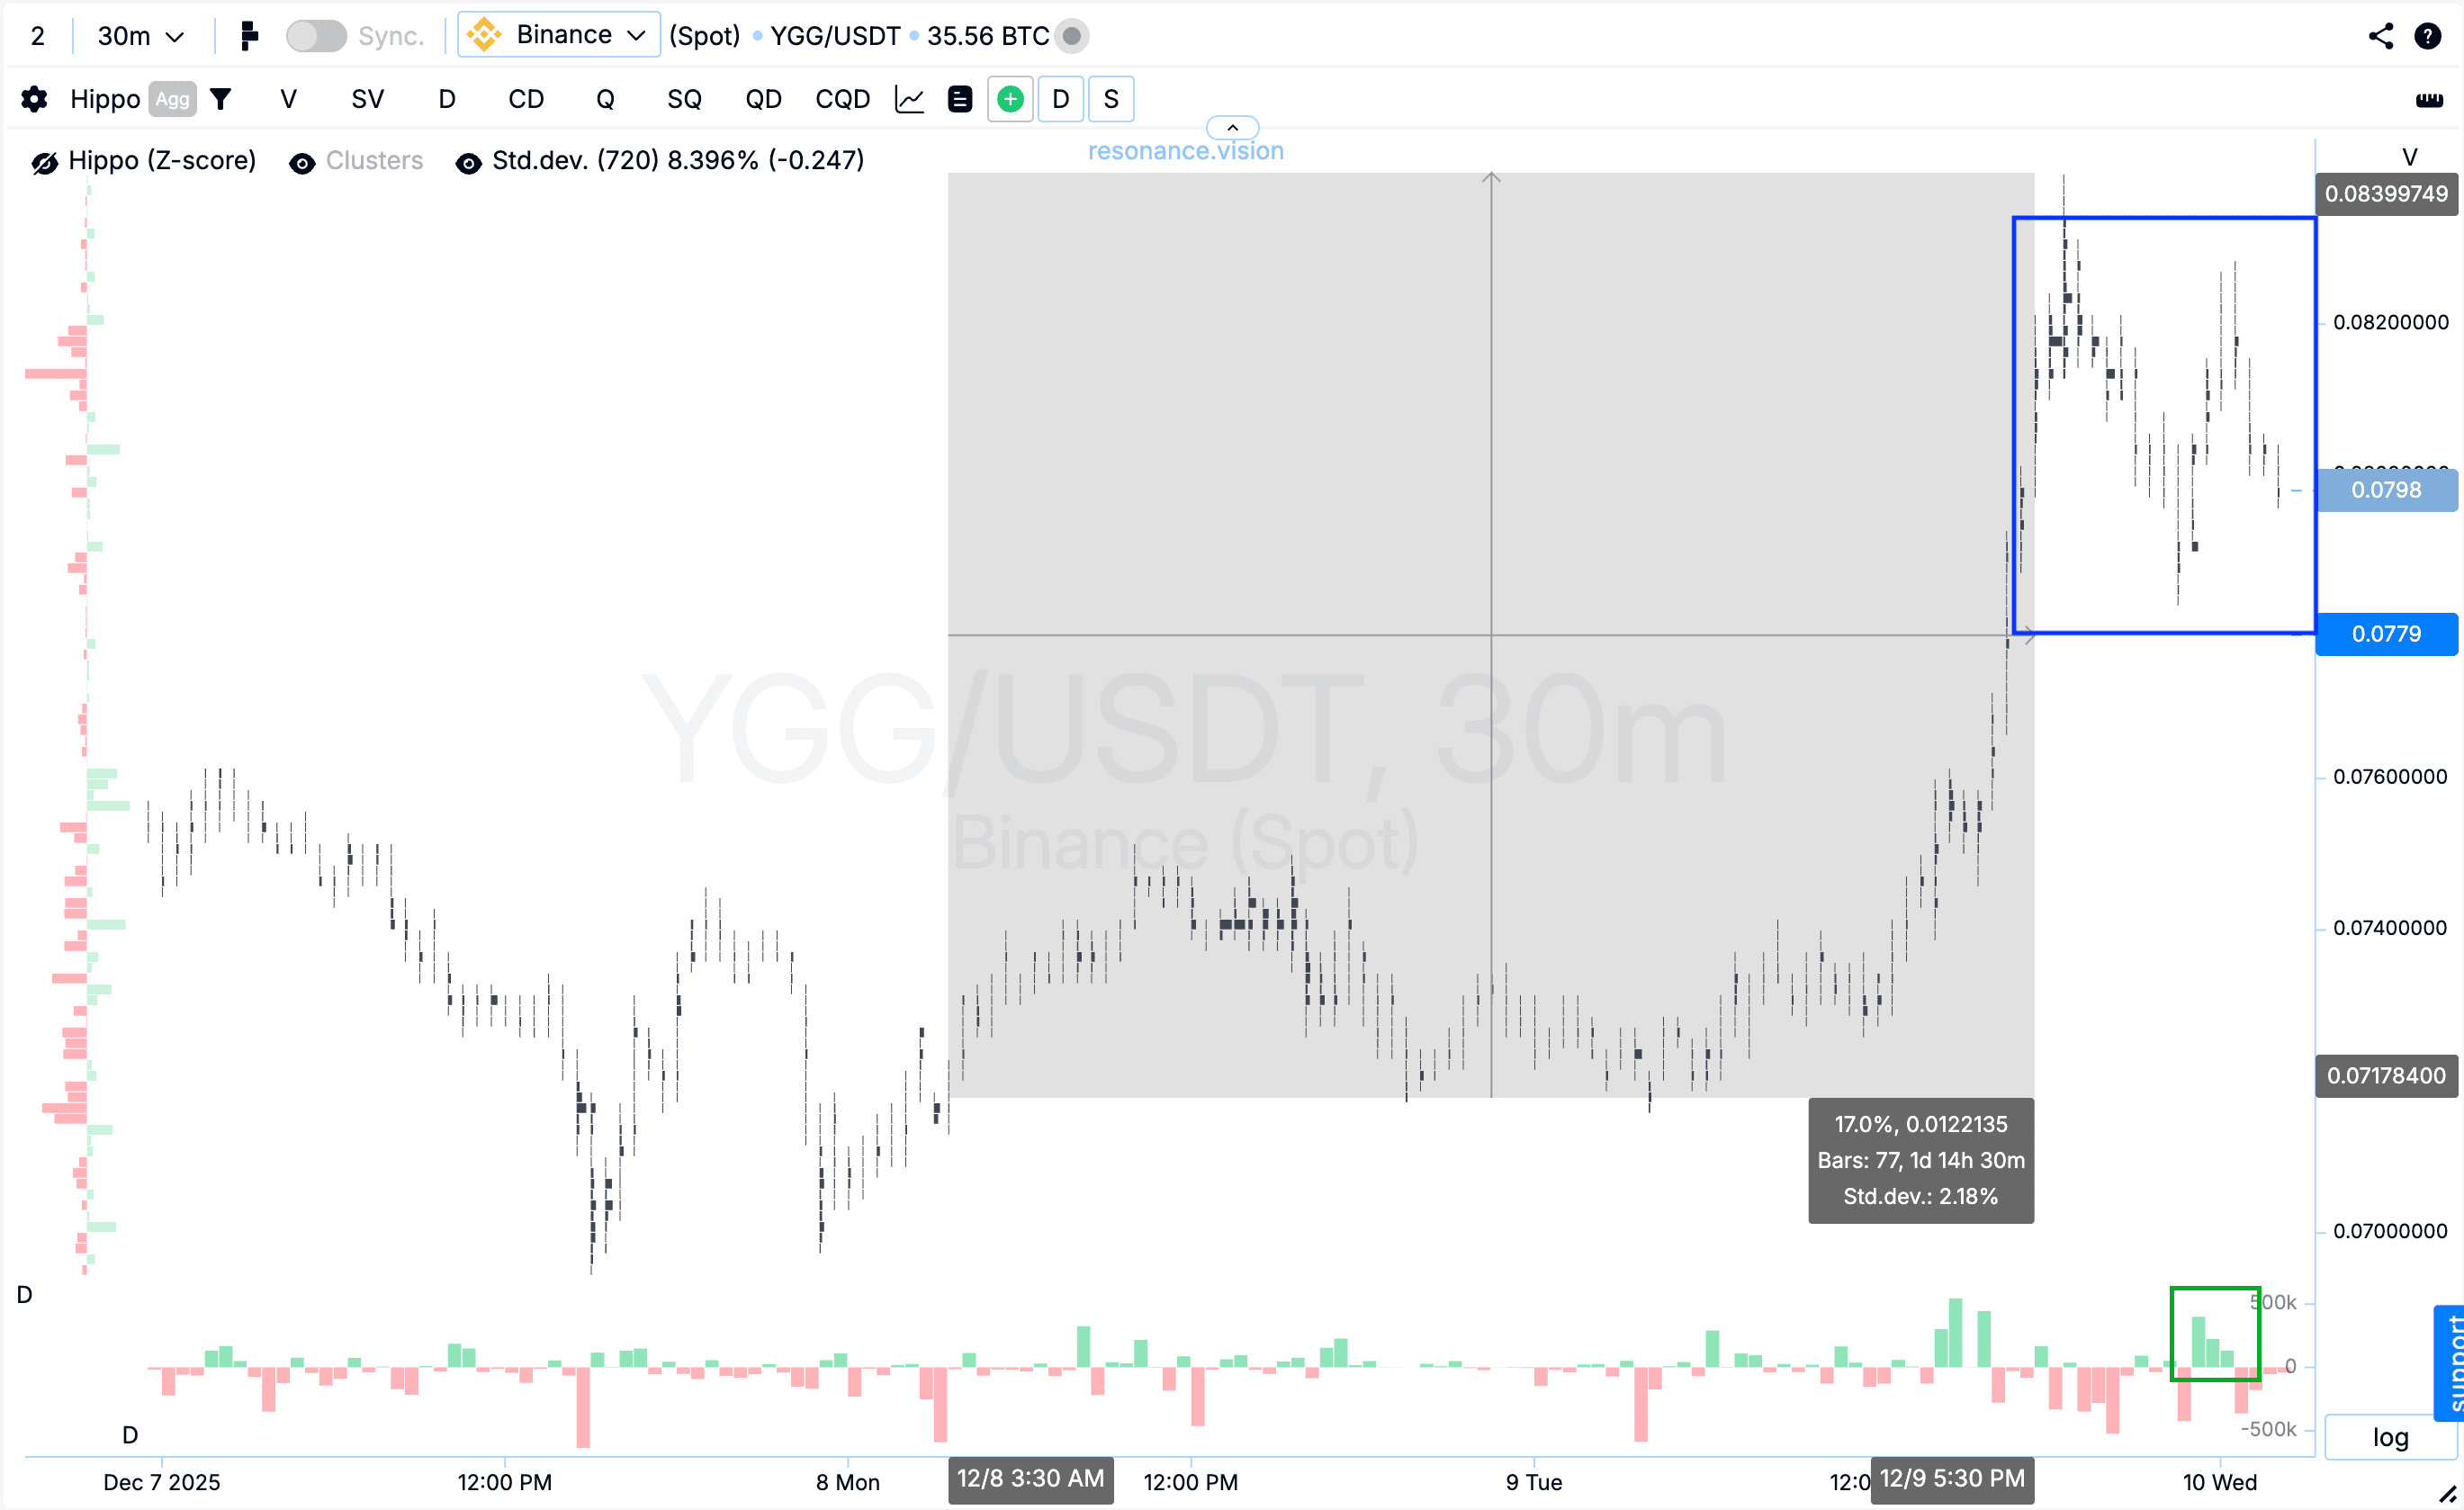
Cluster chart: an M-shaped formation formed at the top (blue rectangle), inside which subsequent buying volumes gradually lost effectiveness — the price stopped reacting with further growth. Additionally, the overall volume began to decrease (green rectangle), while the price shifted smoothly downward.
This structure indicates a local surplus: buyers are no longer able to push the price higher, and the market is transitioning into a phase of weakening demand. Under such conditions, closing the position is the most balanced and rational decision.
Conclusion
In this trade, the key factor was the ability to correctly read volume behavior and assess the effectiveness of market orders. At the entry stage, the market showed clear signs of seller weakness: repeated market sells stopped pushing the price lower, aggregated data confirmed a local deficit, and volume efficiency began shifting in favor of buyers. This created the conditions for a careful long entry.
The result — a precise, consistent trade built on the combination of cluster analysis, aggregated data, and volume efficiency assessment.
Follow new insights in our telegram channel.
No need to invent complex schemes and look for the "grail". Use the Resonance platform tools.
Register via the link — get a bonus and start earning:
OKX | BingX | KuCoin.
Promo code TOPBLOG gives you a 10% discount on any Resonance tariff plan.
Recommended articles


