ZEN +216,31% (Напрямкова стратегія Resonance)

Розбір угоди з ZEN/USDT: як розпізнати зниження ефективності покупців та вчасно зафіксувати прибуток.
У статті розбираємо момент, коли потужні ринкові покупки перестають штовхати ціну вгору, а лімітна підтримка, що посилюється, дає сигнал про зміну пріоритету на ринку.
Цей кейс наочно показує, чому недостатньо дивитися лише на ціну — треба враховувати кластери, дельти та лімітні заявки.
Підсумок угоди: +216,31% прибутку при грамотній фіксації на тлі змінного попиту та пропозиції.
Зміст

Монета: ZEN/USDT
Ризик: низький
Рівень розуміння: новачок
Причини входу
Кластерний графік: Під час повторного імпульсного руху вгору сформувалися кластери за об’ємом (синій прямокутник). Рух супроводжувався значно більшими покупками порівняно з попереднім імпульсом – це підтверджує дельта (зелений прямокутник зі стрілкою). Однак, незважаючи на зростання об’ємів, оновити попередній максимум не вдалося. Така реакція може свідчити про зниження купівельної ефективності та невдалу спробу перехоплення ініціативи.
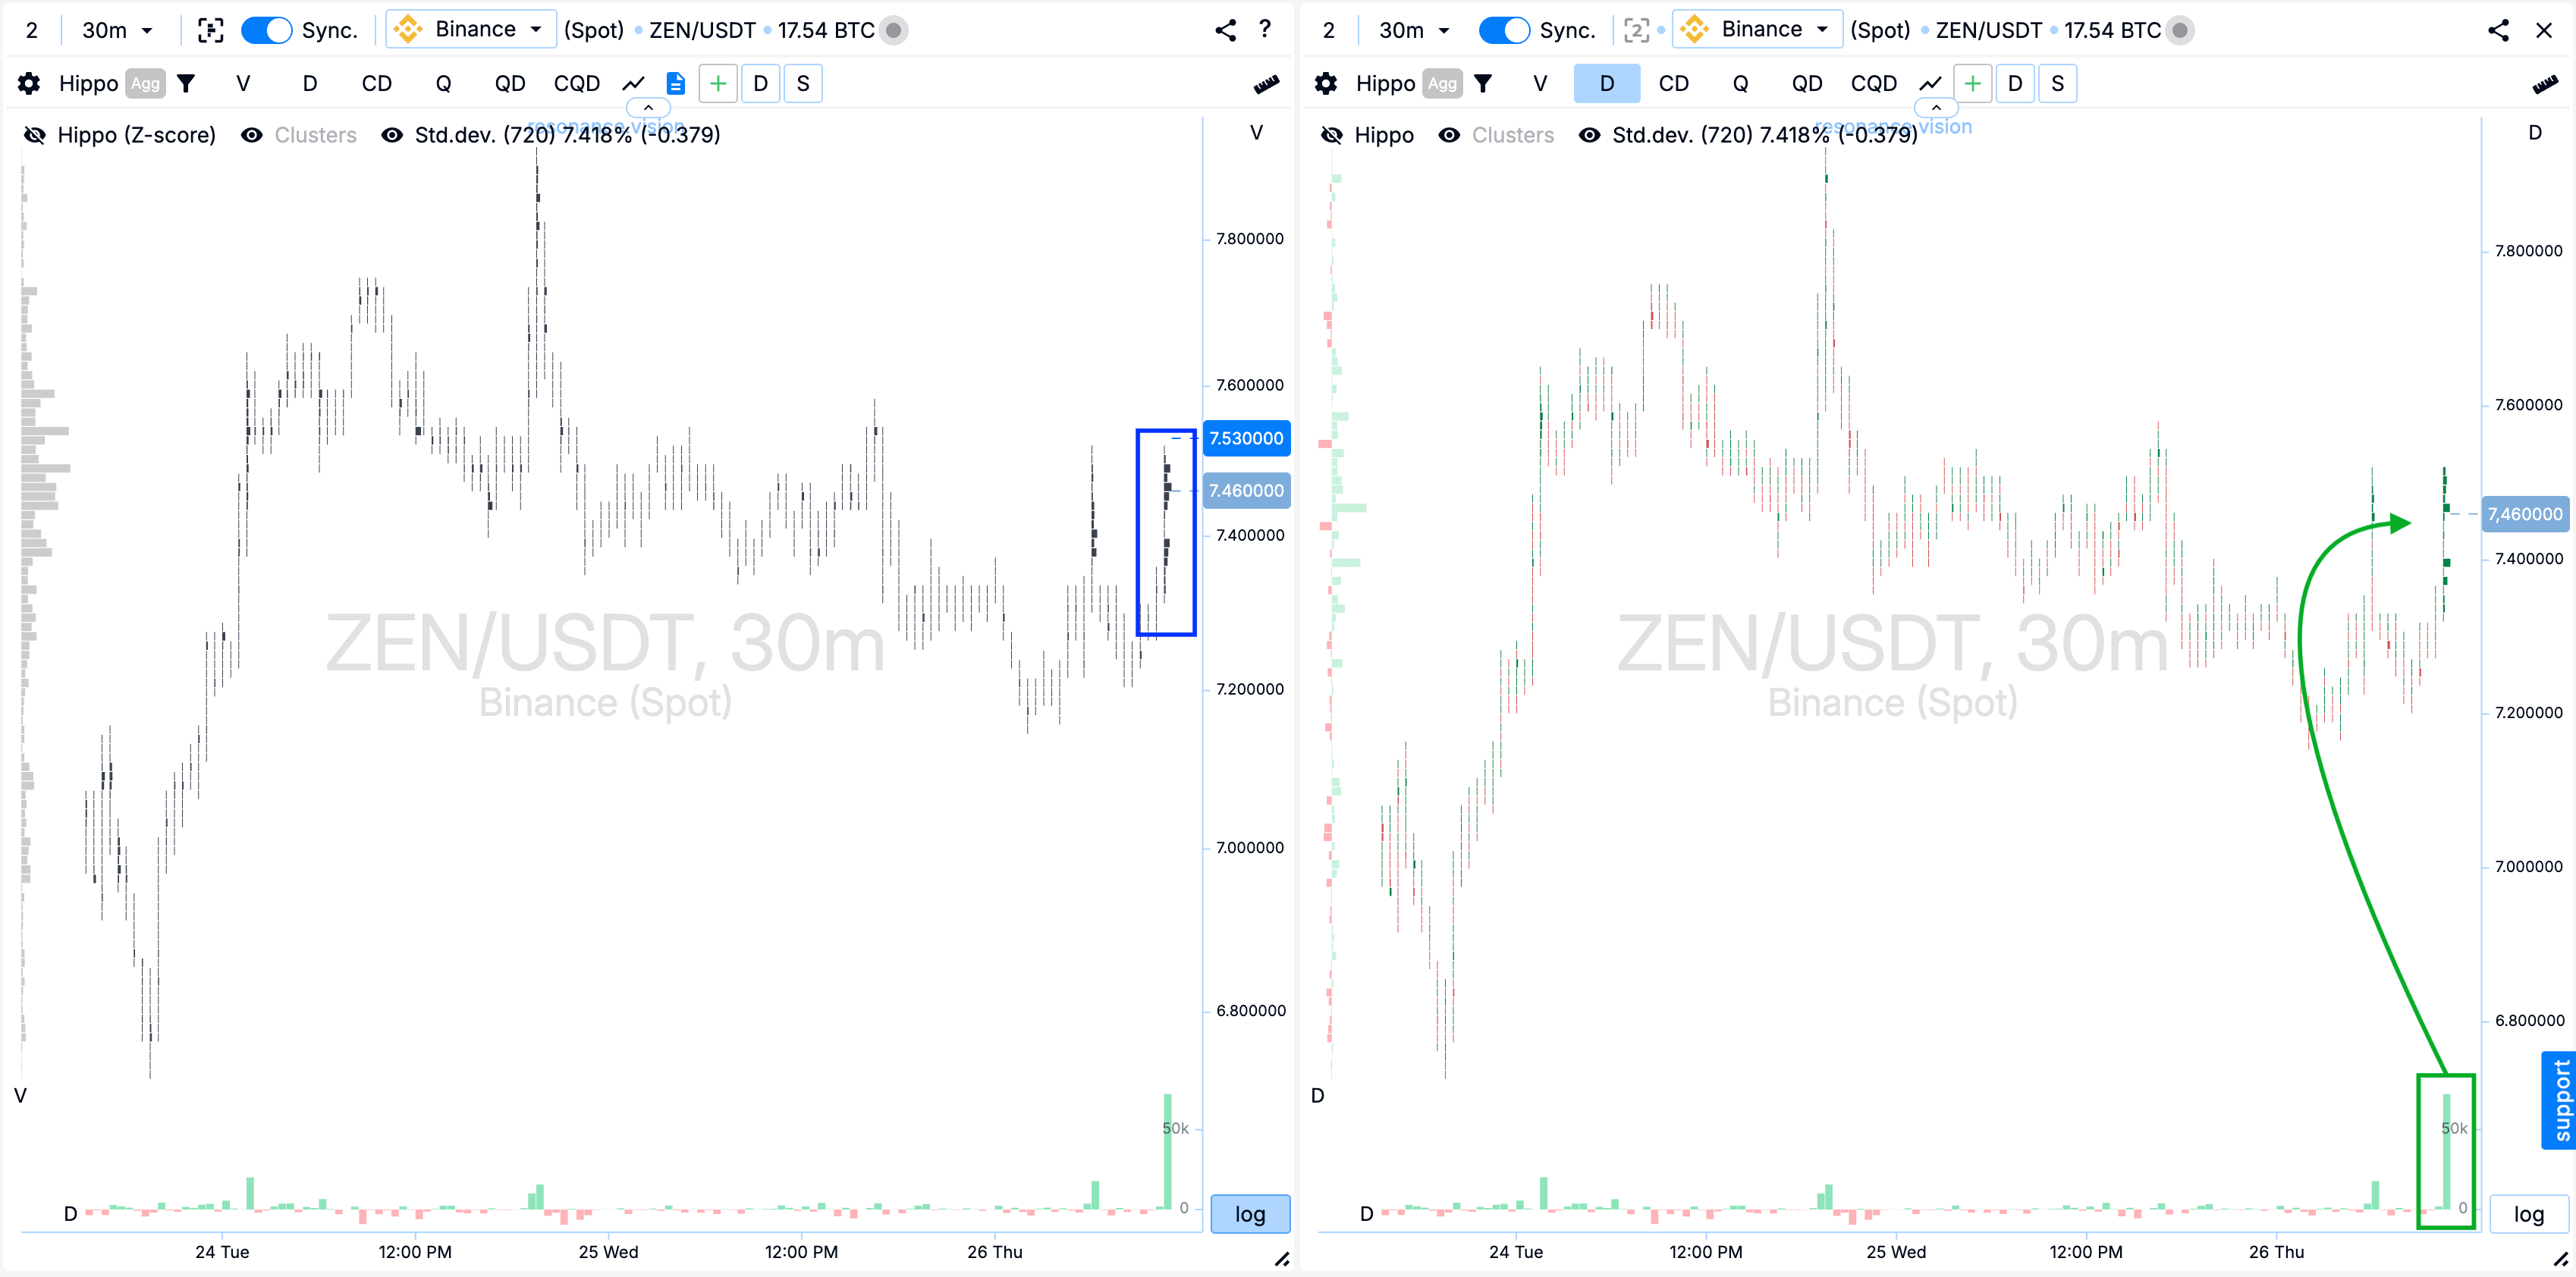
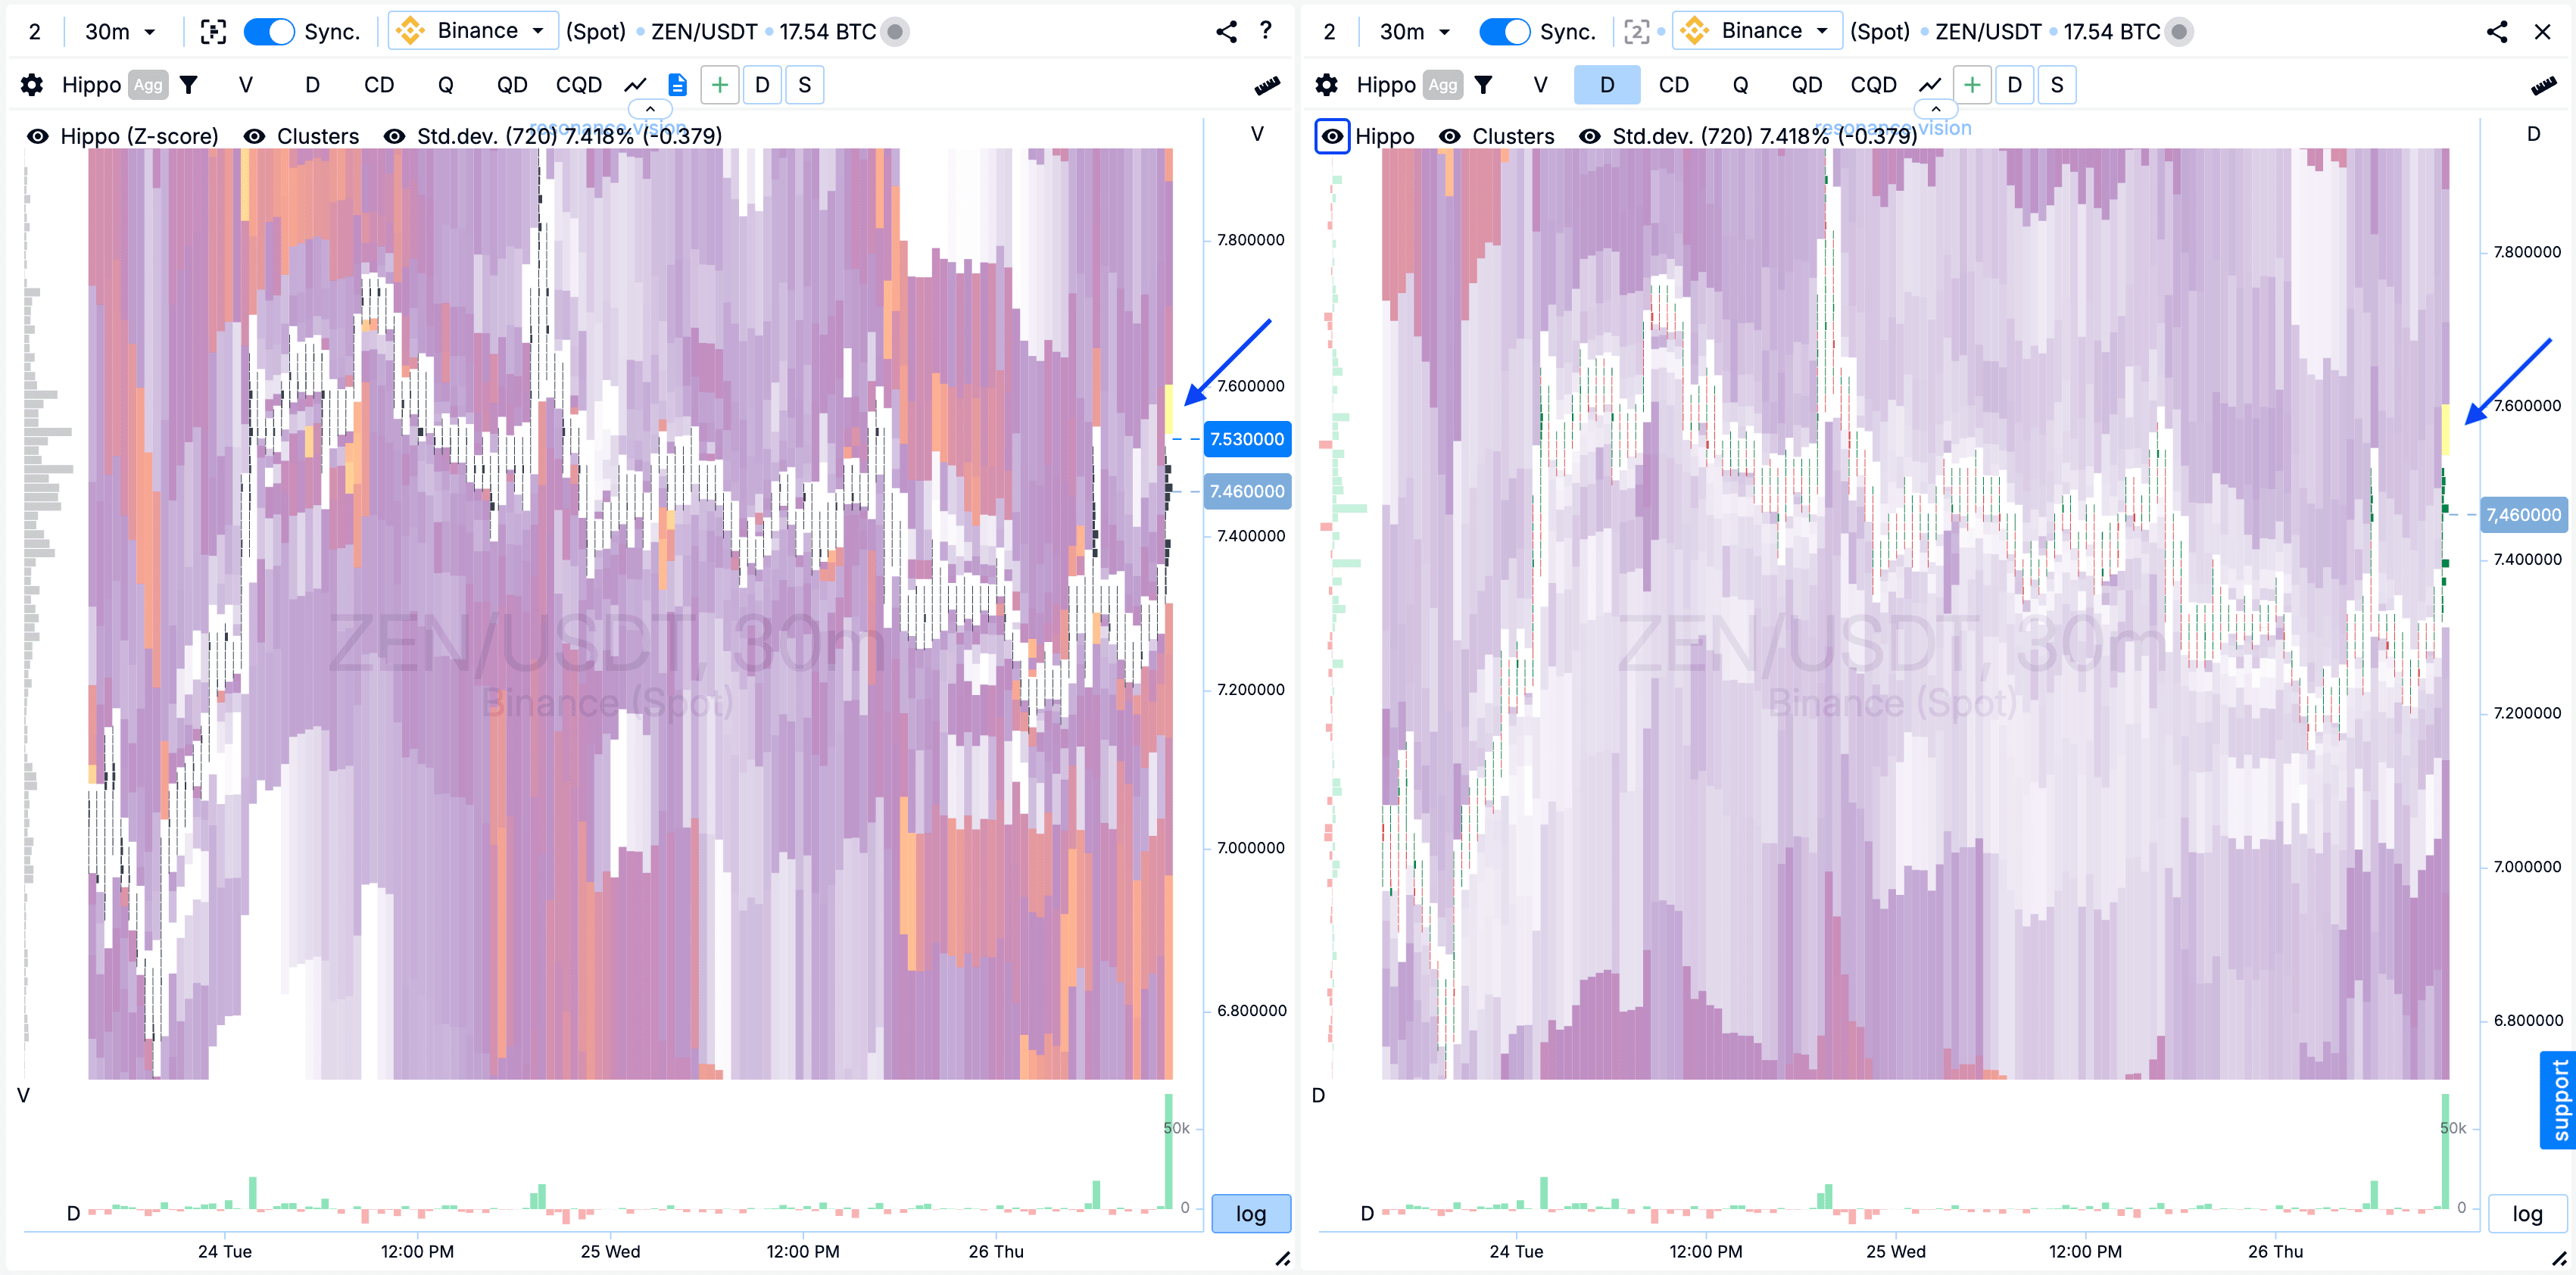
Теплова карта в режимі Z-Score та за об’ємом: Також зазначив, що вище за поточну ціну розташоване яскраво виражене лімітне скупчення (сині стрілки), в яке вперлися покупки. Це накопичення виступає локальним опором подальшого зростання ціни.
У Дешборді
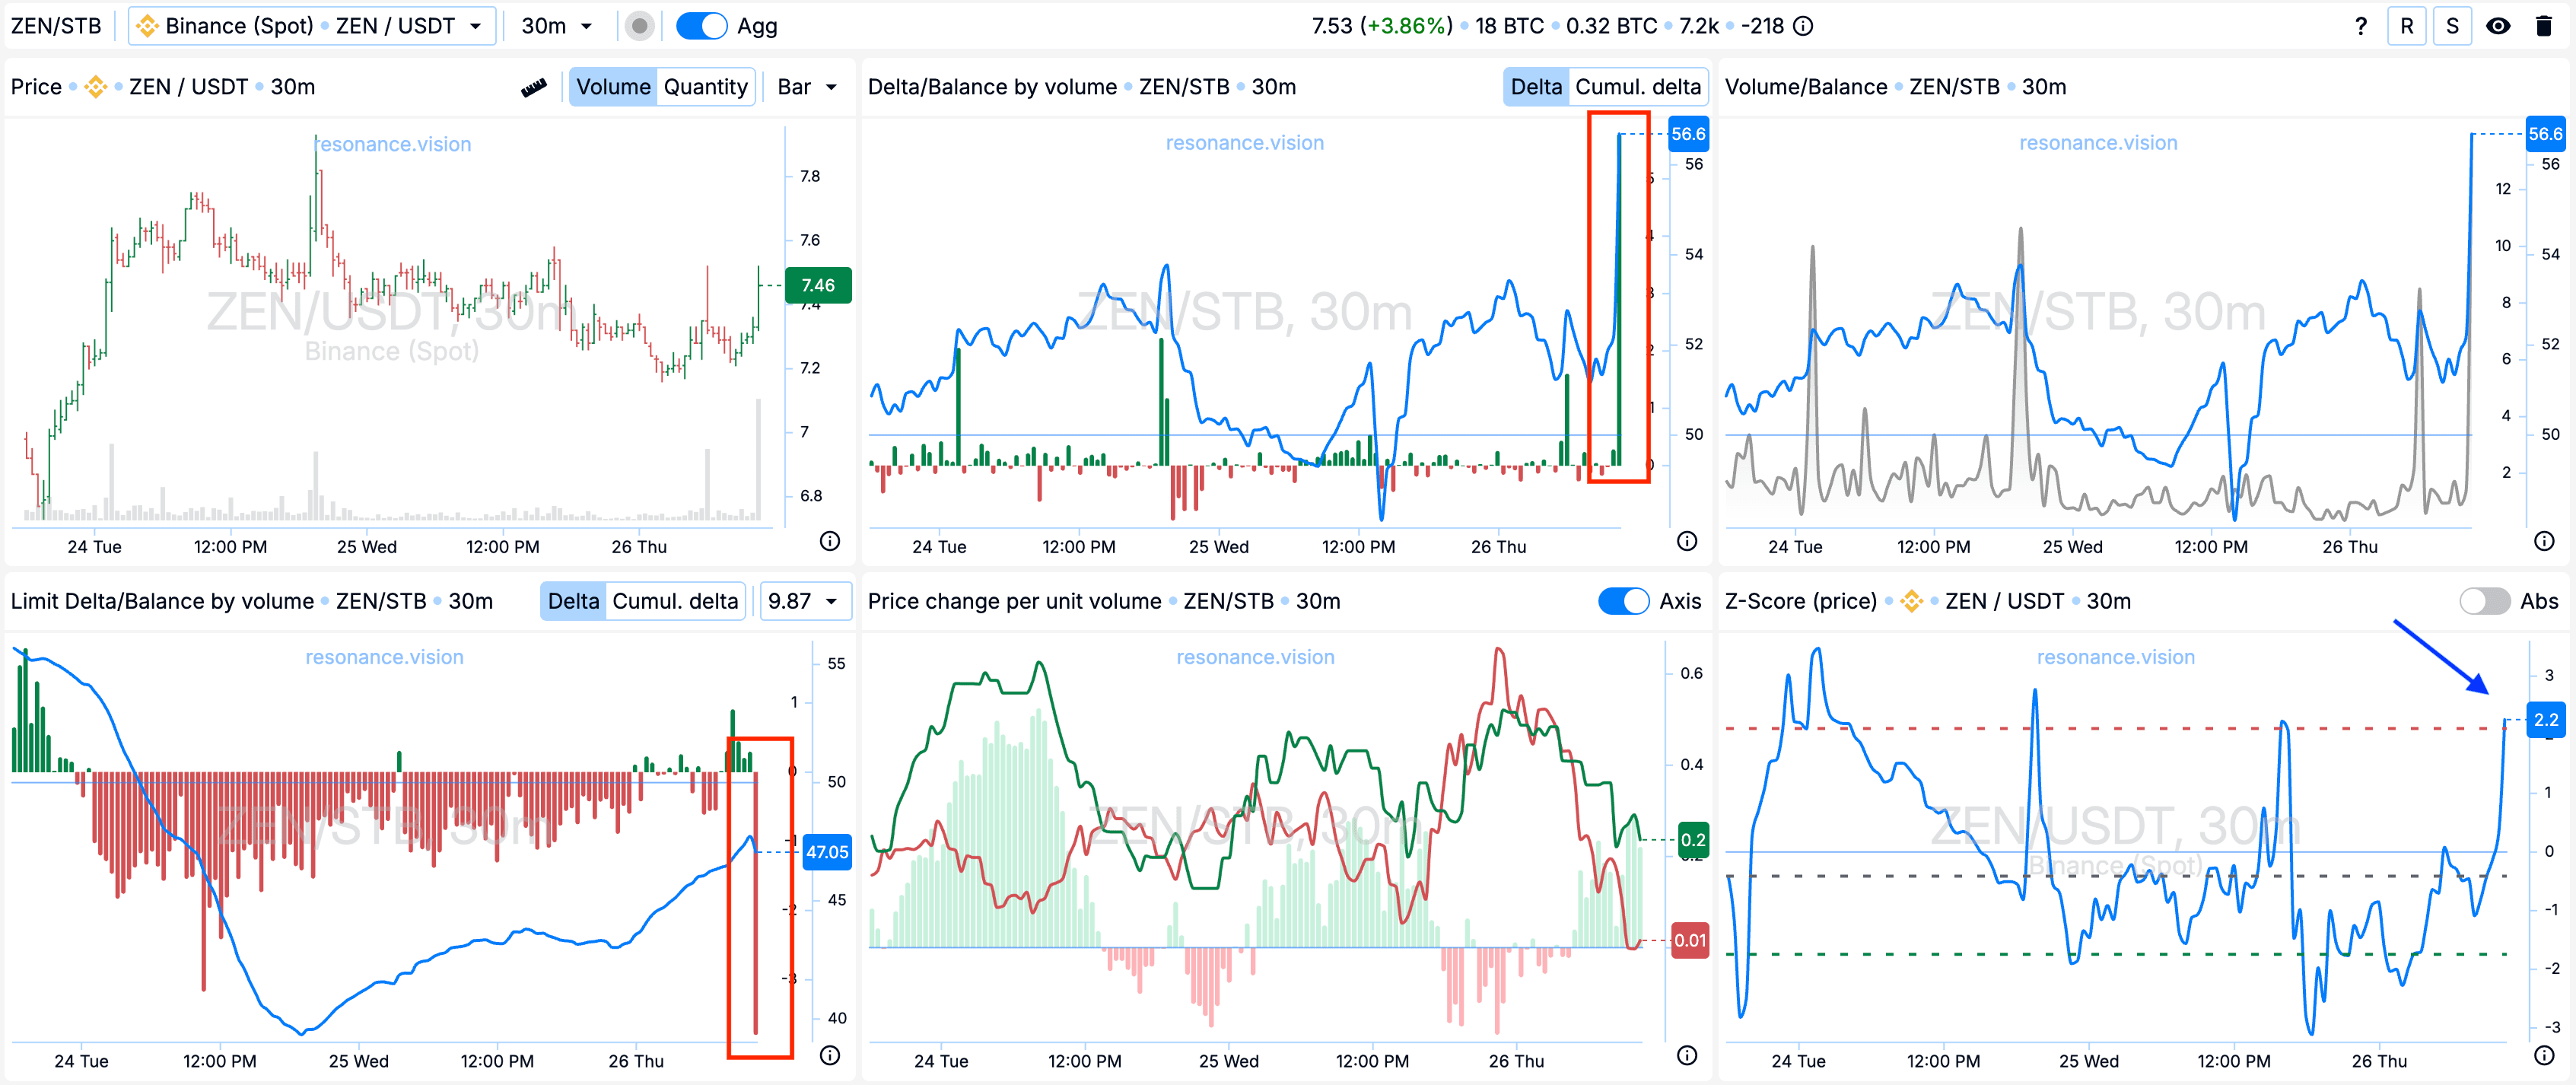
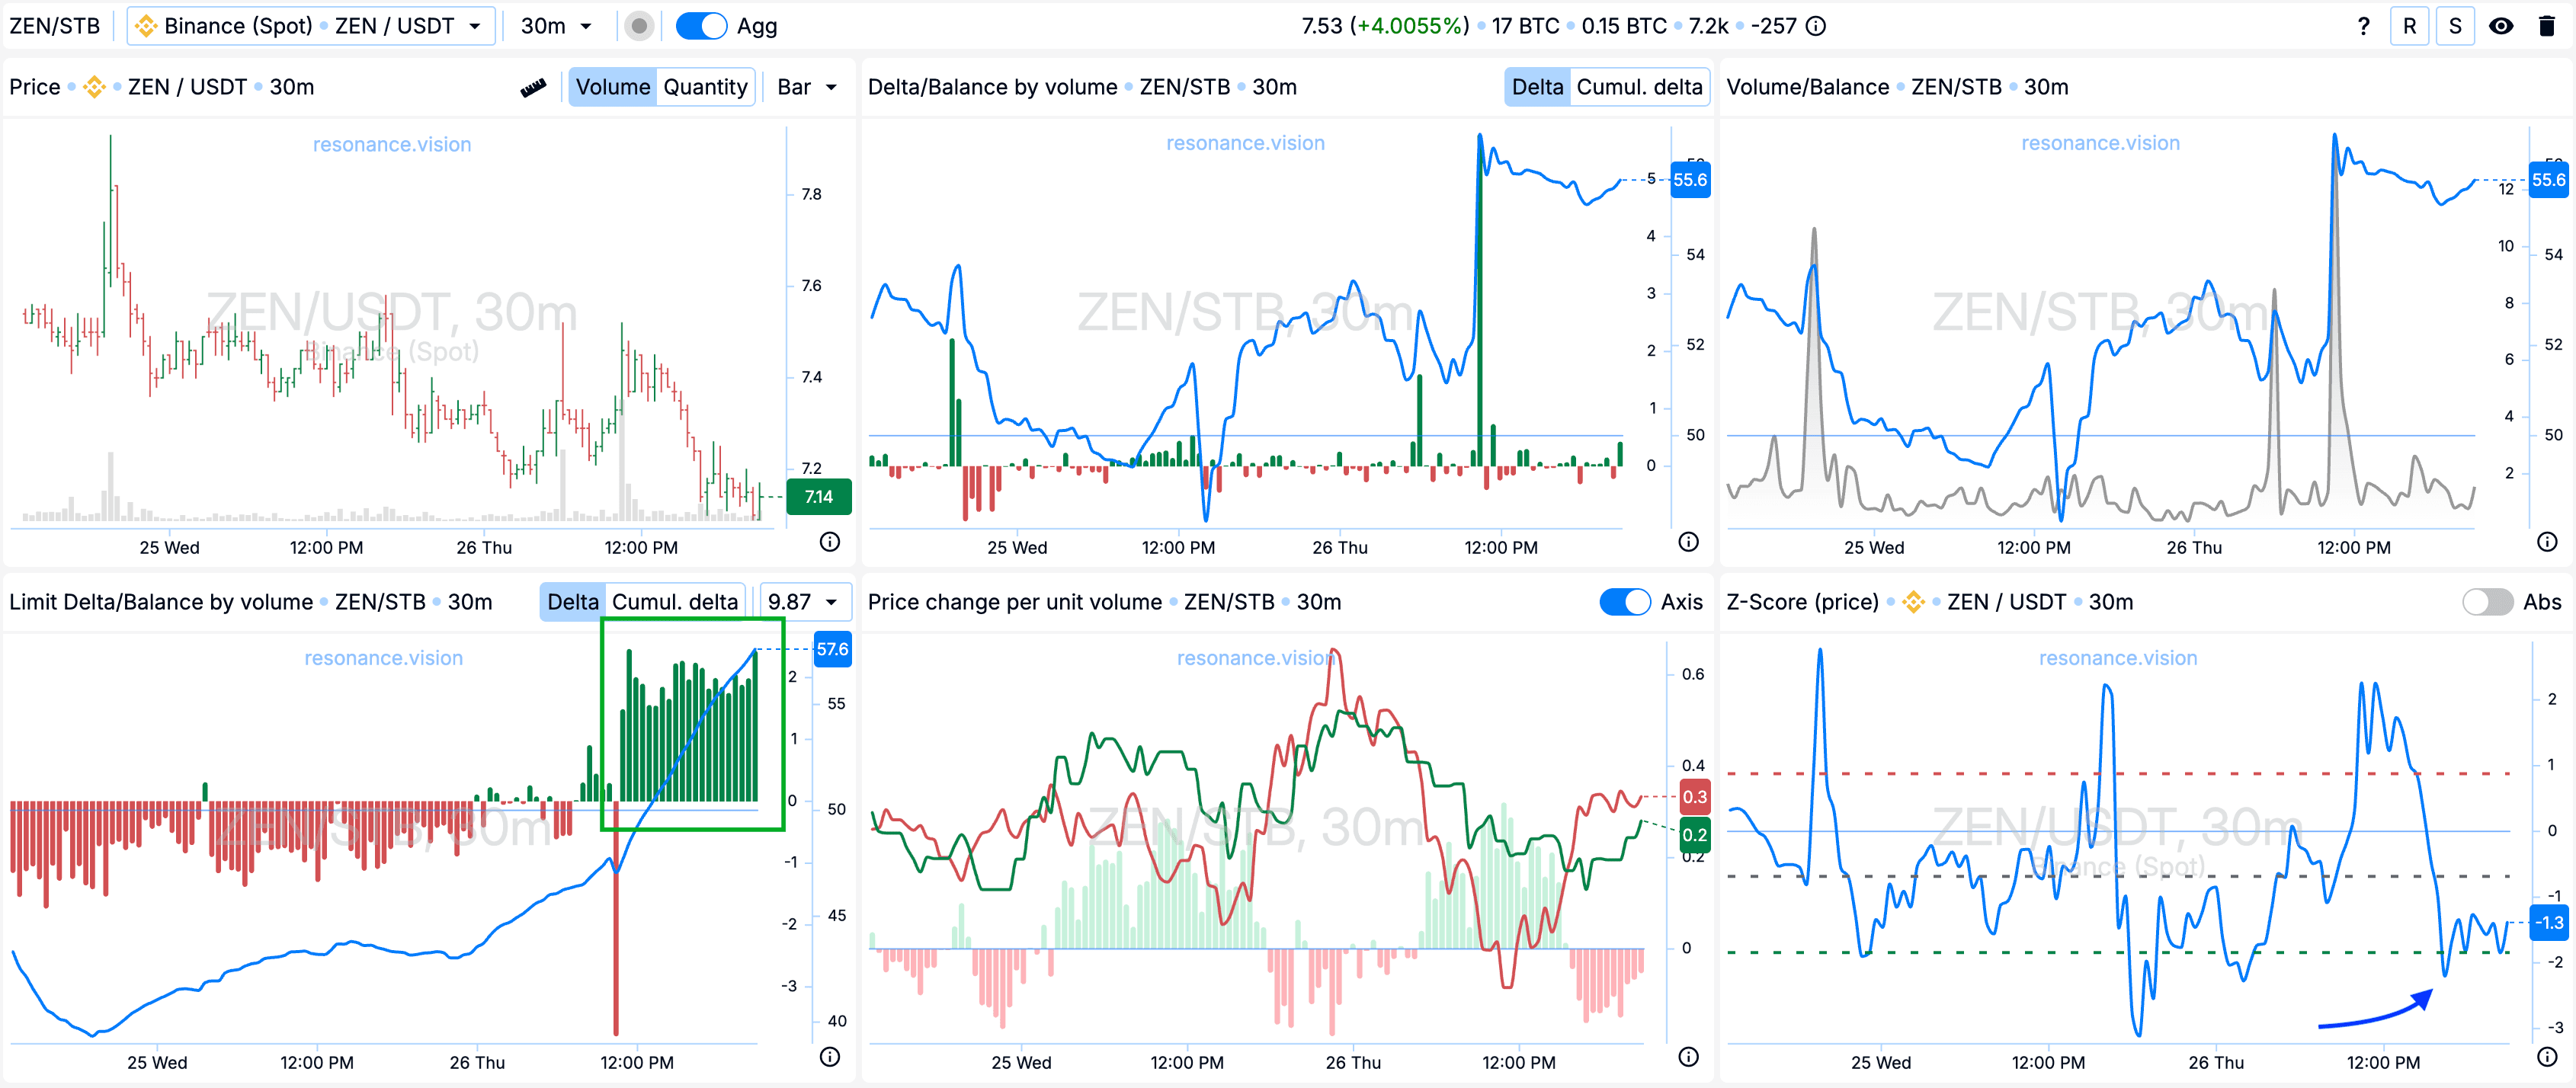
Дельта/Баланс за об’ємом та лімітна дельта: Згідно з агрегованими кумулятивними даними, значно переважають ринкові покупки (червоний прямокутник). Однак за лімітними заявками спостерігається активна підстановка ордерів на продаж - це видно за негативною динамікою на гістограмі кумулятивної дельти (червоний прямокутник).
Z-Score (ціна): Ціну відхилили вгору до значень 2,2 стандартних відхилення (синя стрілка), а також знаходилася у аномальних значень за персентилем. Значення аномальне, що потенційно додає аргументу для шорт позиції.
Причини виходу
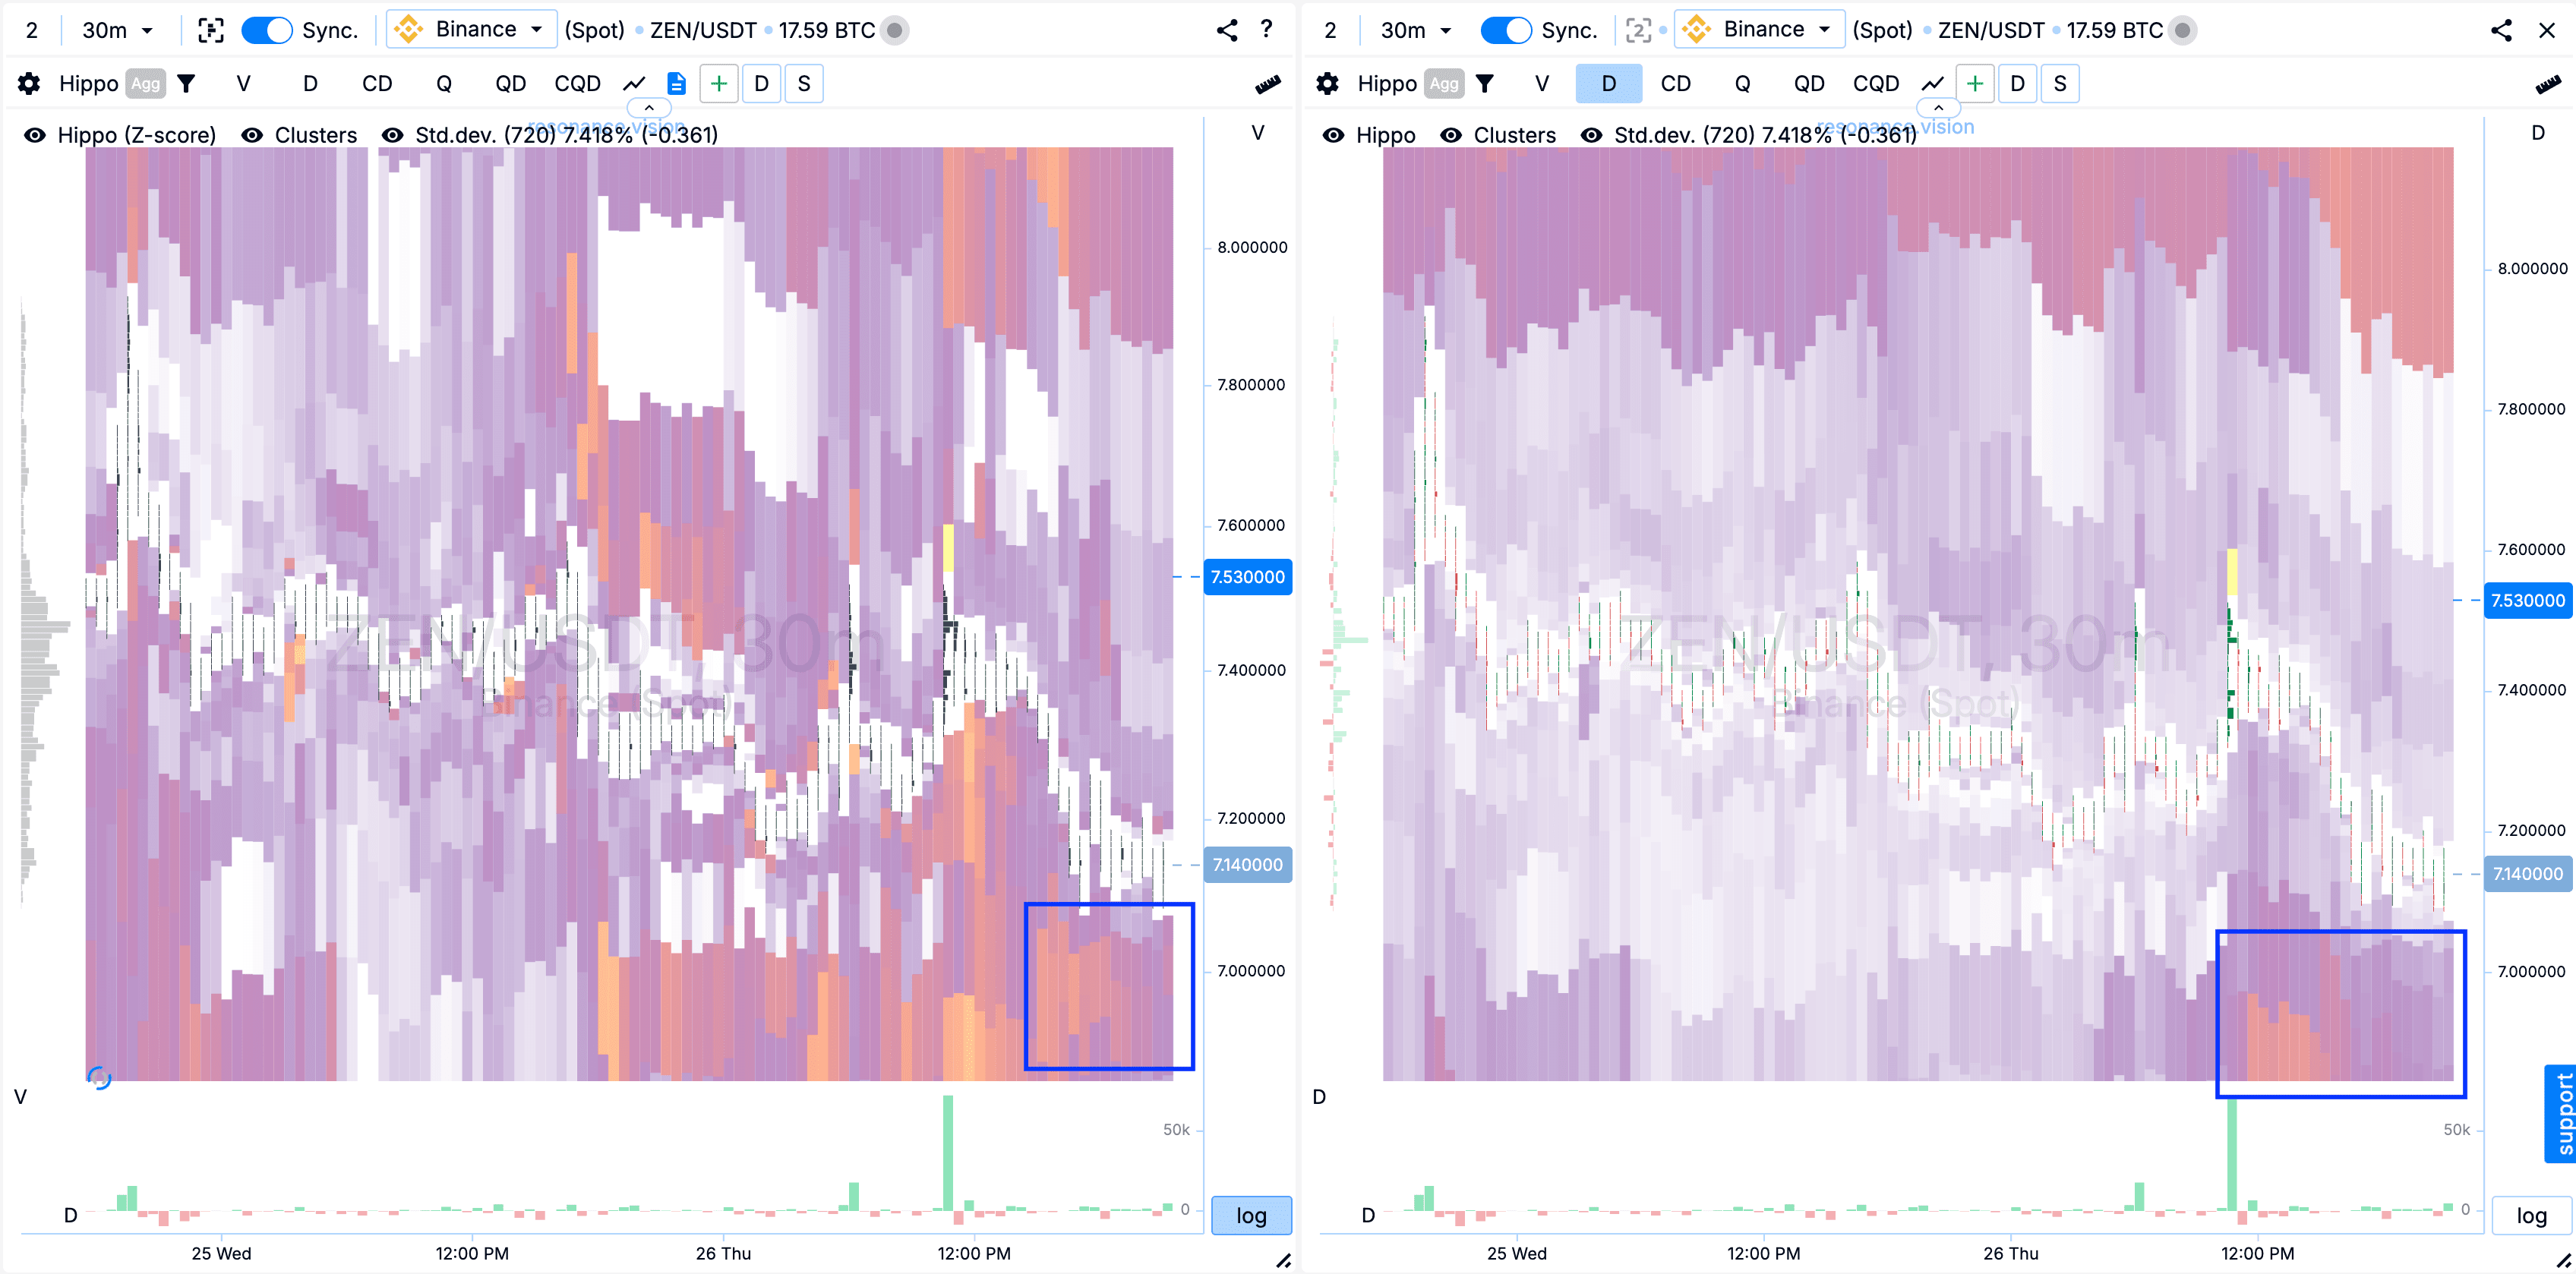
Теплова карта в режимі Z-Score та за об’ємом: Під ціною почали виявлятися виражені лімітні скупчення (сині прямокутники), що може вказувати на наявність локальної підтримки та ймовірність утримання ціни або її розвороту вгору. При цьому зверху лімітні щільності залишаються слабко вираженими, що говорить про відсутність серйозного опору з боку продавців.
У Дешборді
Ліміт Дельта/Баланс за об’ємом: За лімітними заявками видно, що почали підставлятися більше заявки на купівлю і баланс продовжує зростати (зелений прямокутник). Що додатково підтверджує локальну лімітну підтримку покупцями у ціновому діапазоні.
Z-Score (ціна): Також тепер ціну відхилили вниз де на піку значення було нижче 2 відхилень (синя стрілка).
Підсумок
Вдалося зафіксувати прибуток у розмірі 216,31%.

Висновок
Незважаючи на зростання маркет-покупок та значні об’єми, ціна не змогла оновити попередній максимум — сигнал про зниження ефективності попиту та можливе формування профіциту. Додатковим аргументом виступили дані теплової карти та дельта, де покупці натрапили на лімітний опір, який стримував подальший рух нагору.
На виході ринкова ситуація змінилася: за агрегованими даними посилилася лімітна підтримка, а ціна почала стабілізуватися. Така поведінка учасників вказувала на можливий розворот, що стало сигналом фіксації позиції. Своєчасне закриття угоди дозволило зафіксувати прибуток та уникнути непотрібних ризиків.
Стеж за новими статтями у нашому телеграм каналі.
Не треба вигадувати складних схем та шукати “грааль”. Використовуйте інструменти платформи Resonance.
Реєструйся за посиланням - отримуй бонус і починай заробляти:
OKX | BingX | KuCoin.
Промокод TOPBLOG дає тобі 10% знижки на будь-який тарифний план Resonance.
Рекомендовані статті


