Огляд ринку з ALT - 02.01.2026

В огляді зафіксовано збалансований стан маркет-ордерів при стійкому переважанні лімітних покупок. Ціна відхилена на аномальне значення, волатильність залишається низькою, а аномальні скупчення ліквідності по обидва боки ціни утримують ринок у бічному діапазоні.
Зміст

У даному огляді ринку ми не намагаємося прогнозувати майбутнє, наше завдання констатувати факти, які ми маємо на поточний момент. І будувати свої дії на основі поточних фактів, а не наших очікувань та надій.
Ринкові ордери (зелений прямокутник)
В агрегованому вигляді за маркет-ордерами спостерігається збалансований стан - вираженого усунення у бік покупок чи продажів не фіксується.
Лімітні заявки (червона стрілка)
За лімітними ордерами тривалий час зберігається переважання заявок на покупку. В даний момент ці об’єми формують підтримку та утримують ціну в діапазоні.
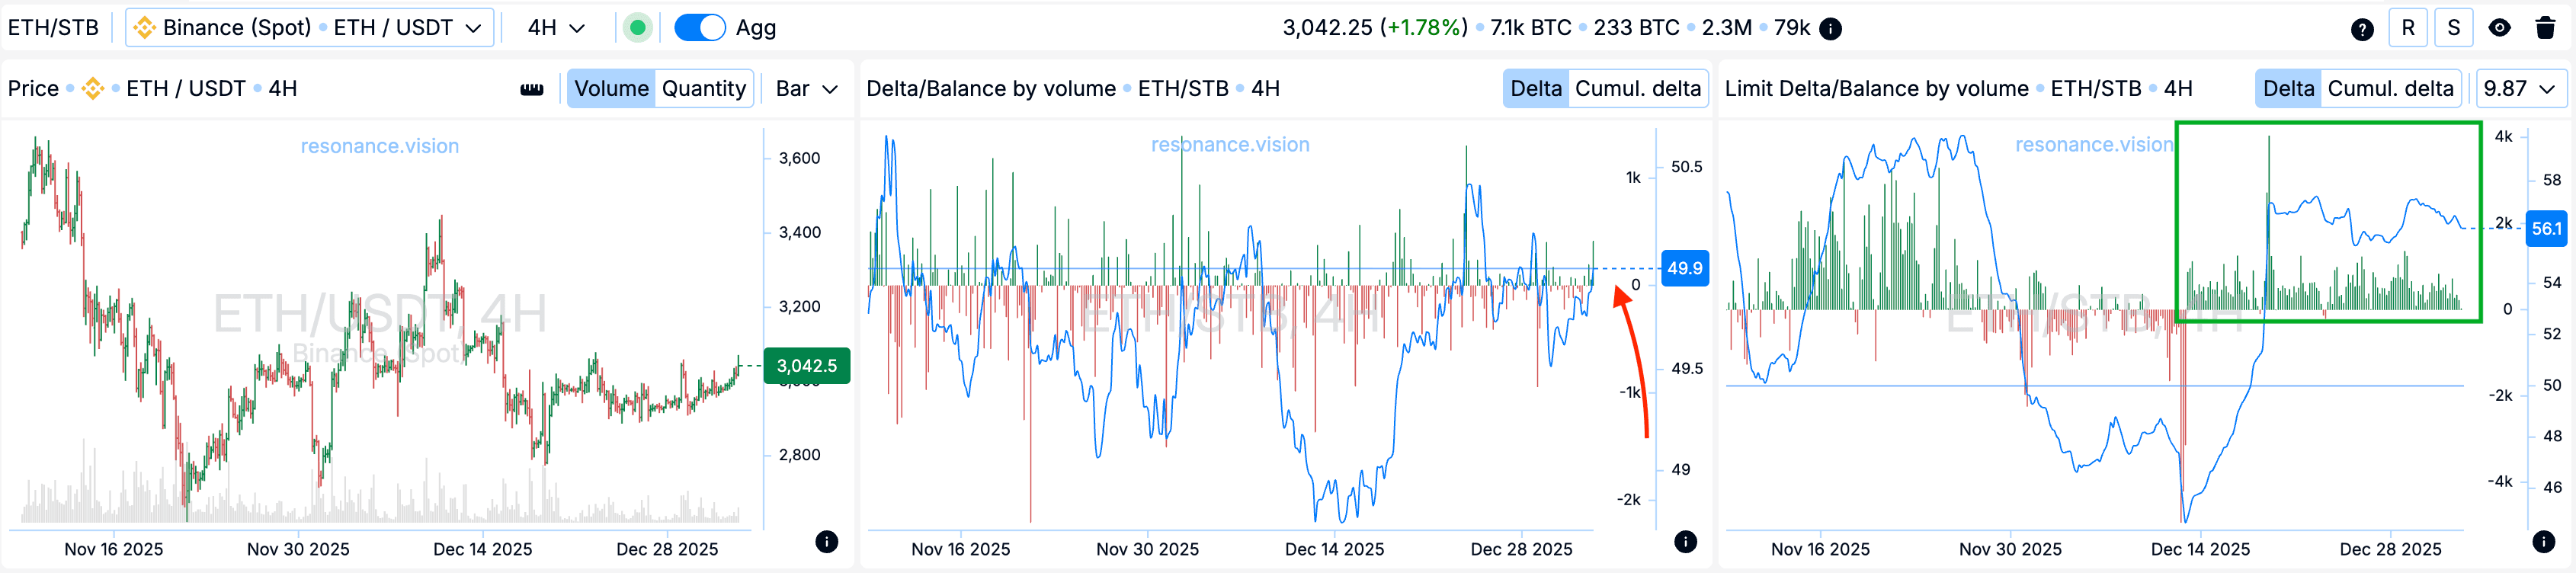
Змін. ціни на одиницю об’єму (чорний прямокутник)
Ефективність витраченого об’єму продовжує зміщуватися на користь маркет-покупок - купівельні ордери надають сильніший вплив ціну.
Z-Score (ціна) - синя стрілка
На даний момент маркет-покупки відхилили ціну вгору більш ніж на два стандартні відхилення, що є статистично аномальним значенням.

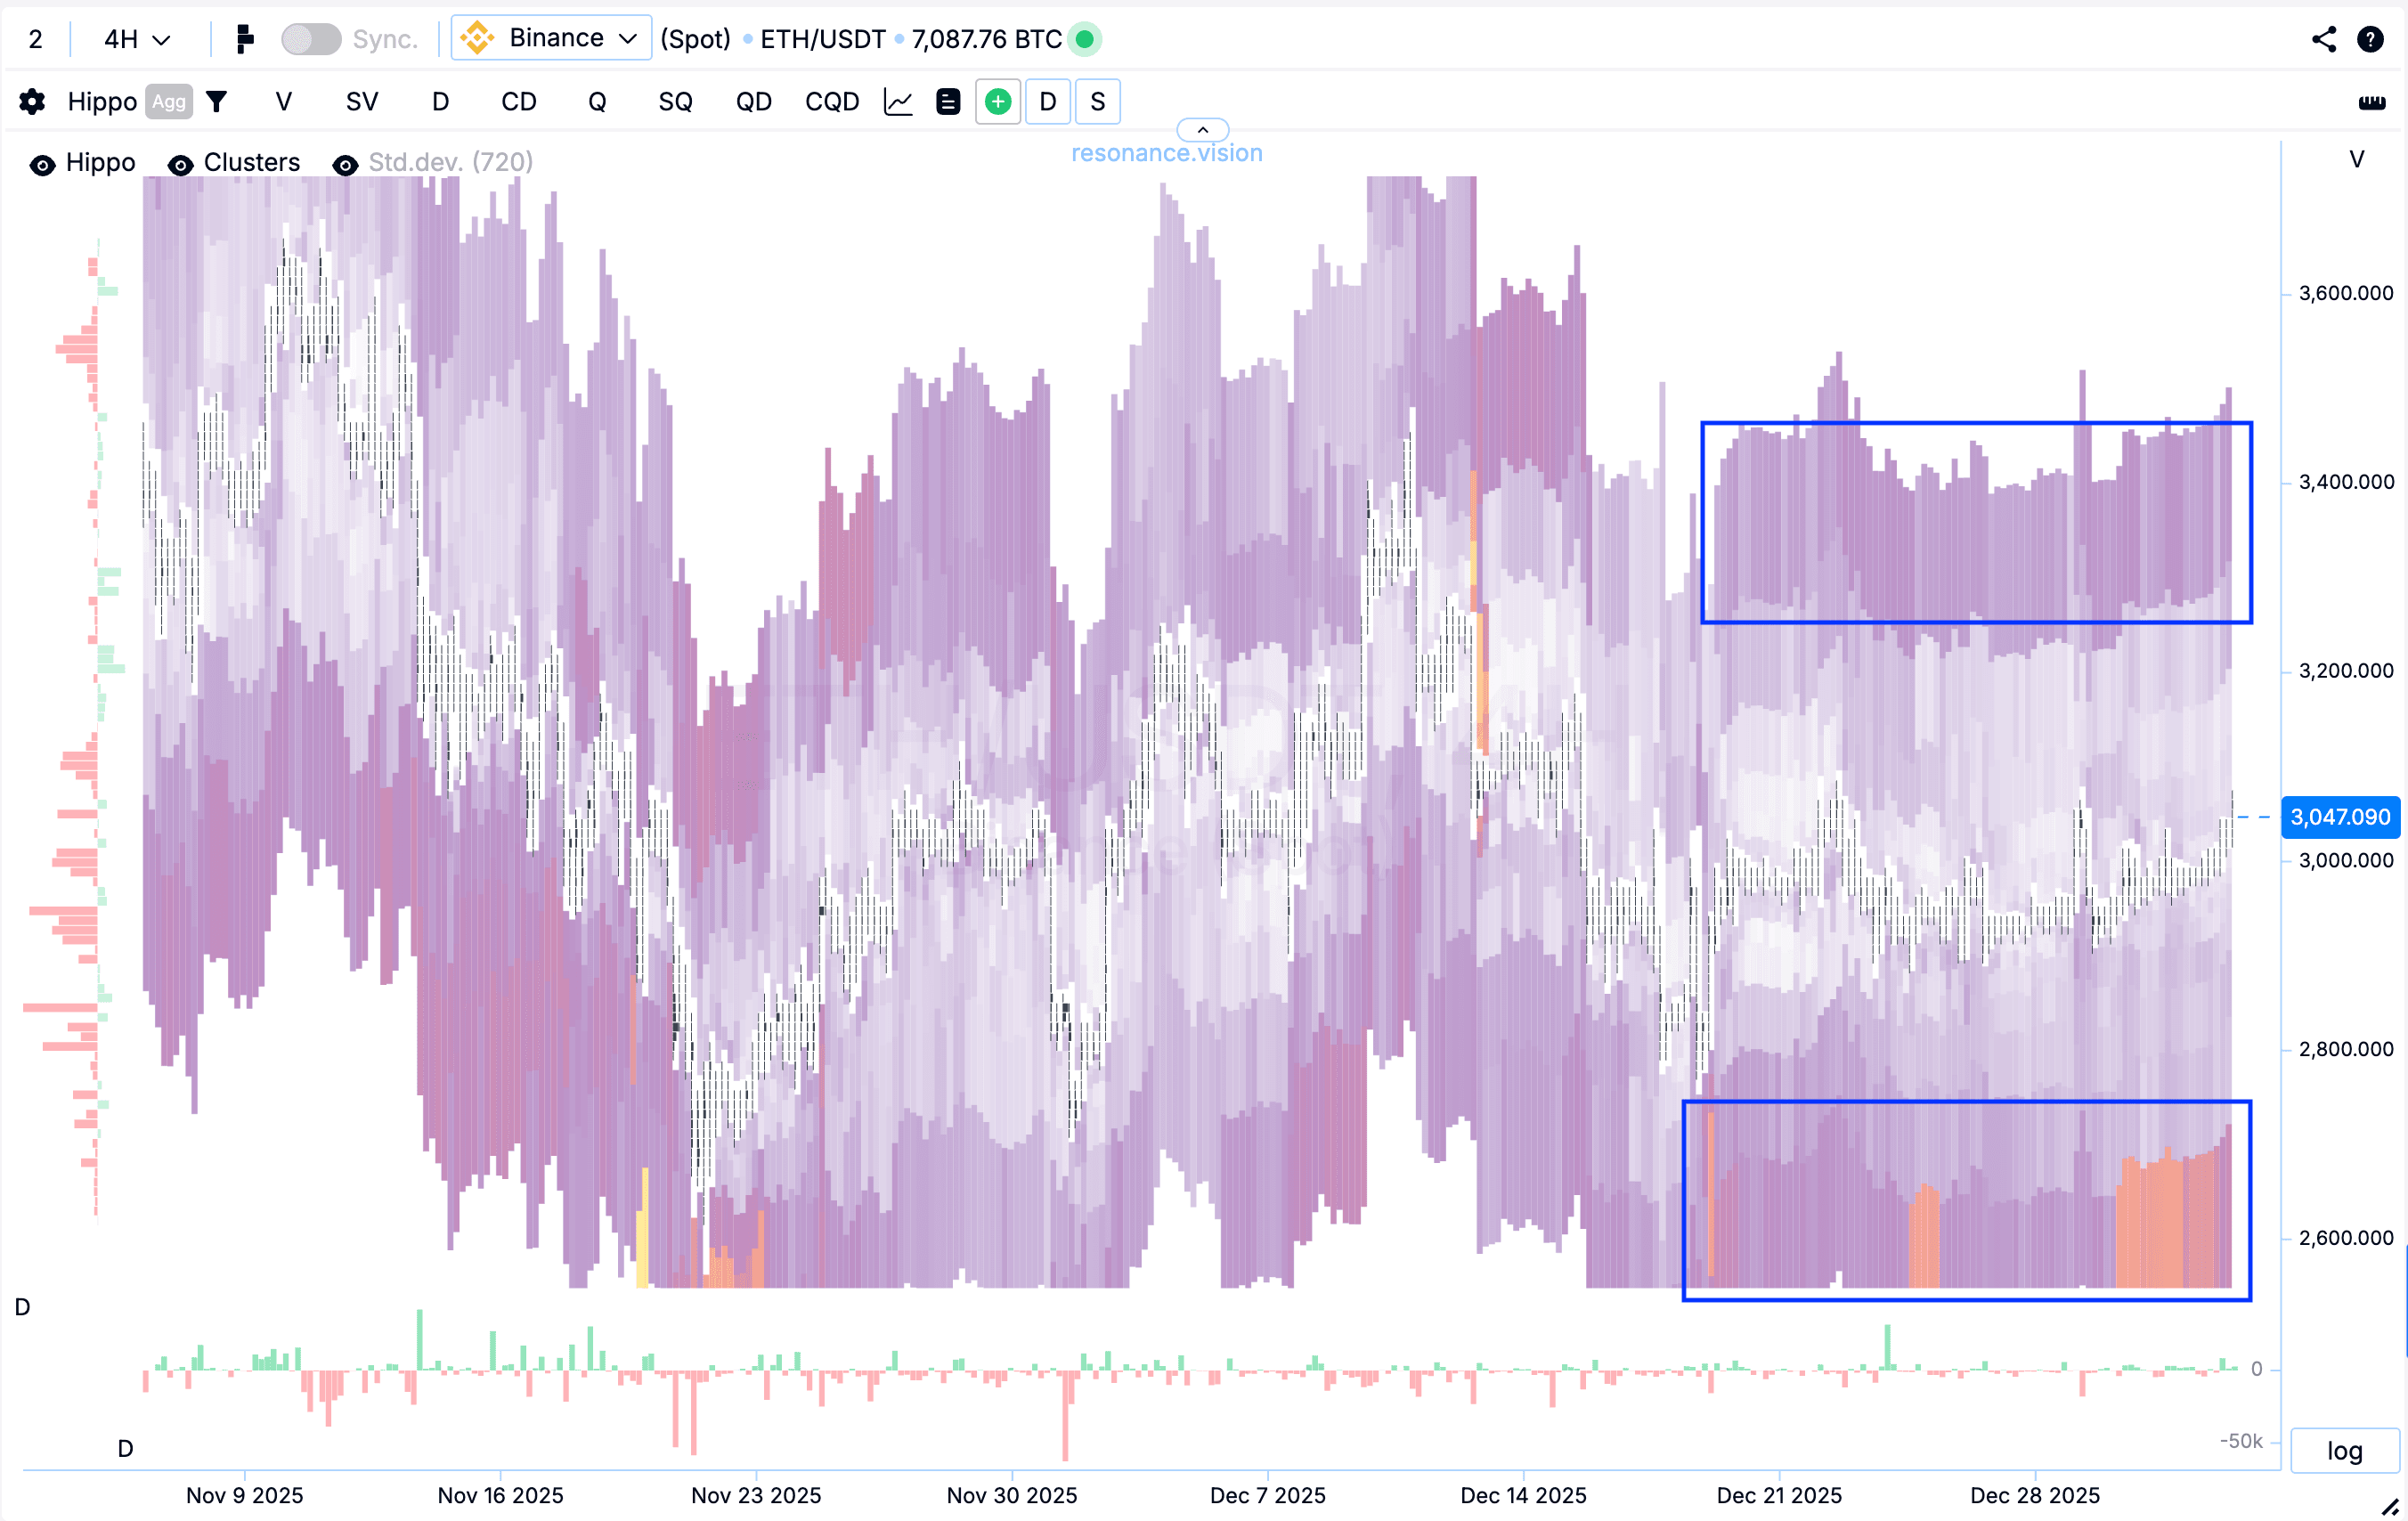
Теплова карта в режимі об’єму (синій прямокутник)
На тепловій карті в режимі об’єму фіксуються аномальні скупчення лімітних ордерів як нижче поточної ціни, так і вище за неї - на відстані близько 15%, що вказує на концентрацію ліквідності всередині діапазону. При цьому обсяги нижче за ціну виражені значно сильніше, ніж зверху, що виразно видно на тепловій карті.
Індекс балансу
Індекс балансу, як і раніше, знаходиться в середній зоні по перцентилю, без вираженого домінування покупців або продавців.

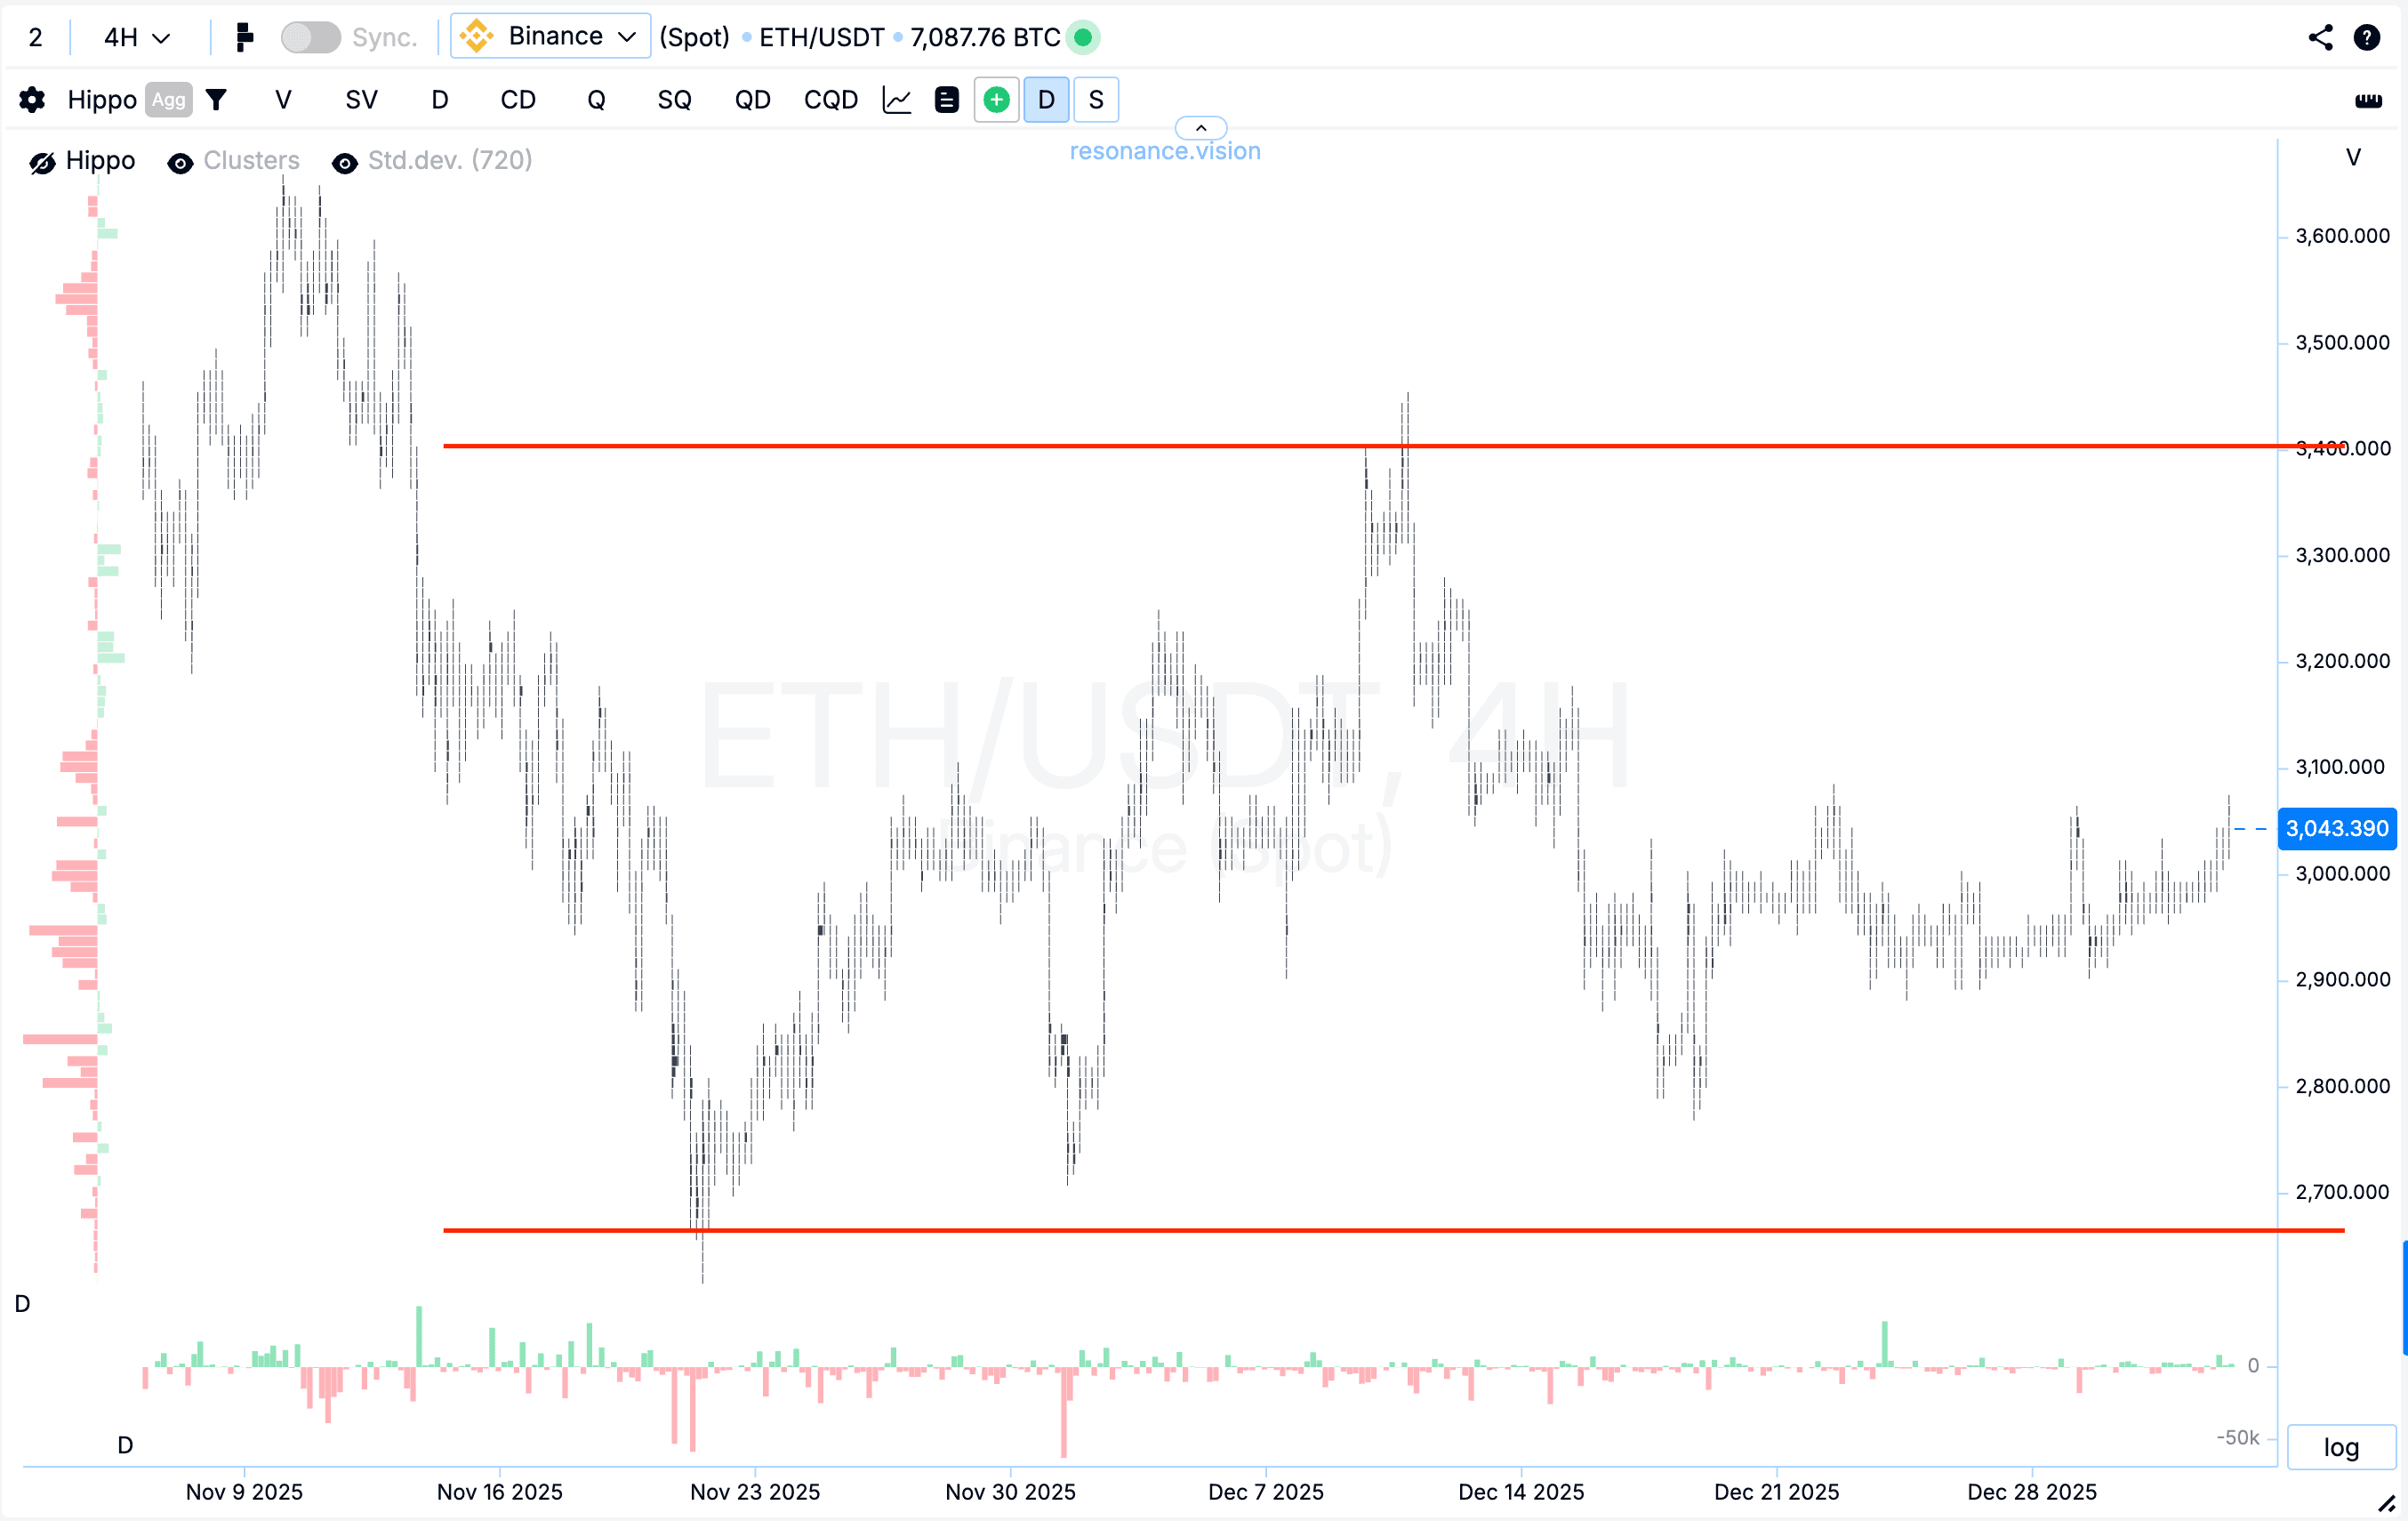
Динаміка ціни
Зараз волатильність залишається низькою. Ціна відхилена нагору, при цьому загальний баланс зберігається без яскраво вираженого зміщення в одну зі сторін.
Підсумок:
Локально ціна продовжує рух у бічному діапазоні, сформованому всередині лімітних скупчень, що відображаються на тепловій карті.
Яким чином ти реалізував би торгову ідею в такій ситуації?
Стеж за новими статтями у нашому телеграм каналі.
Не треба вигадувати складних схем та шукати “грааль”. Використовуйте інструменти платформи Resonance.
Реєструйся за посиланням - отримуй бонус і починай заробляти:
OKX | BingX | KuCoin.
Промокод TOPBLOG дає тобі 10% знижки на будь-який тарифний план Resonance.
Рекомендовані статті


