Огляд ринку з ALT - 20.02.2026

Бокове проторгування після зниження 📊 Переважання маркет-продажів за одночасної лімітної підтримки. Низька волатильність, нейтральний баланс та концентрація ліквідності в діапазоні.
Зміст

У даному огляді ринку ми не намагаємося прогнозувати майбутнє, наше завдання констатувати факти, які ми маємо на поточний момент. І будувати свої дії на основі поточних фактів, а не наших очікувань та надій.
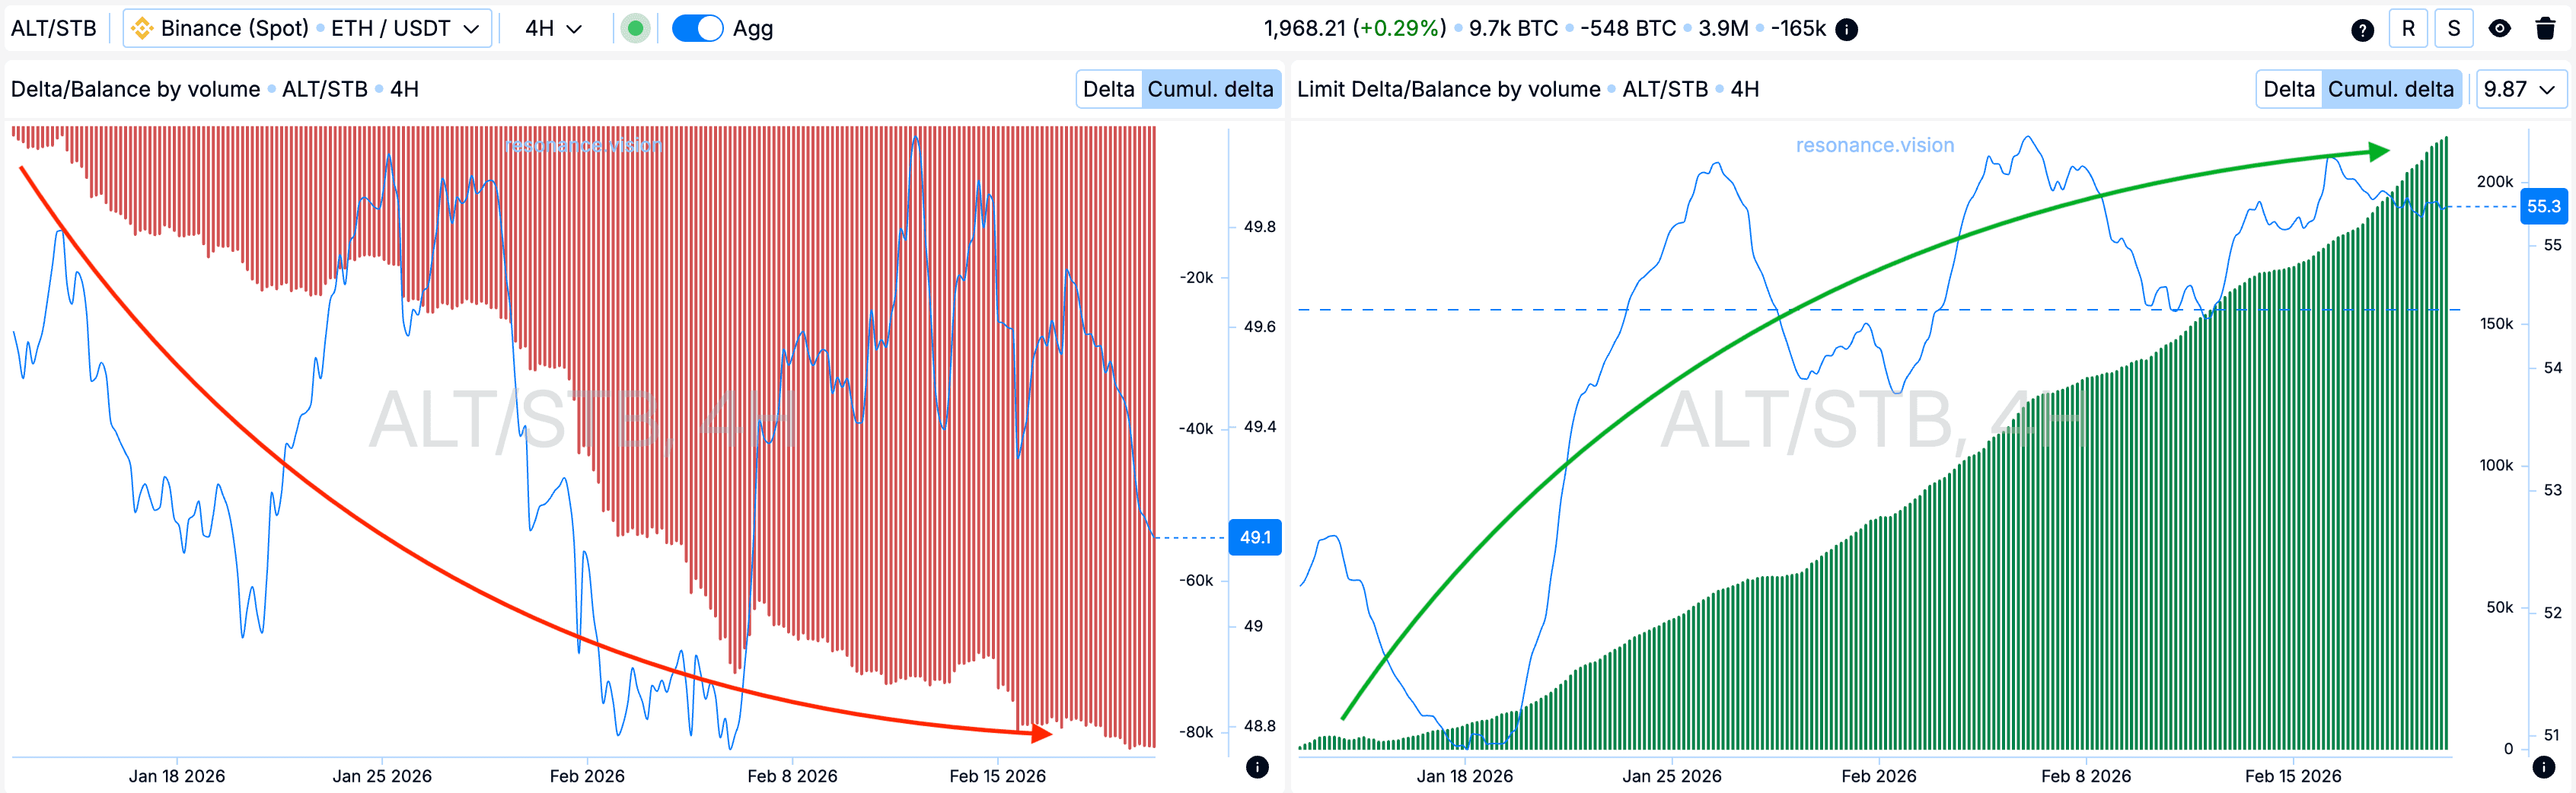
Ринкові ордери та лімітні заяки
В агрегованому форматі зберігається накопичувальна перевага маркет-ордерів на продаж (червона стрілка). Це виразно відображено на гістограмі кумулятивної дельти і вказує на тиск з боку ринкових продавців, що триває.
Водночас за лімітними ордерами спостерігається стійке переважання заявок на купівлю (зелена стрілка). У поточній структурі ринку саме ці об’єми виступають у ролі підтримки, стримуючи тиск маркет-продажів та не дозволяючи ціні розвивати подальше зниження.
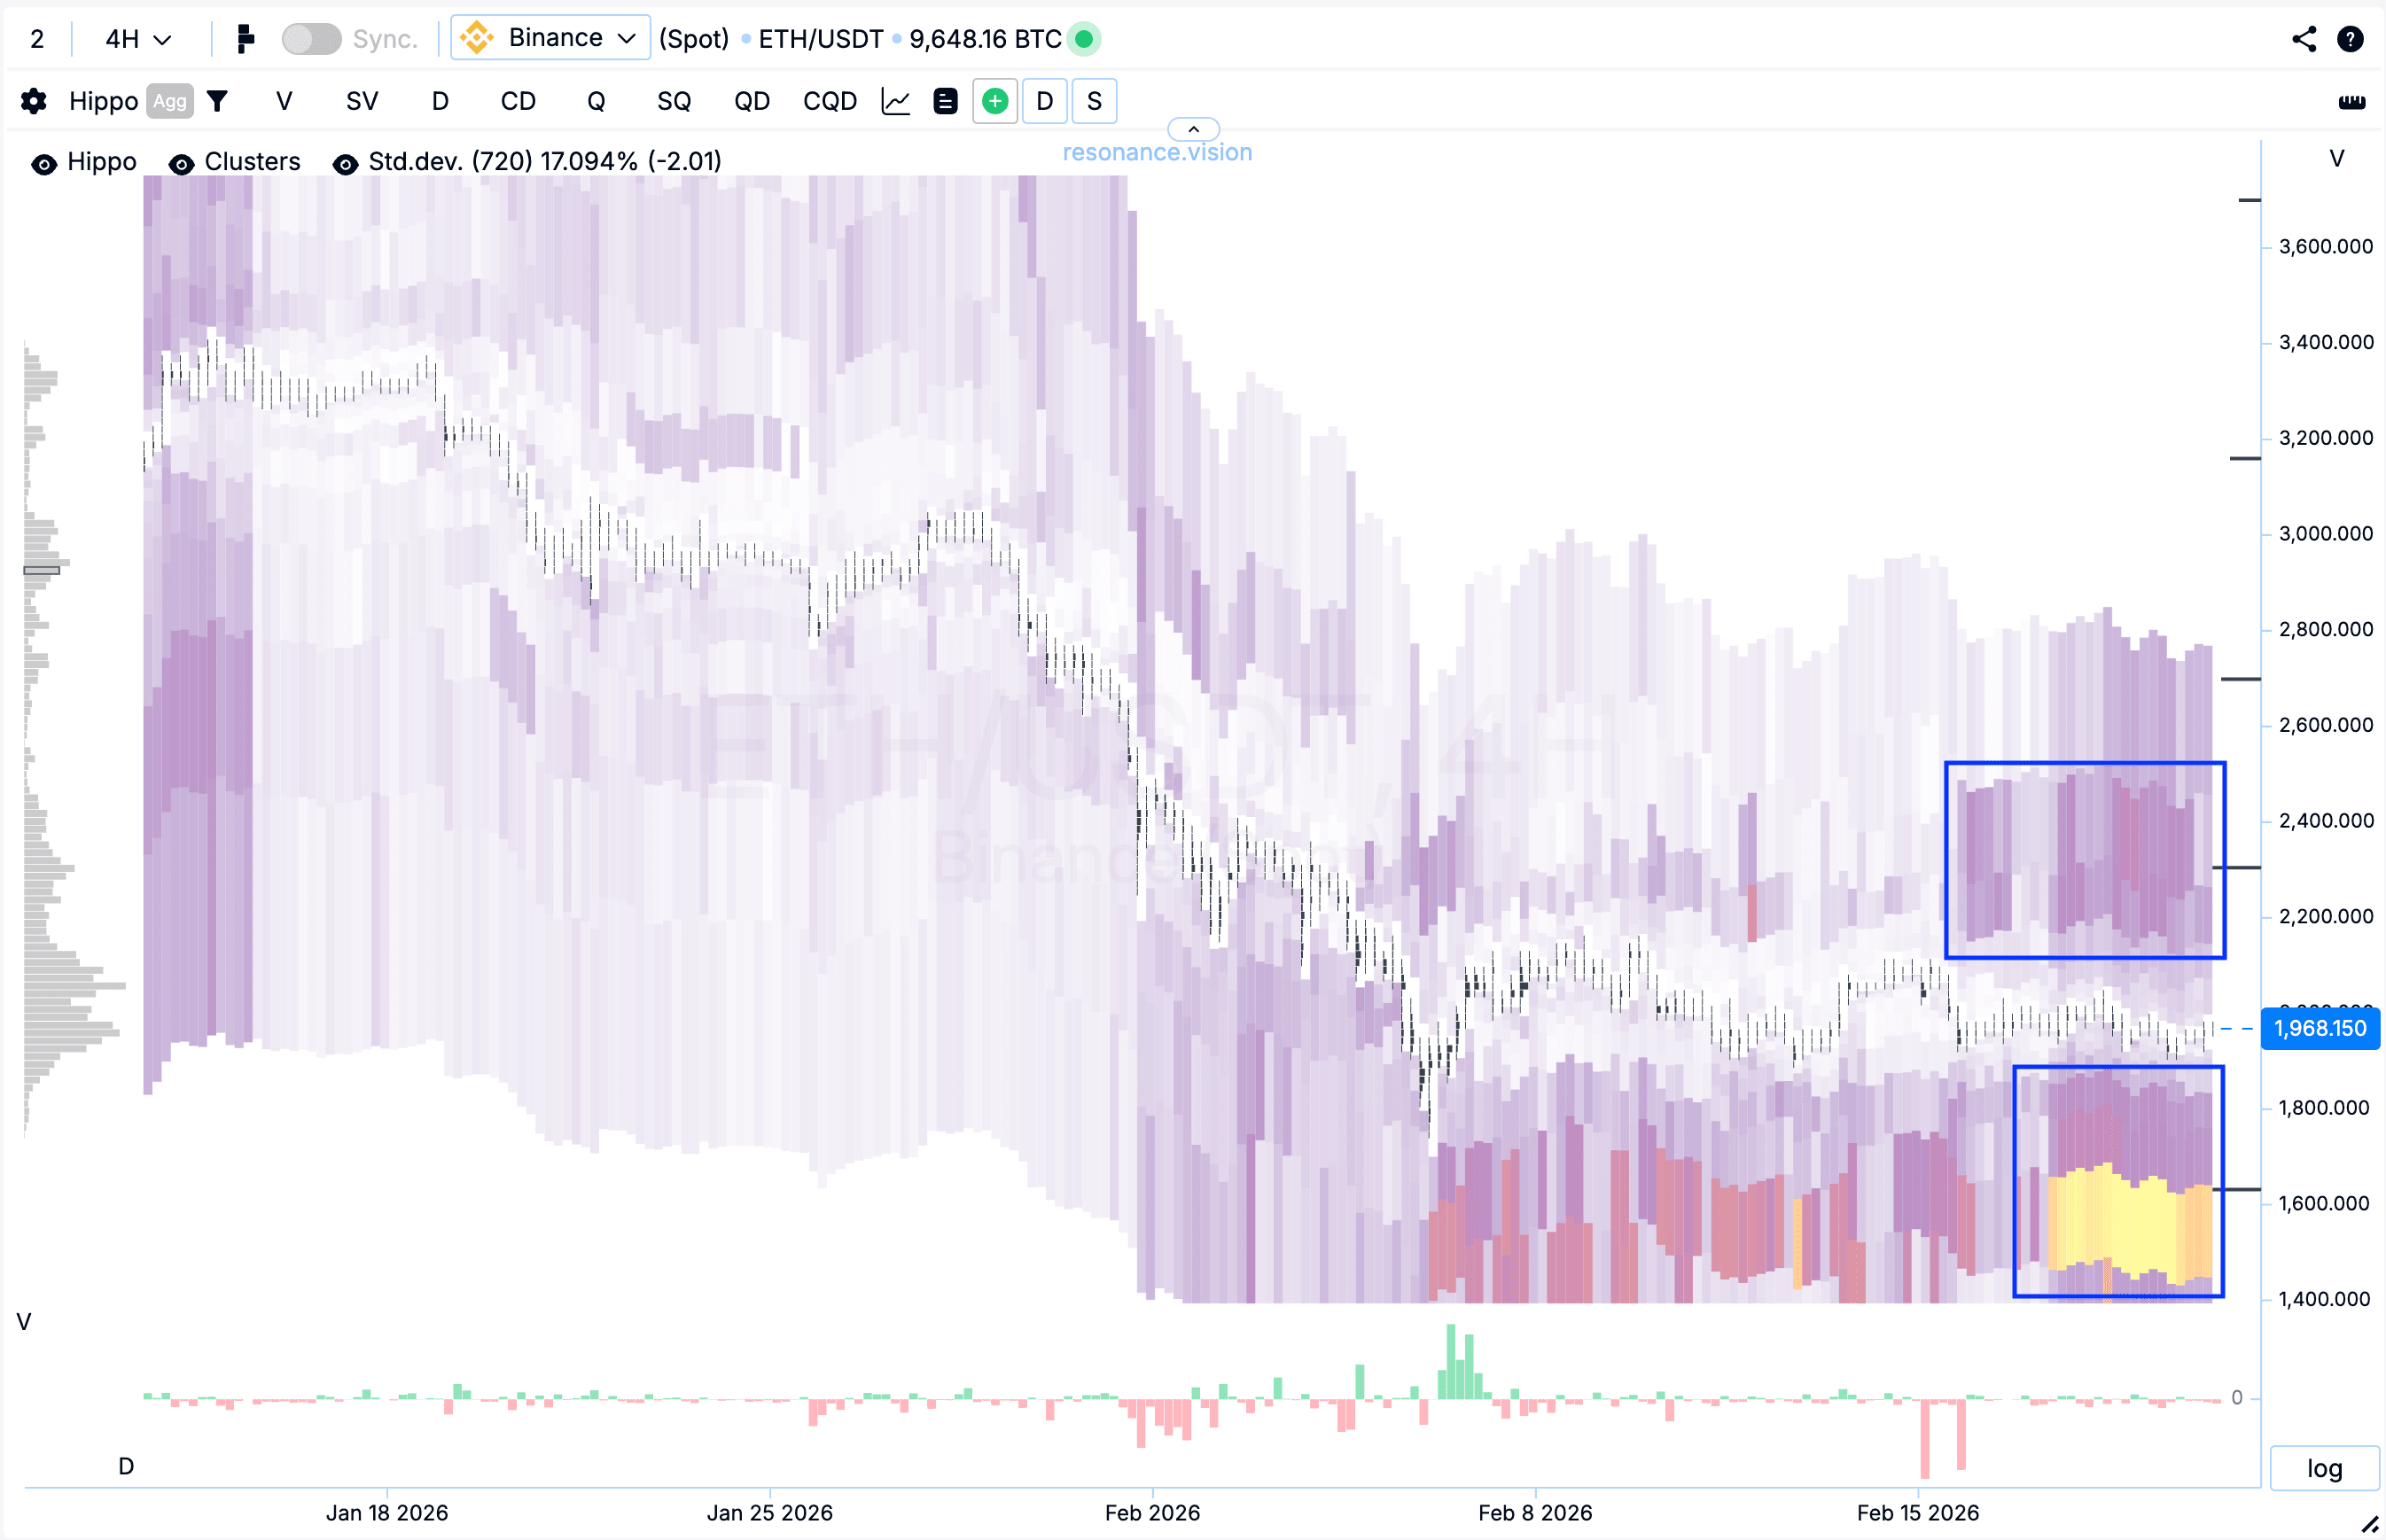
Теплова карта в режимі об’єму (синій прямокутник)
На тепловій карті фіксуються істотно аномальні скупчення лімітних заявок на покупку трохи нижче за поточну ціну (синій прямокутник). Також є менш виражена щільність лімітних заявок і вище поточного діапазону (синій прямокутник), що вказує на локальну концентрацію ліквідності в обидві сторони.
Така структура говорить про формування зони балансу, де учасники накопичують позиції та активно виставляють ліквідність у межах діапазону.
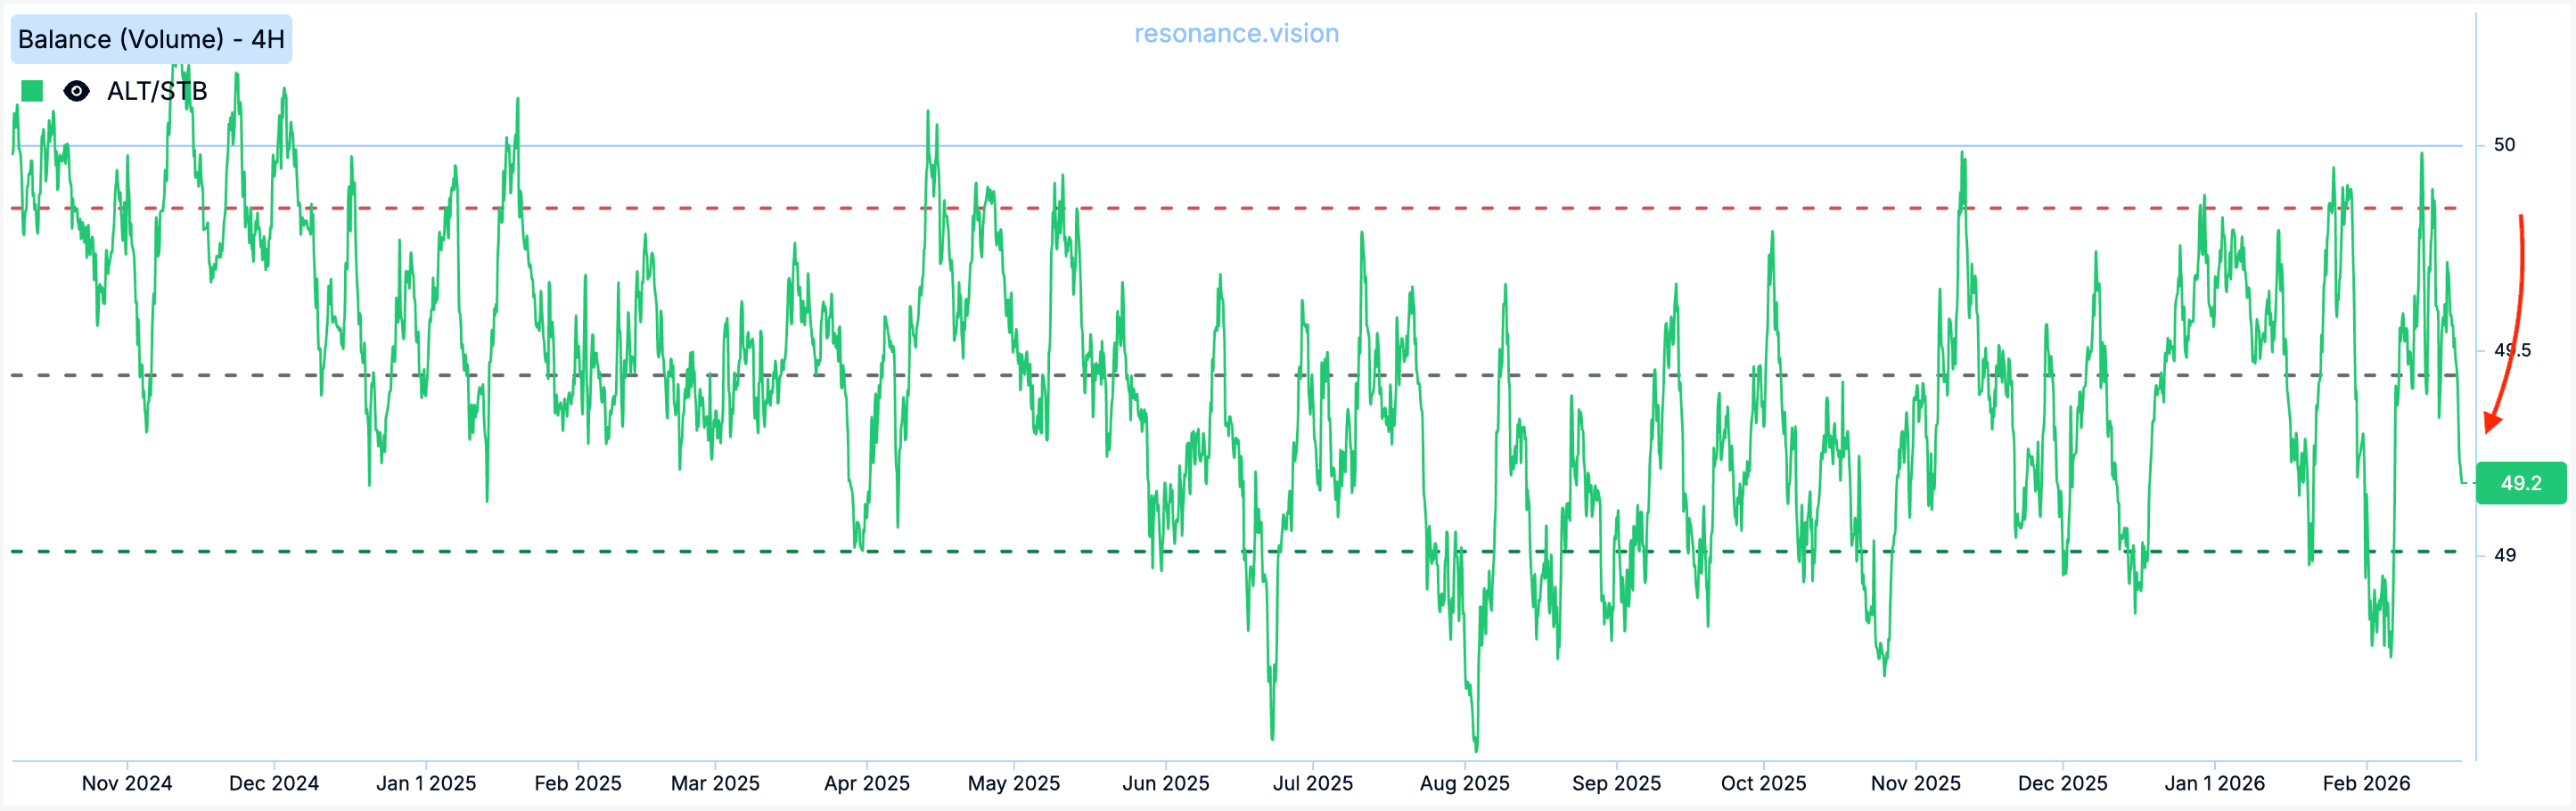
Індекс балансу
Індекс балансу змістився ближче до нейтрального стану і знаходиться в межах нормальних значень перцентилю.
Це додатково підтверджує відсутність вираженого дисбалансу та вказує на перехід ринку у фазу консолідації.
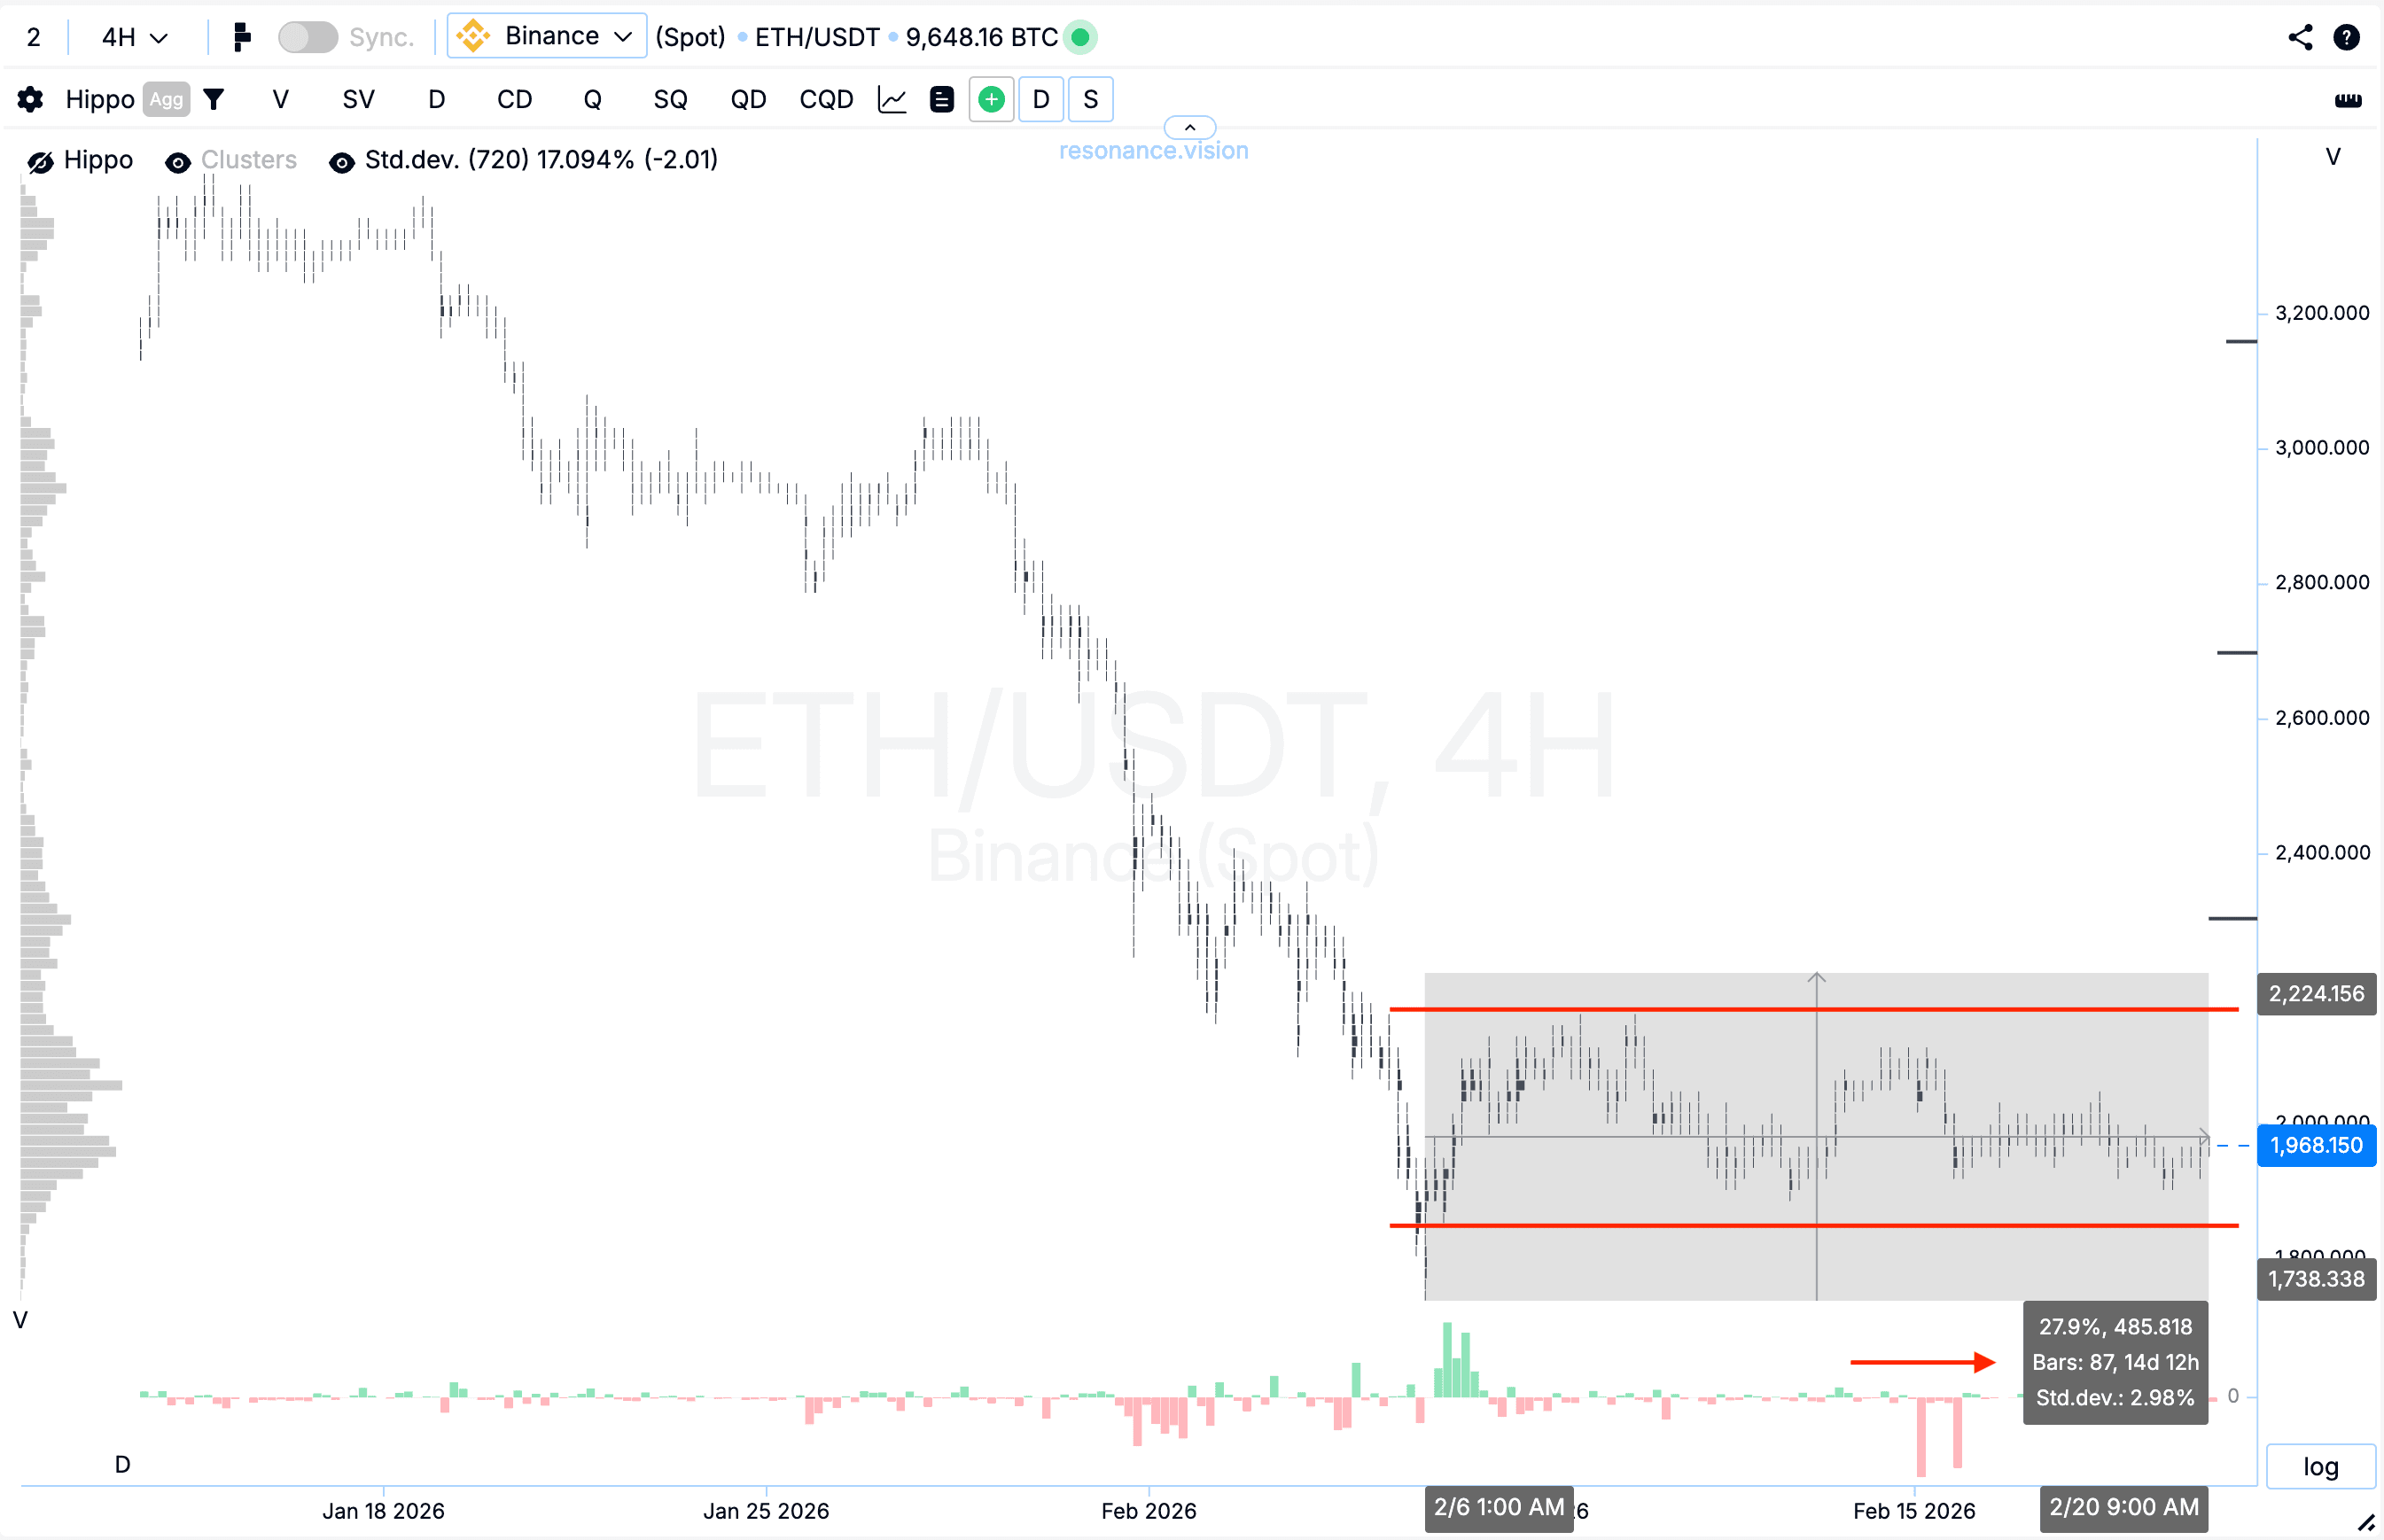
Динаміка ціни
Незважаючи на переважання маркет-продажів, ціна продовжує рух у форматі бічного проторгування. Лімітних заявок на покупку підставляється більше і ринку не вдається оновити локальний мінімум.
Підсумок:
Після останнього зниження ринок перейшов у фазу бічного проторгування. Вже близько 15 днів ціна не оновлює ні локального максимуму, ні локального мінімуму. Волатильність залишається низькою.
Яким чином ти реалізував би торгову ідею в такій ситуації?
Стеж за новими статтями у нашому телеграм каналі.
Не треба вигадувати складних схем та шукати “грааль”. Використовуйте інструменти платформи Resonance.
Реєструйся за посиланням - отримуй бонус і починай заробляти:
OKX | BingX | KuCoin.
Промокод TOPBLOG дає тобі 10% знижки на будь-який тарифний план Resonance.
Рекомендовані статті


