ZRO +20.1% (Resonance Directional Strategy)


This analysis demonstrates how volume-based price reaction, cluster analysis, and aggregated delta and Z-Score data allow you to find excellent market moves and make informed trading decisions with controlled risk.
Table of content
Coin: ZRO/USDT
Risk: high
Level of understanding: beginner
Reasons for entry
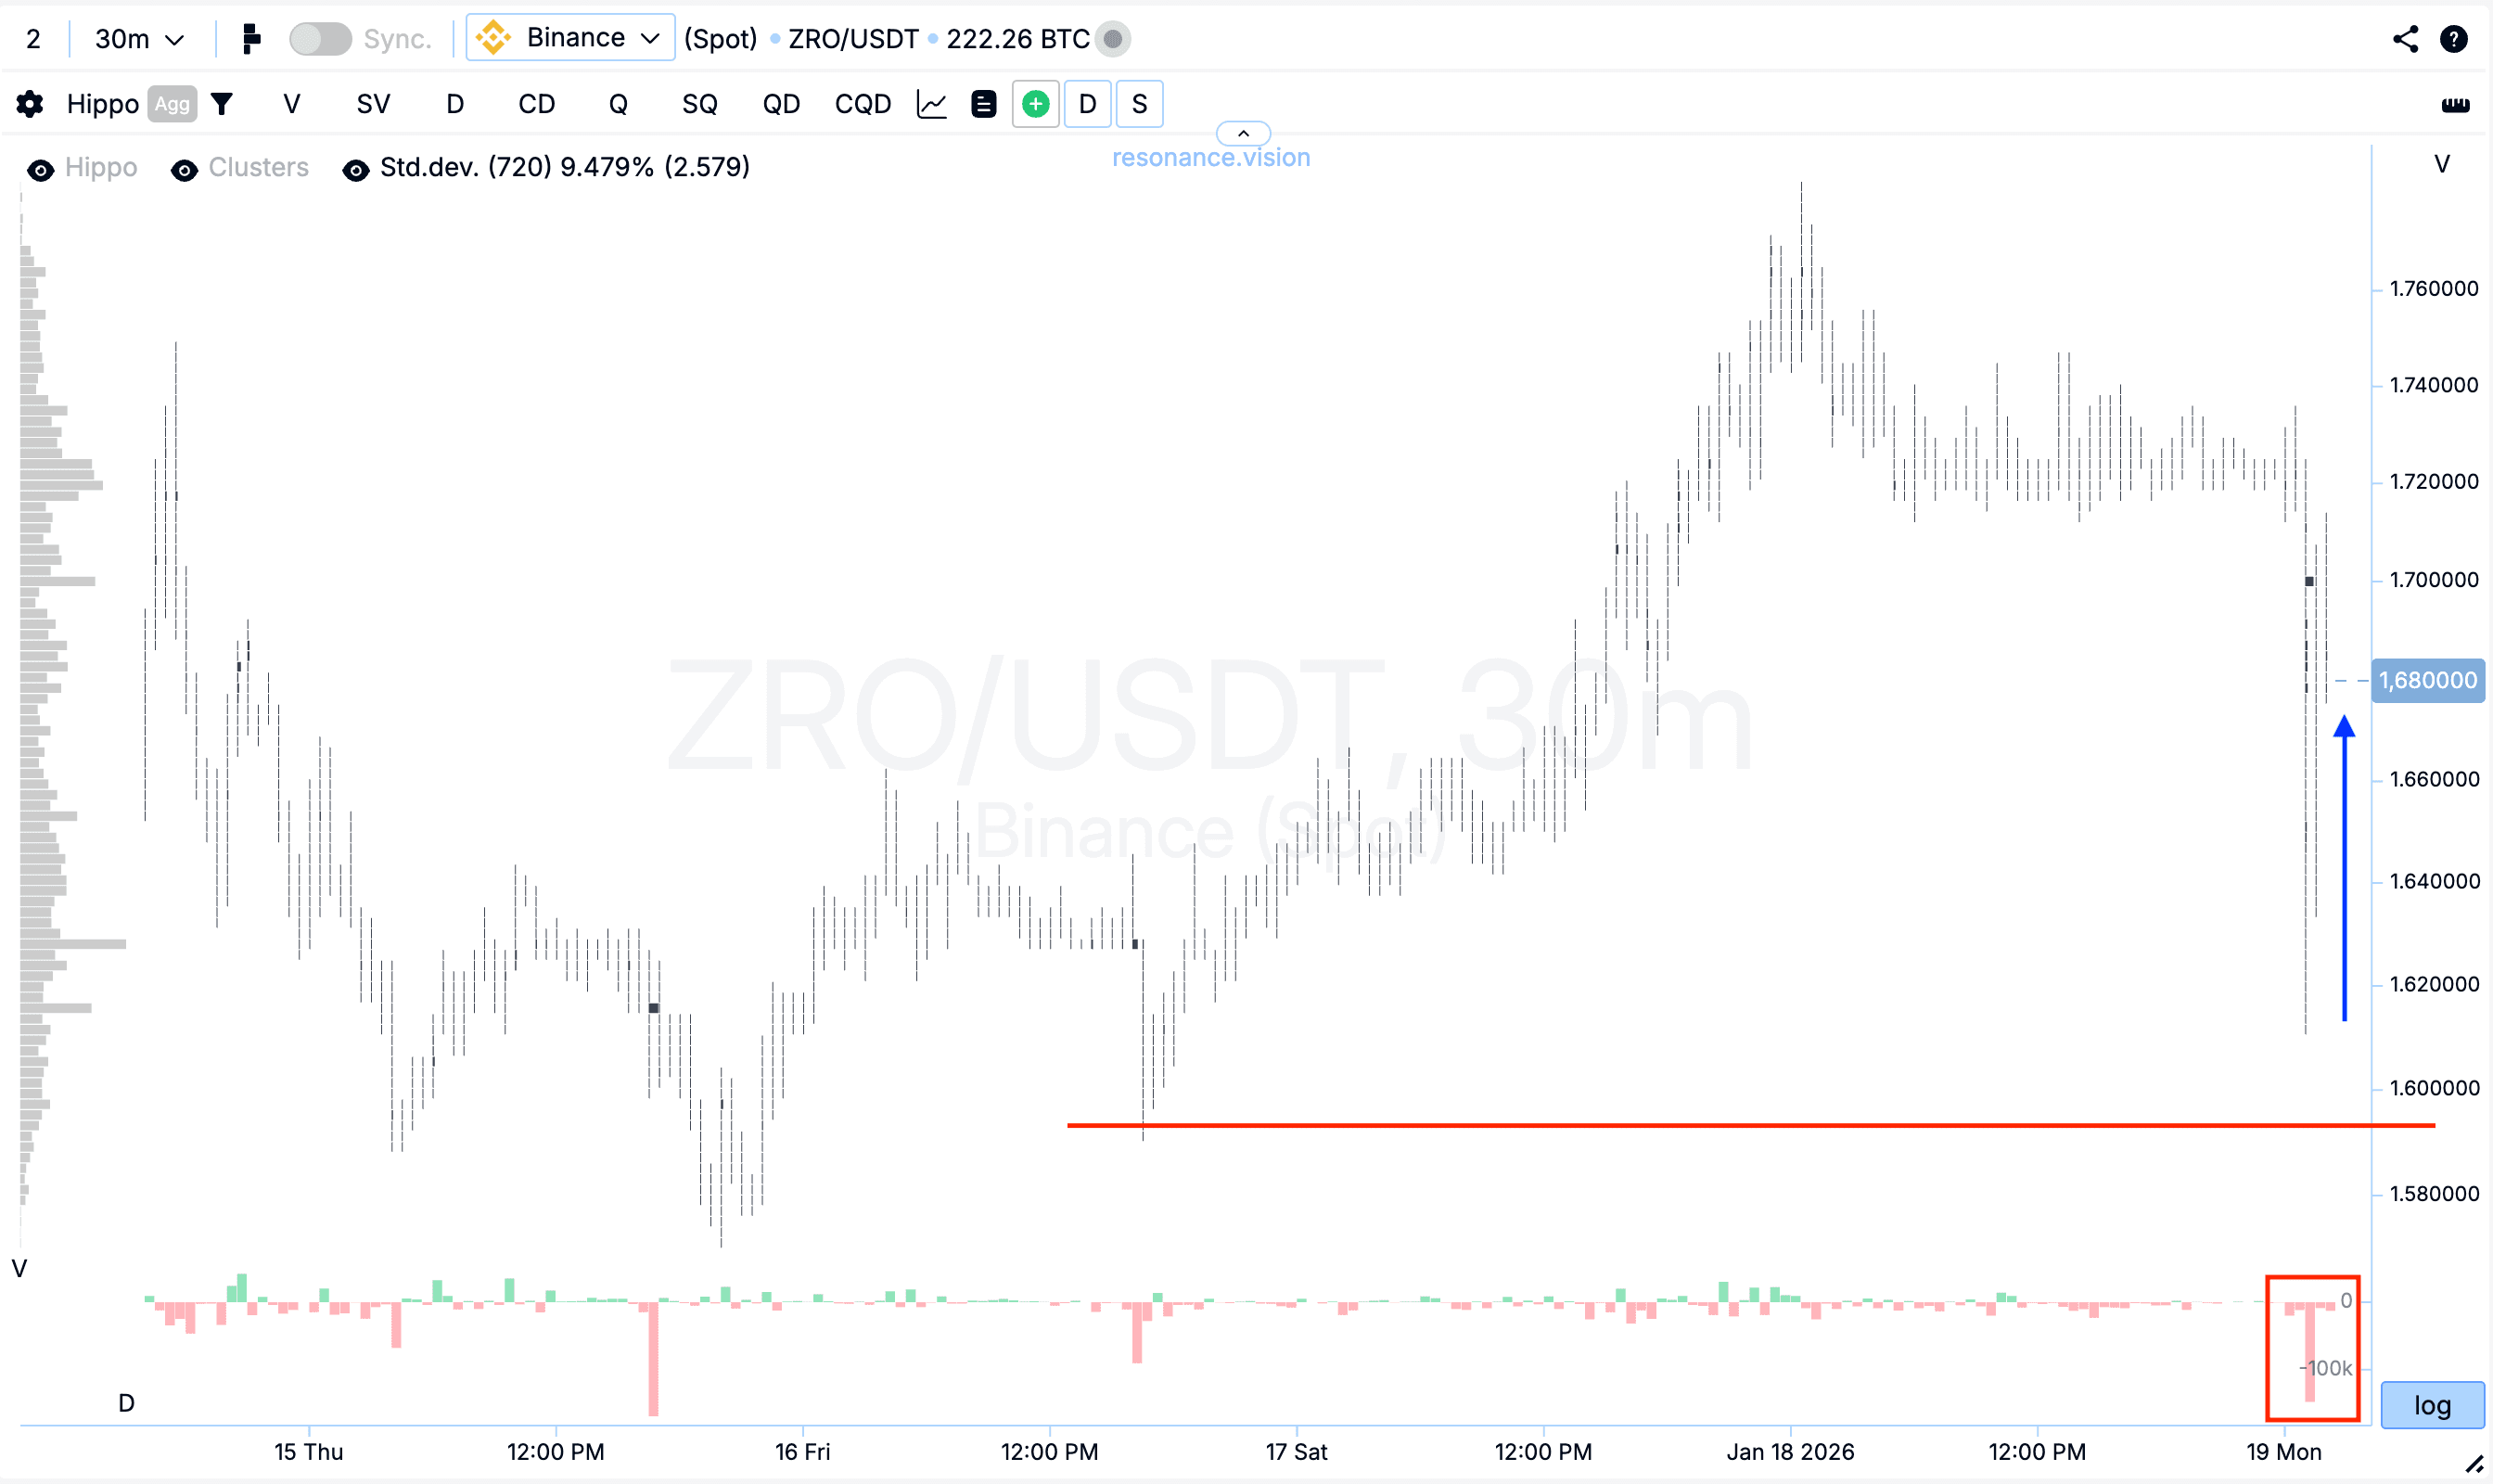
Cluster chart: After an impulsive downward move, a pullback formed (blue arrow). In this area, significant volumes of market sell orders entered the market, however, the price failed to update the local low (red rectangle and line).
Such a reaction indicates the inefficiency of selling pressure and the presence of signs of a local deficit, where volume no longer leads to further price decline.
In the Dashboard
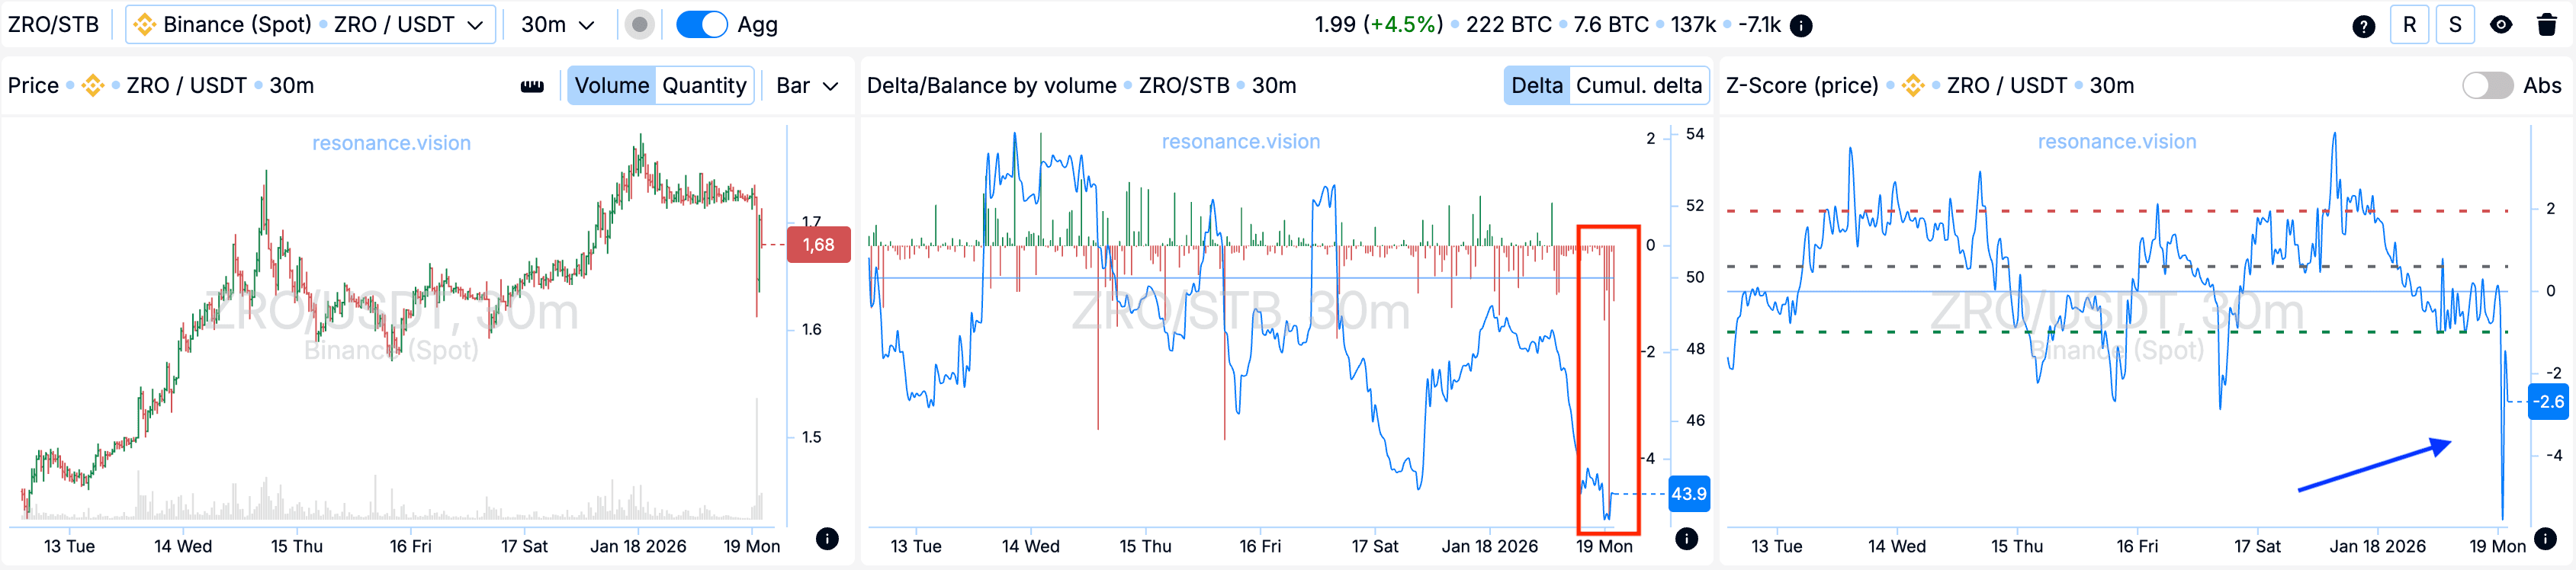
Delta / Volume balance: Aggregated data across all pairs and exchanges confirm the observations from the cluster chart. During the analyzed period, market sell volumes were significantly higher than usual, which is clearly visible on the delta histogram (red rectangle).
At the same time, the price did not show a corresponding downward reaction, indicating the readiness of limit buyers to absorb the incoming market volume. Such a structure forms local support and further confirms the weakening of selling pressure.
Z-Score (price): Additionally, at the peak, a downward price deviation of more than 4 standard deviations was recorded (blue arrow). Such statistically anomalous values are often accompanied by a slowdown of the move or the formation of a local reversal, which strengthens the validity of the entry point.
Reasons for exit
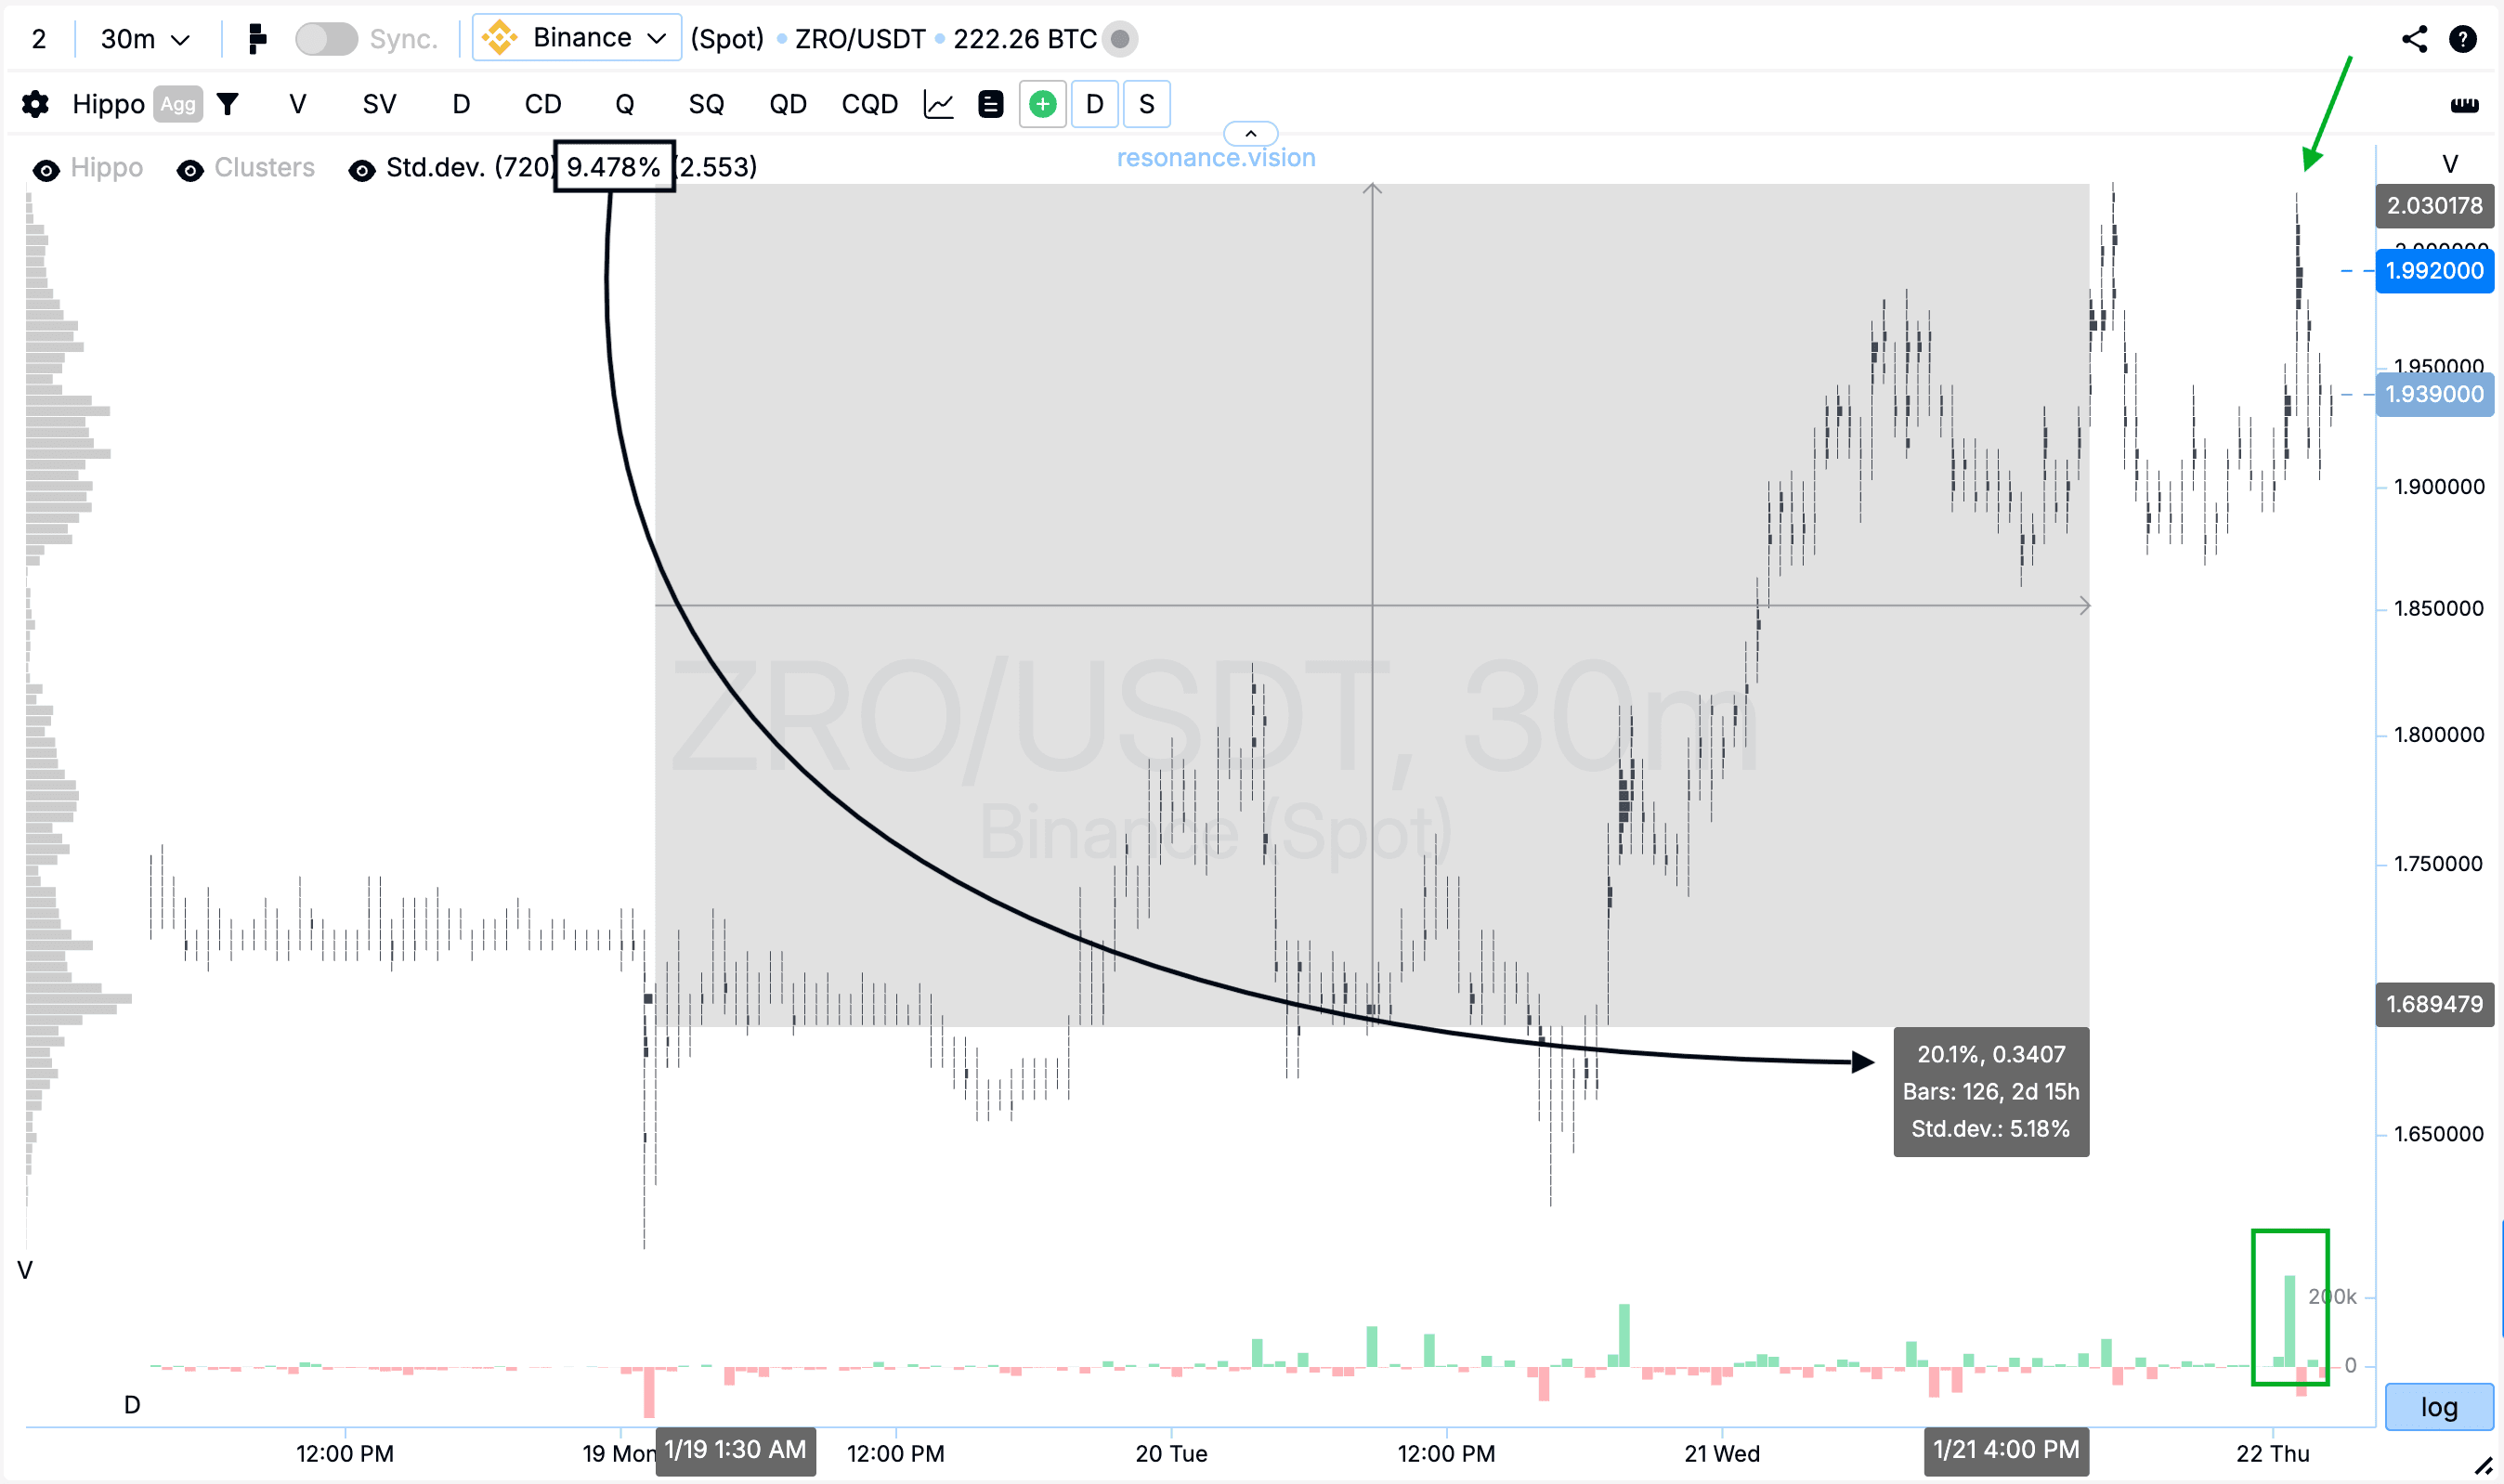
Cluster chart: After the entry point, the price increased by 20%, while volatility noticeably rose within this range. During a repeated attempt to continue the growth, buying volumes failed to update the local high (green rectangle and arrow), indicating the appearance of signs of a local surplus.
It is also worth noting that this move exceeded two standard price deviations, while one standard deviation for this asset equals 9.478% (black rectangle and arrow). Under such conditions, further holding of the position would be accompanied by increasing risk, therefore profit taking appears to be the most logical and balanced decision.
Conclusion
This review clearly shows that such market moves occur quite frequently, however, the key factor is not the volume itself, but the price reaction to it. In this case, significant market sell pressure did not lead to new lows, which indicated a decline in sellers’ effectiveness and the formation of a local deficit.
Using the cluster chart in combination with aggregated delta data and the Z-Score made it possible to objectively assess the entry point, while the subsequent increase in volatility and signs of surplus allowed for timely profit taking. This approach helps structure trades with clear logic, operate based on facts, and control risk rather than relying on expectations and assumptions.
Follow new insights in our telegram channel.
No need to invent complex schemes and look for the "grail". Use the Resonance platform tools.
Register via the link — get a bonus and start earning:
OKX | BingX | KuCoin.
Promo code TOPBLOG gives you a 10% discount on any Resonance tariff plan.


