RTT: the main tool for analysing and trading cryptocurrencies

RTT is the heart of the Resonance platform. It combines in-depth analytics of market supply and demand with trading. All the tools you need are gathered in one place to help you see the market clearly and make smart decisions. Find out how RTT allows you to find profitable entry points, analyse large volumes, identify strong players and build strategies based on real market data!
Table of contents

What is RTT?
The RTT page is the main analytical environment for traders on the Resonance platform. It is here that you see everything that is happening on the market in real time and, most importantly, find profitable entry points into trades.
This tool allows you to combine cryptocurrency trading with the logic of market supply and demand by analysing market depth, volumes, limits, and price reaction. If you don’t know how to trade cryptocurrencies yet, this is where your journey begins.
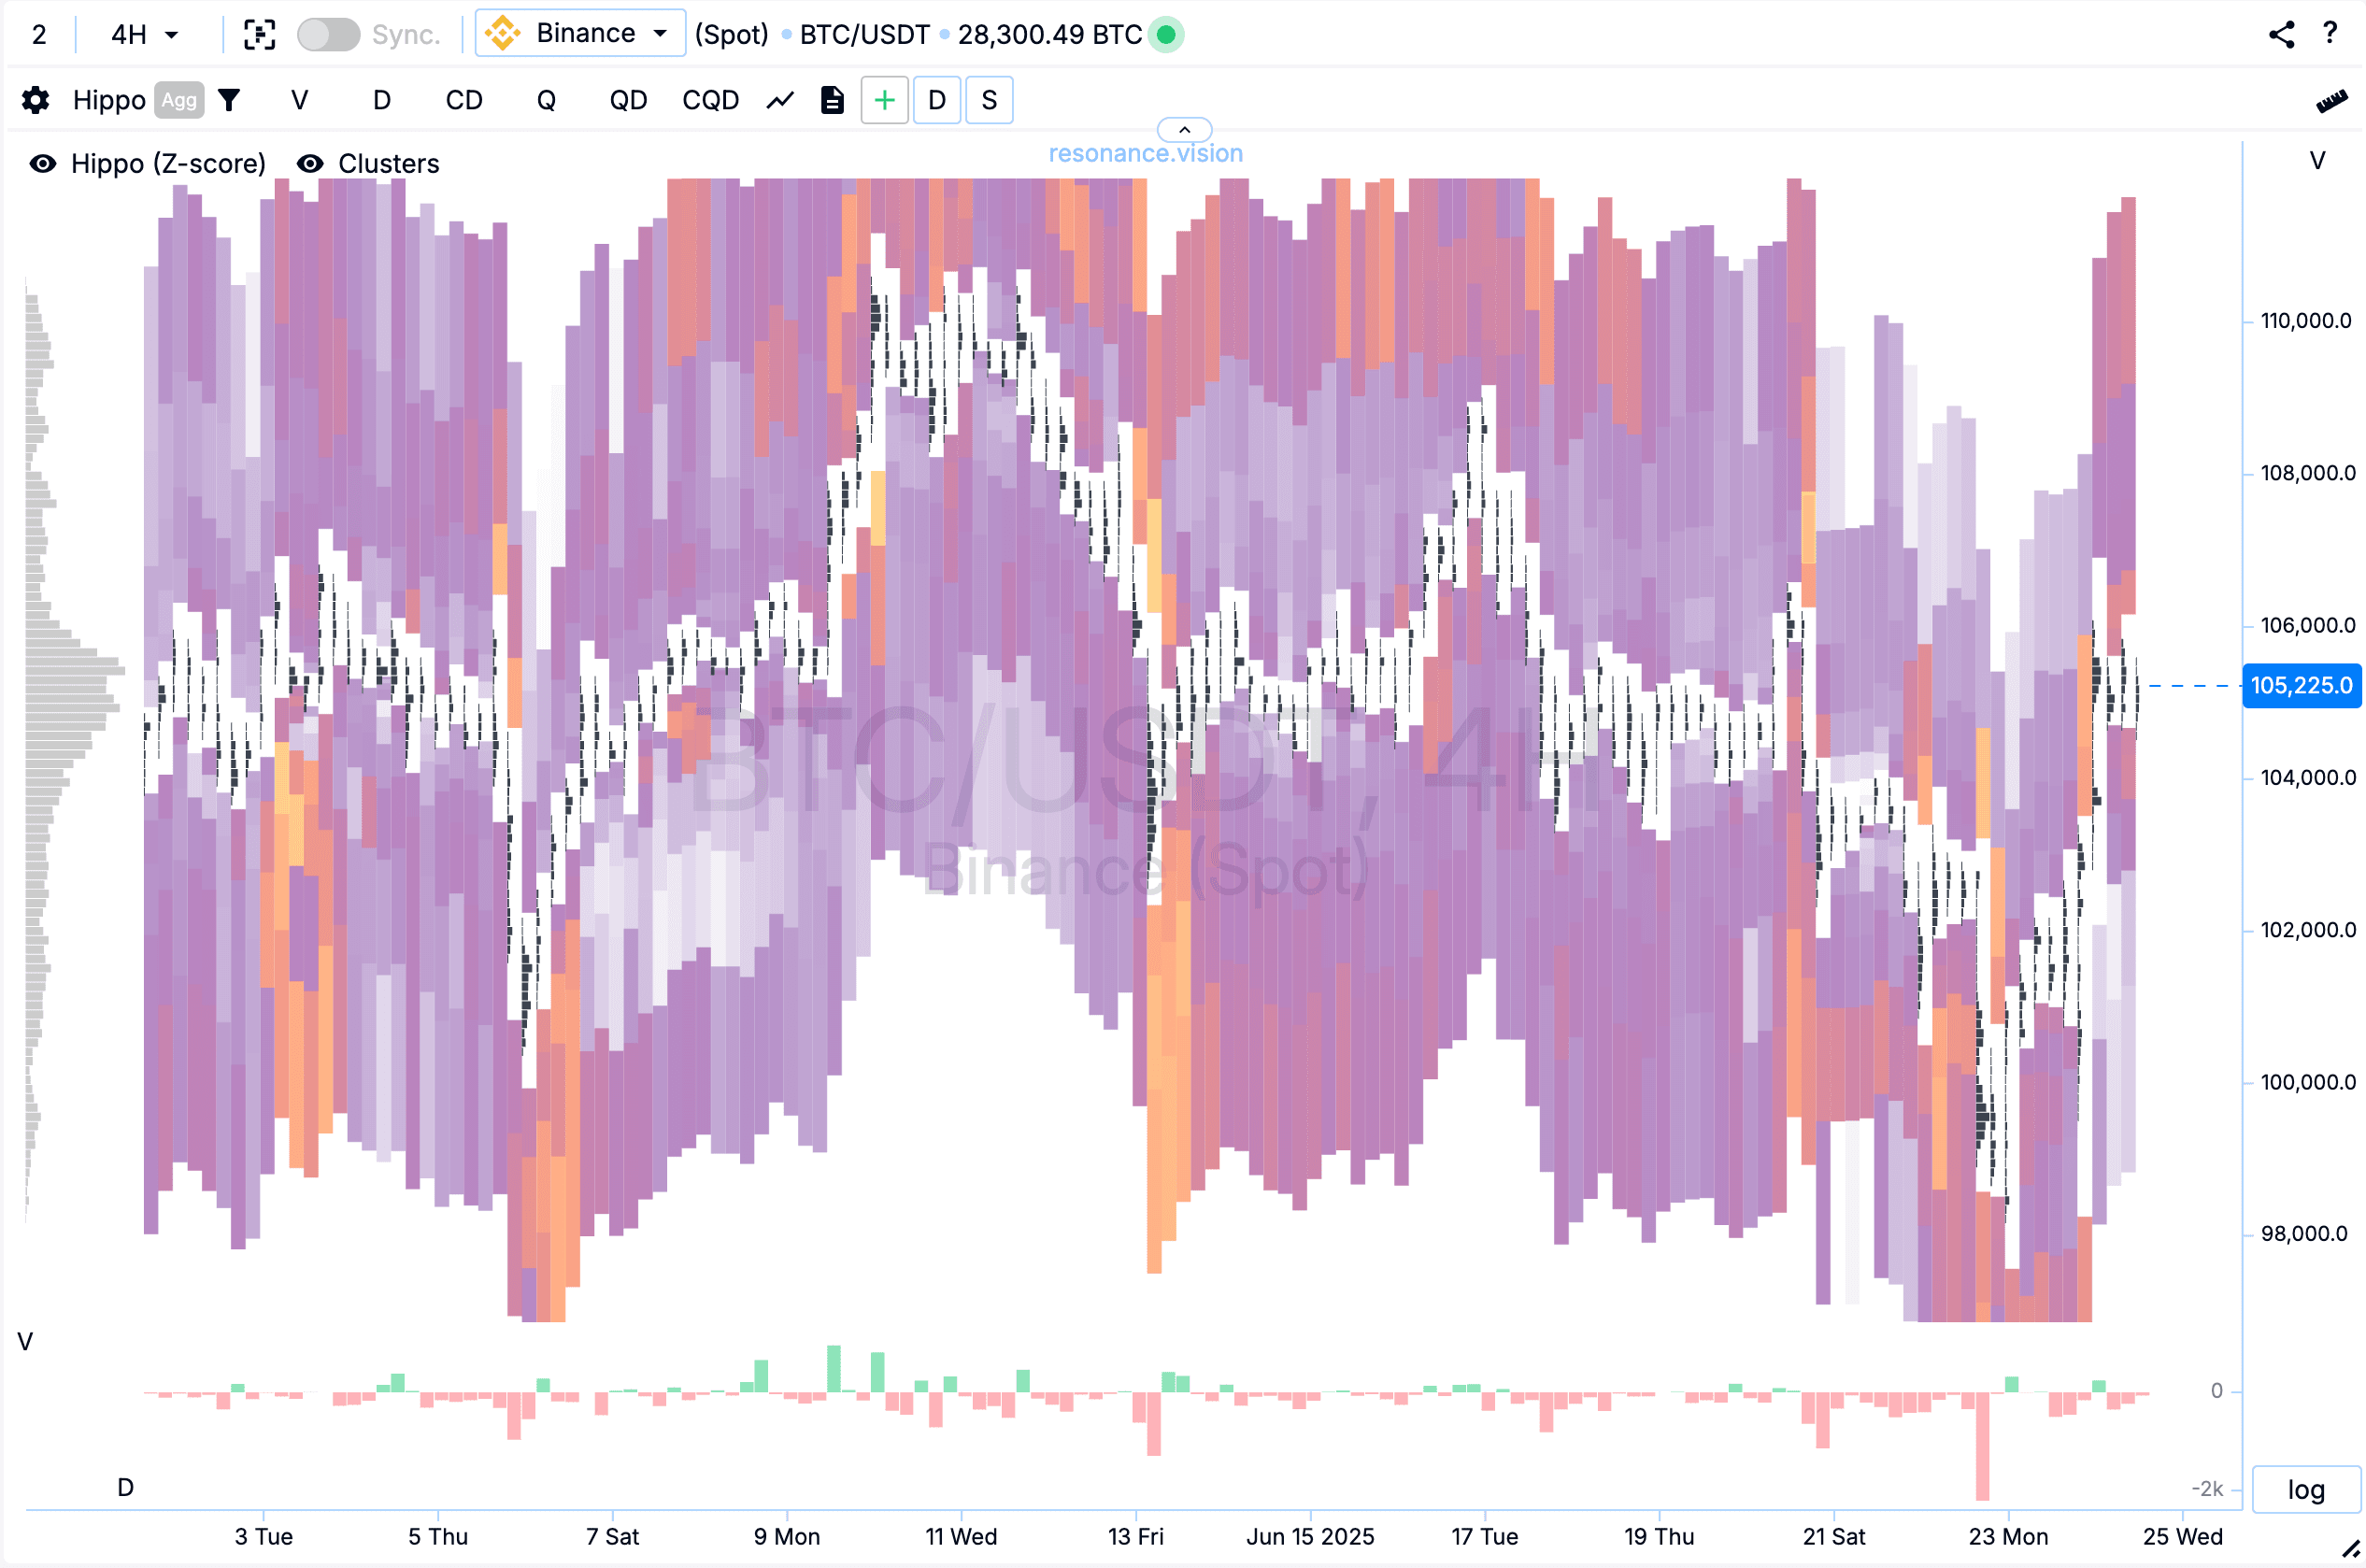
Cryptocurrency Cluster Chart
This is a type of visualisation that shows transactions grouped by three parameters: price, time, and volume. It is the cluster analysis of cryptocurrencies that allows you to see exactly where large volumes were traded and where the market imbalance occurs - deficit or surplus.
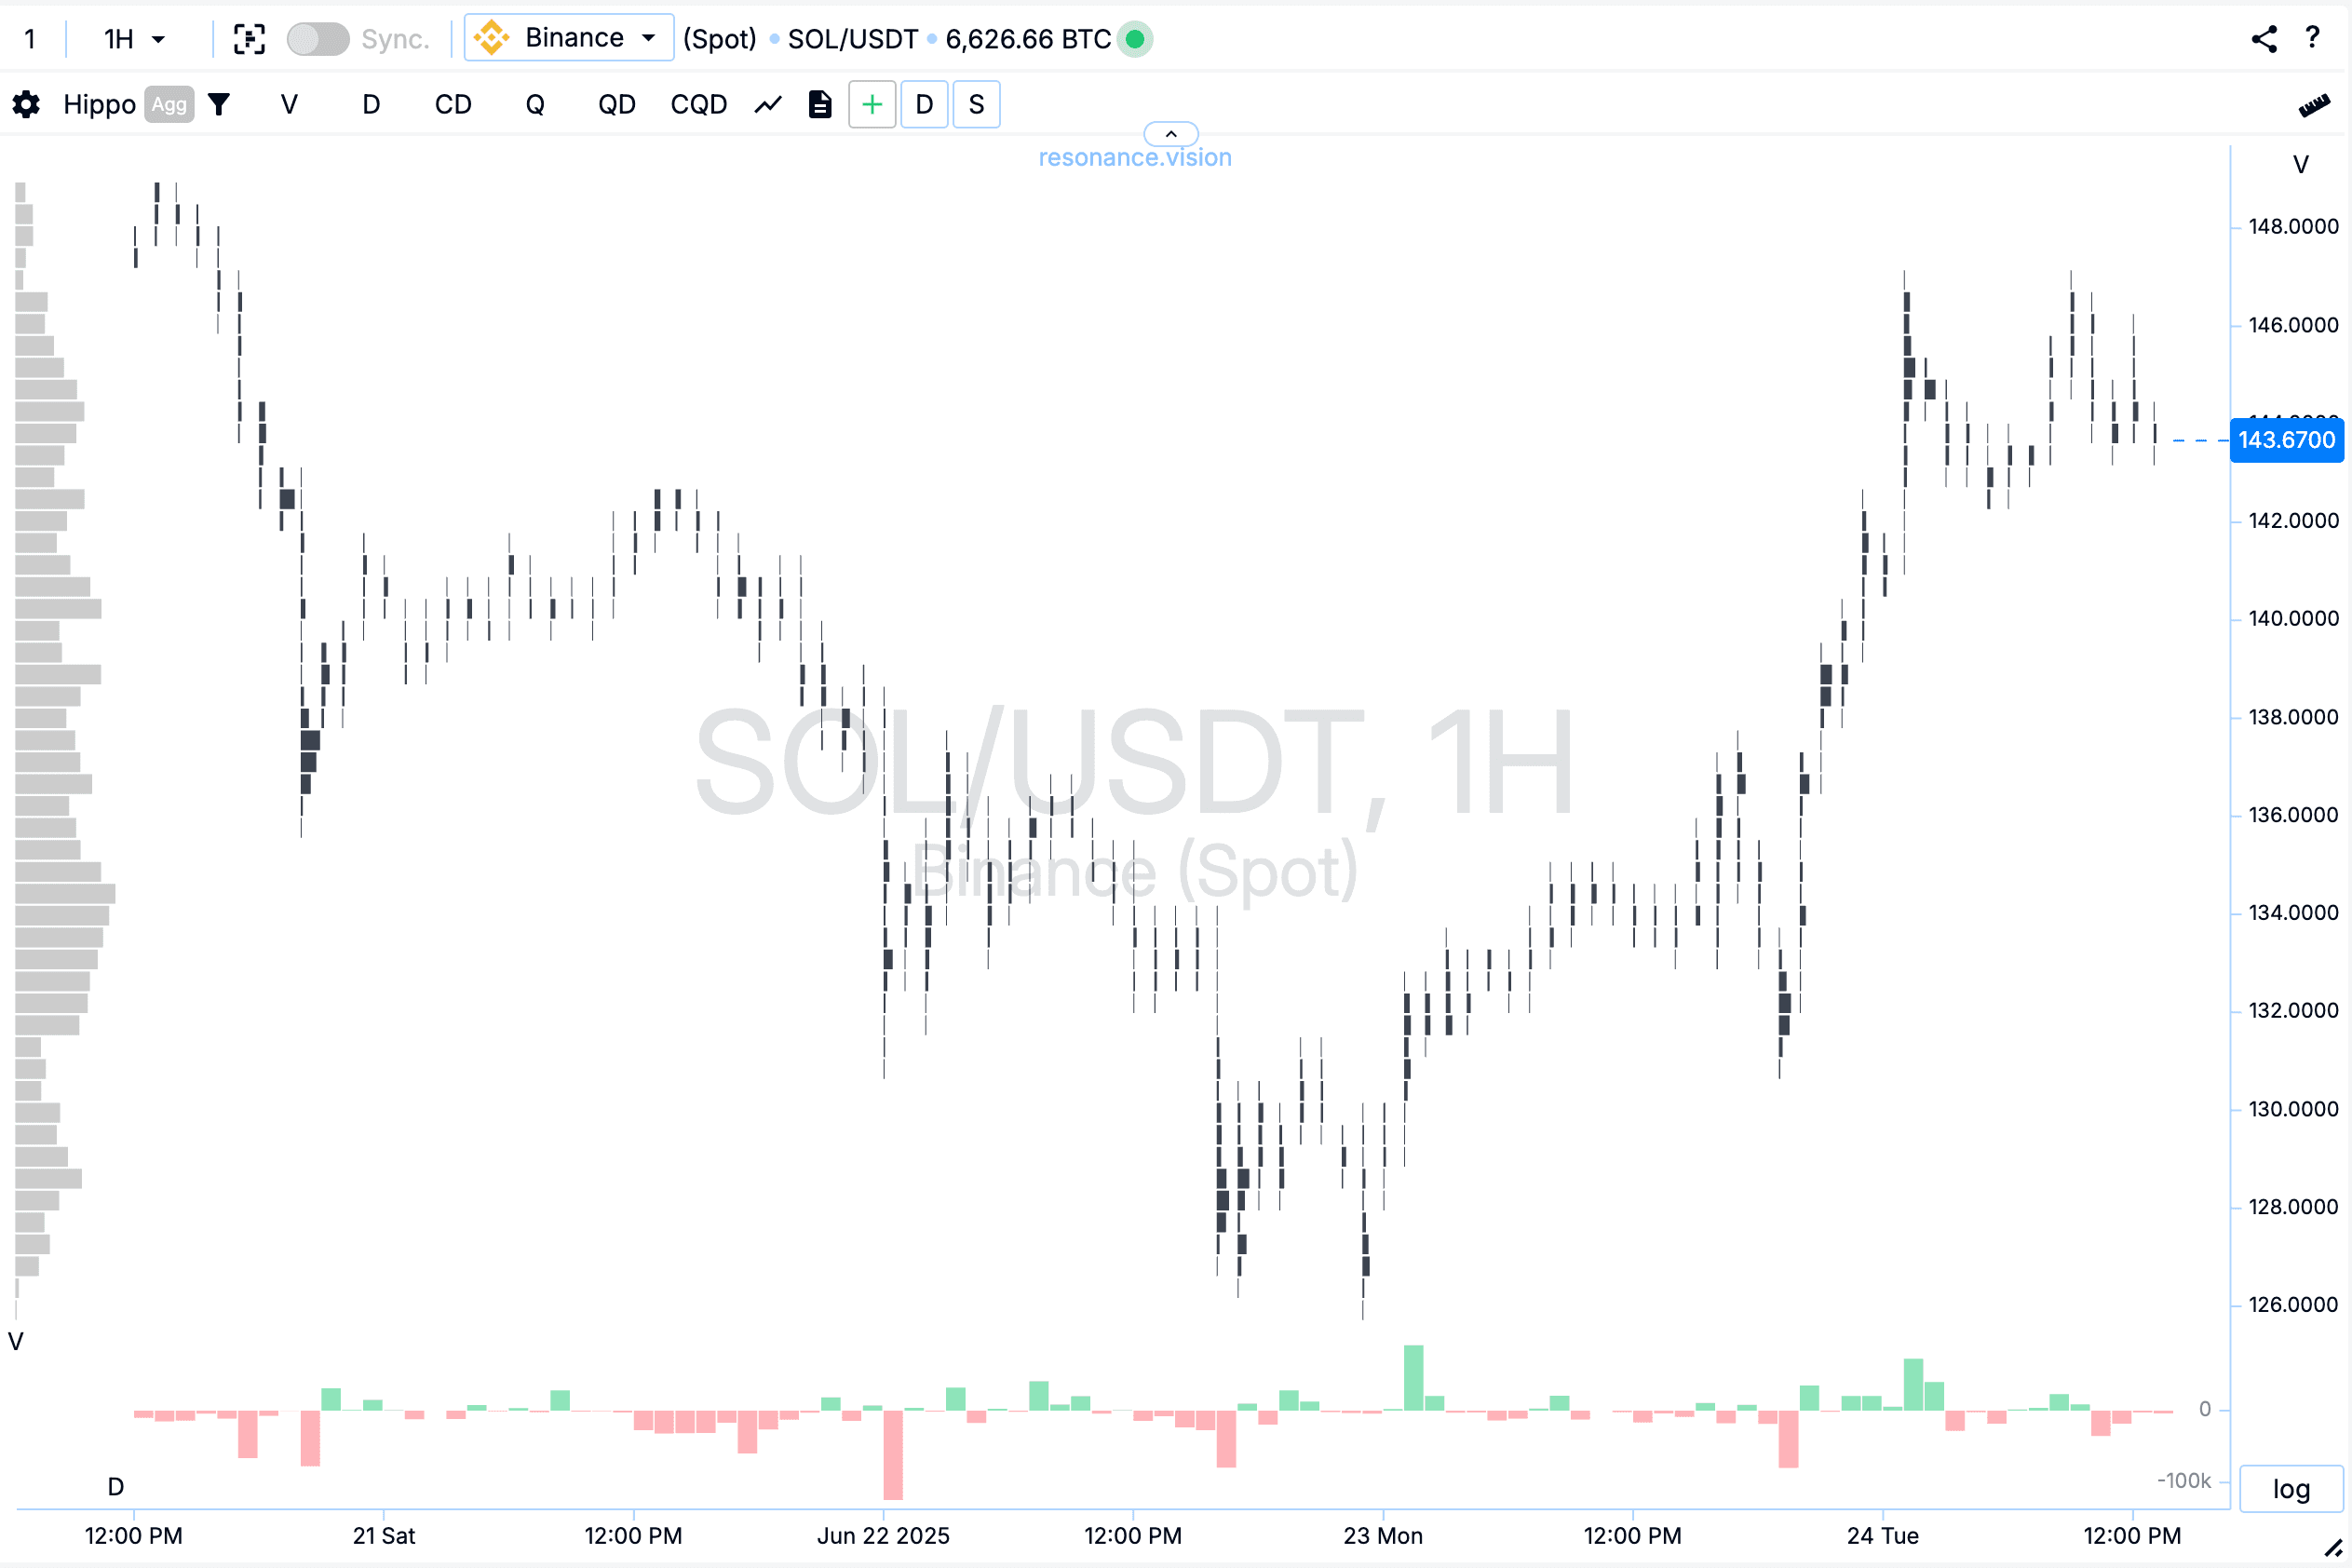
This approach is the basis for volumetric analysis of the crypto market.
You can add up to three charts simultaneously for analysis in different timeframes and on different data:
- volume
- delta
- number of transactions
- delta by number of transactions
- all in one browser window.
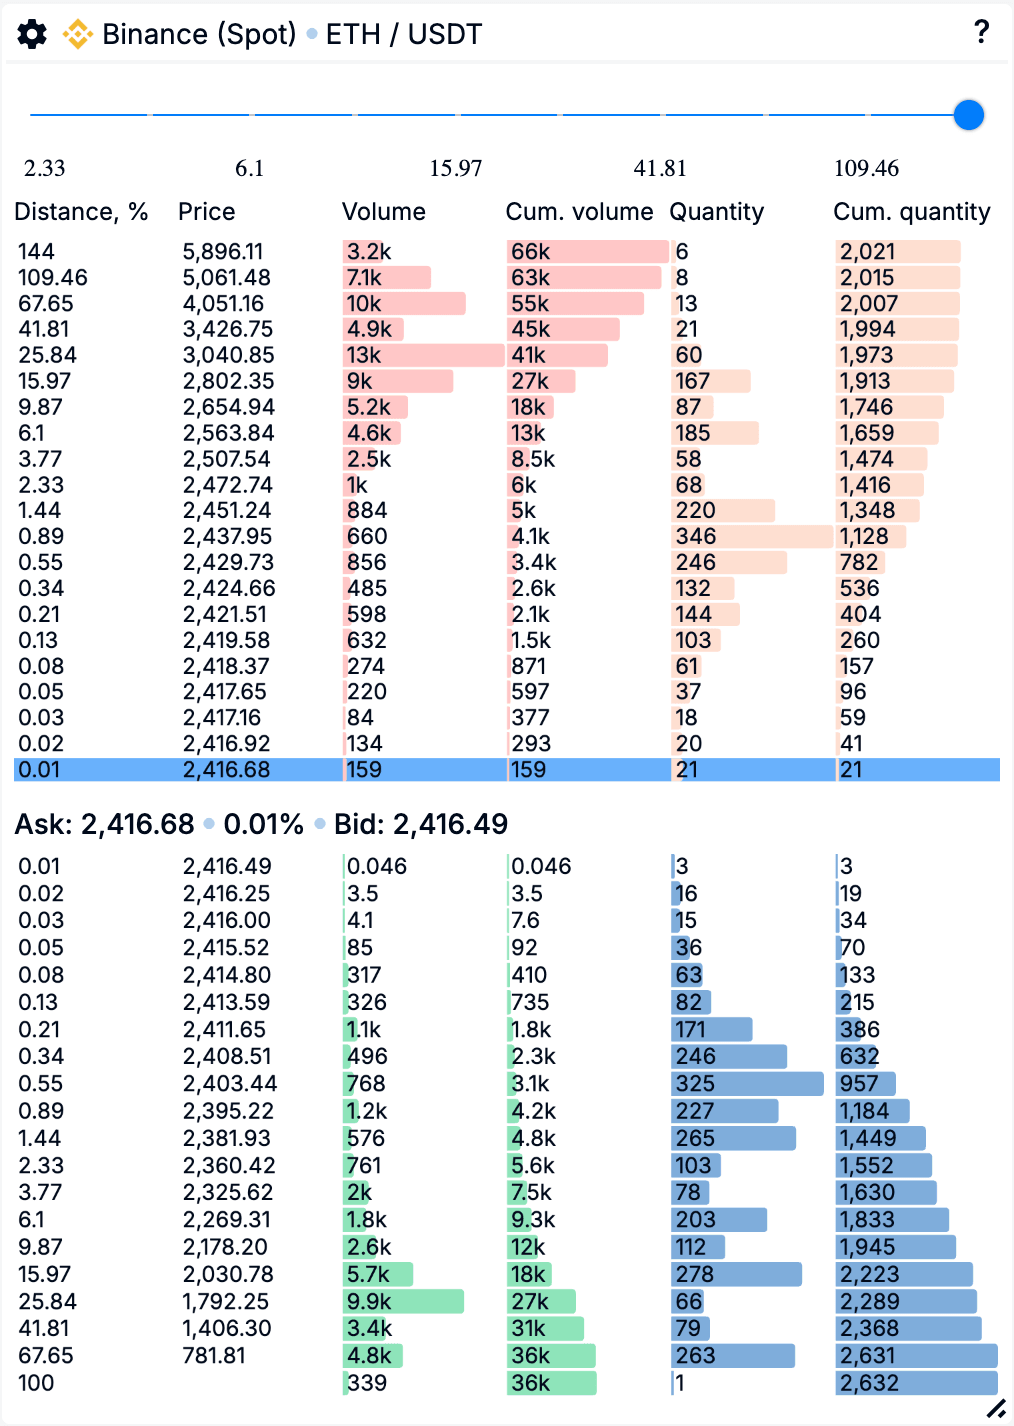
Market Depth (grouped order book)
The tool displays the depth of the cryptocurrency market - a grouped book of limit orders for buying and selling by price levels. The analysis of limit orders helps to identify support and resistance zones and assess where the price may stop or reverse.
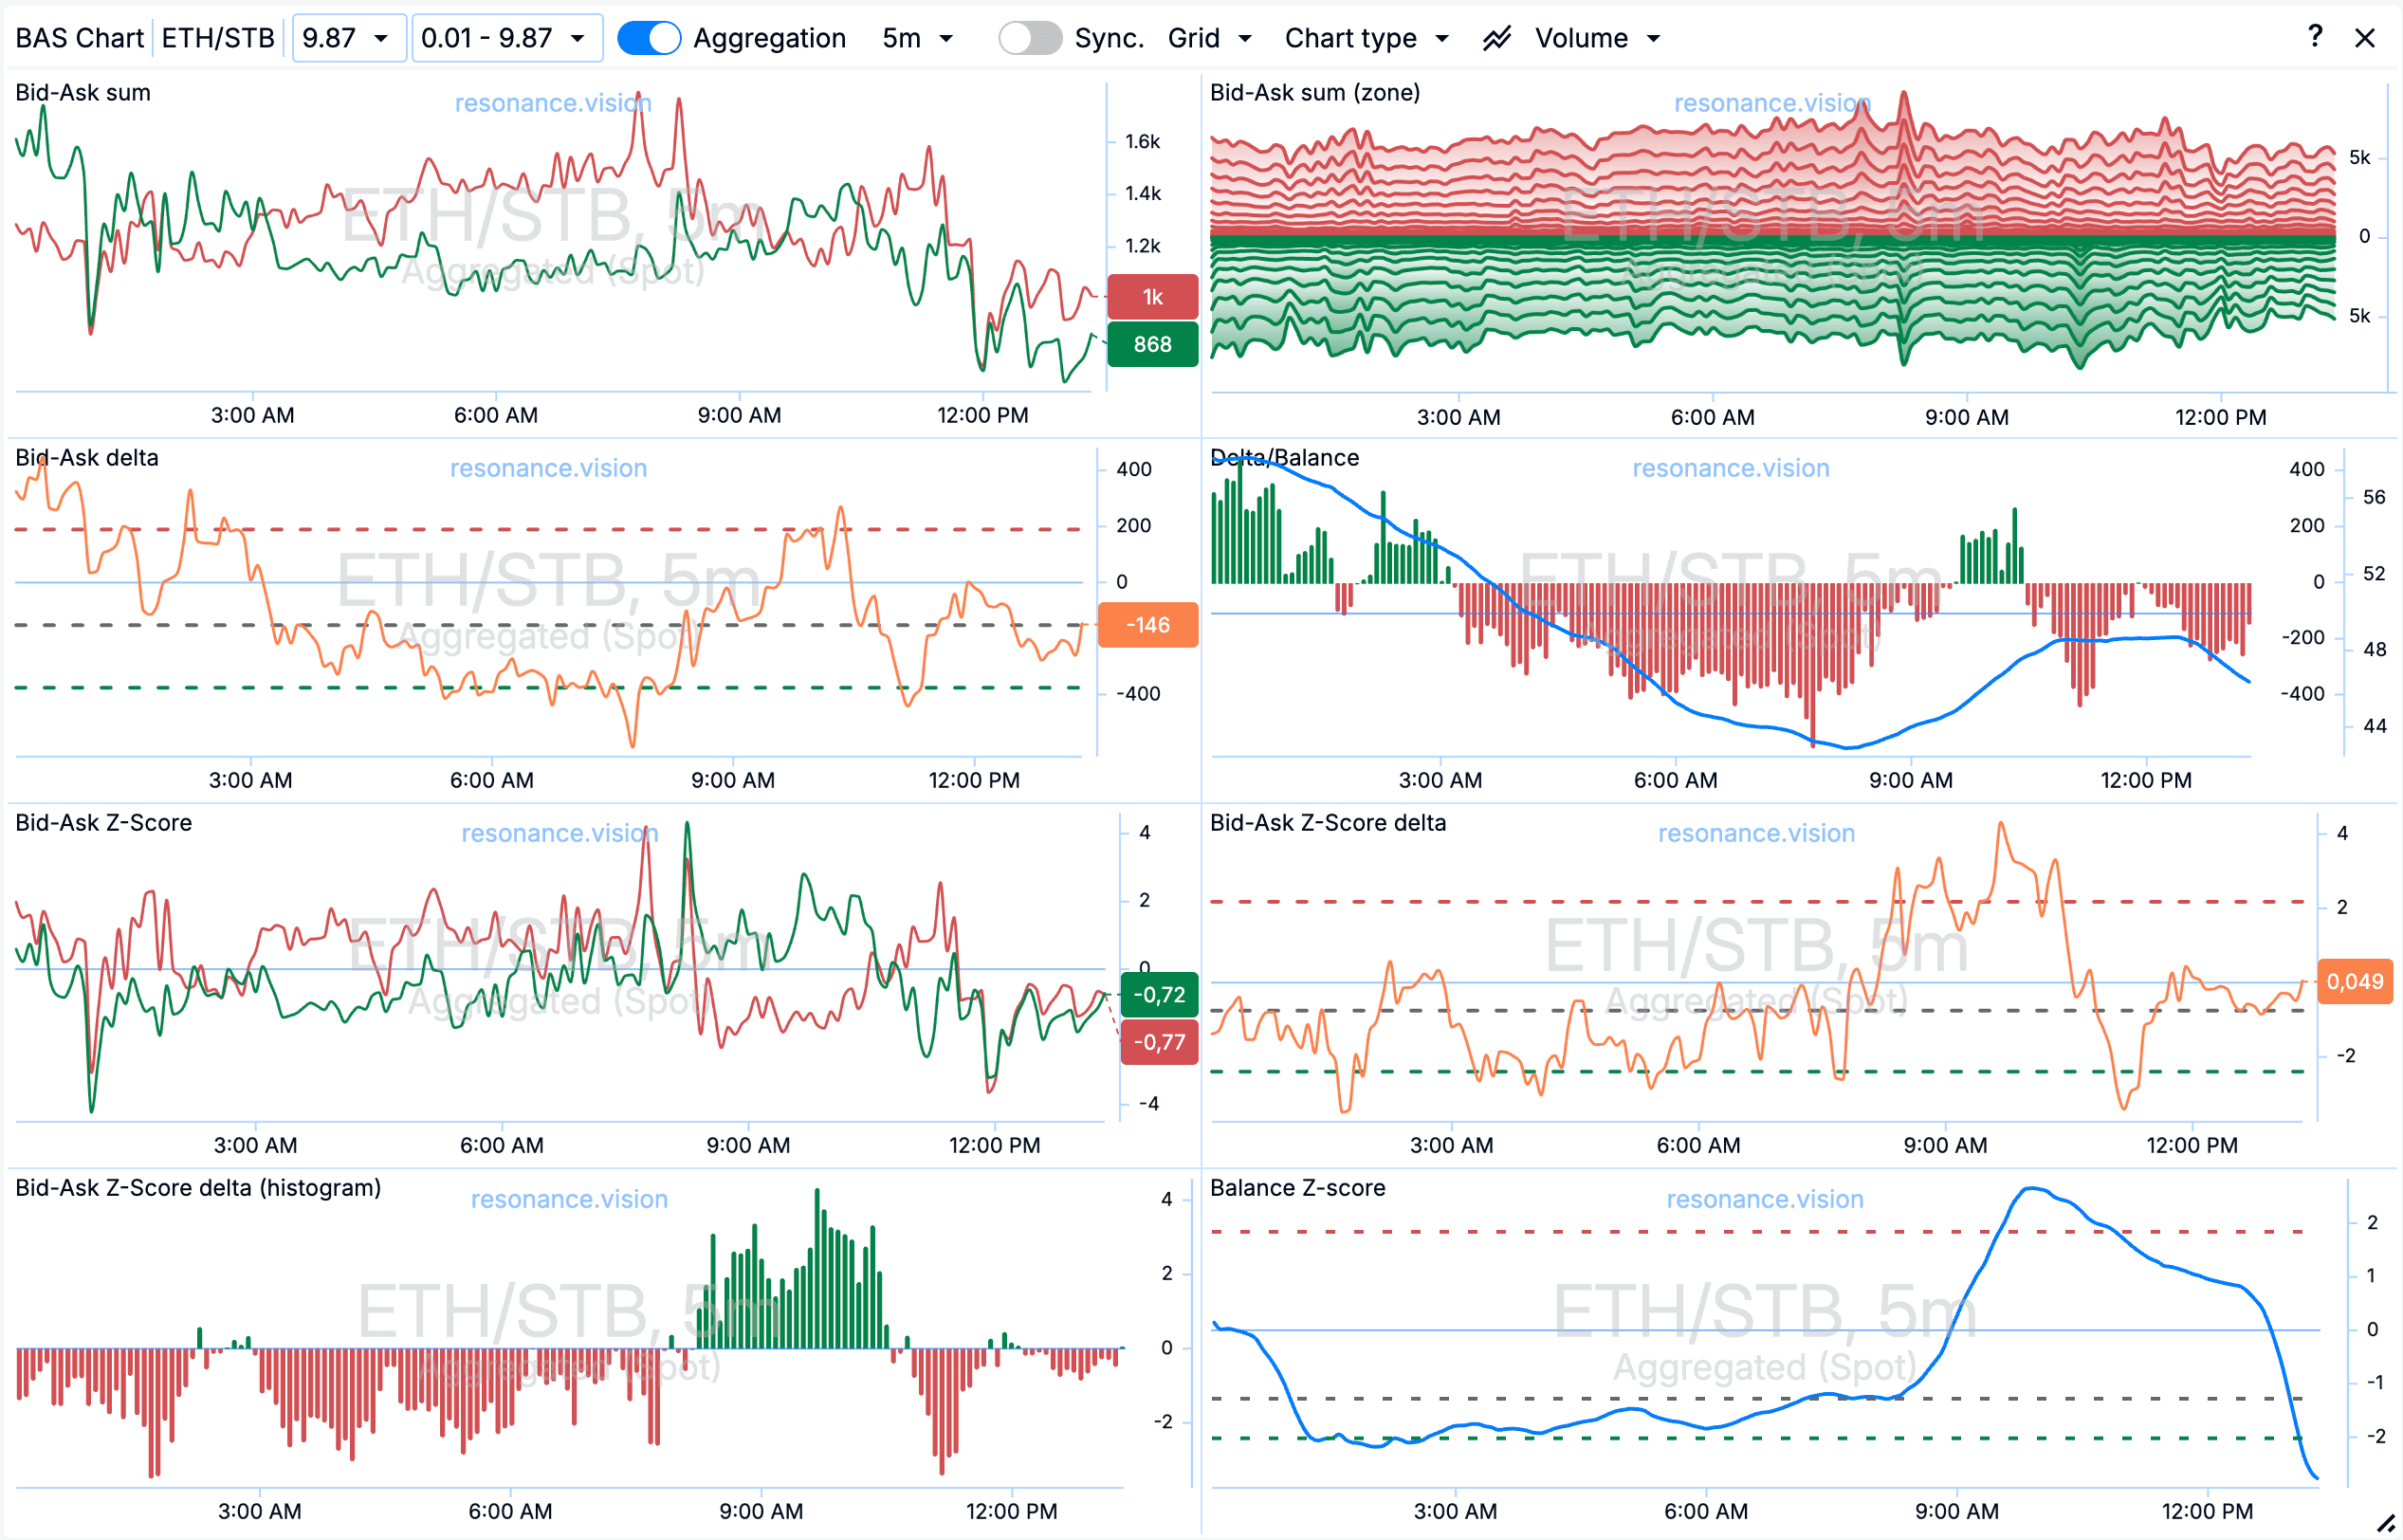
Search algorithms for finding deals
There are thousands of coins on the market, but the one who can quickly find and correctly evaluate coins with a surplus or deficit earns money. For this purpose, Resonance has a special collection of search tools:
BAS - search for imbalance between limit buy and sell orders. It shows how orders change in the order book.
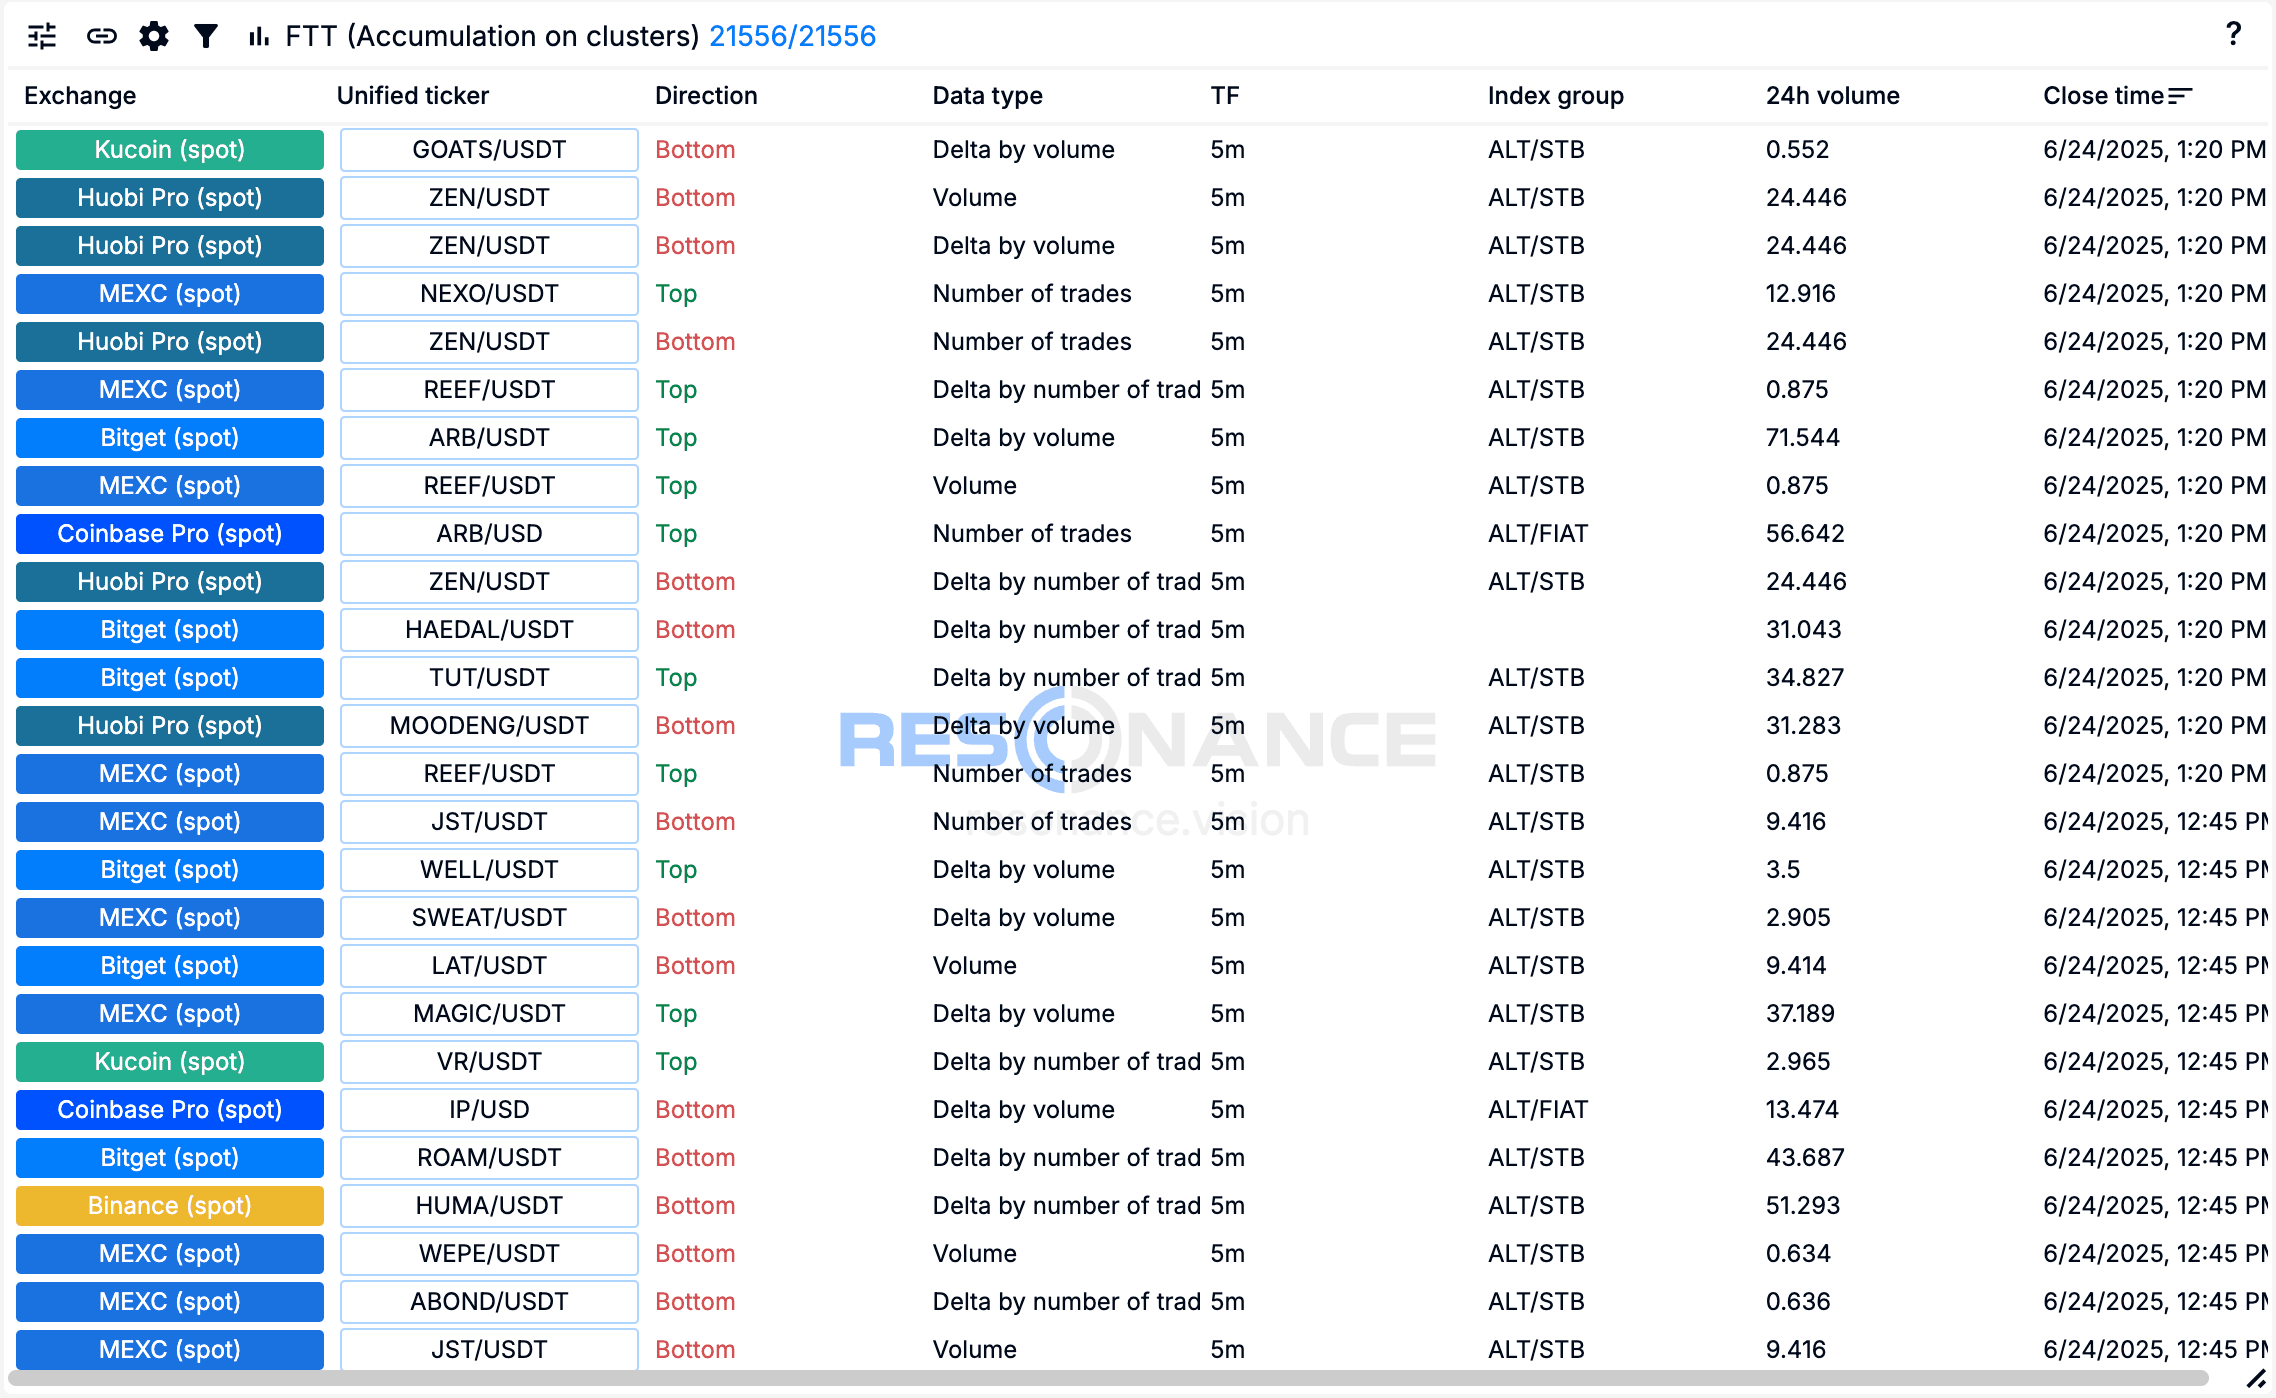
FTT - finds large volume clusters (accumulations) on a cryptocurrency’s cluster chart.
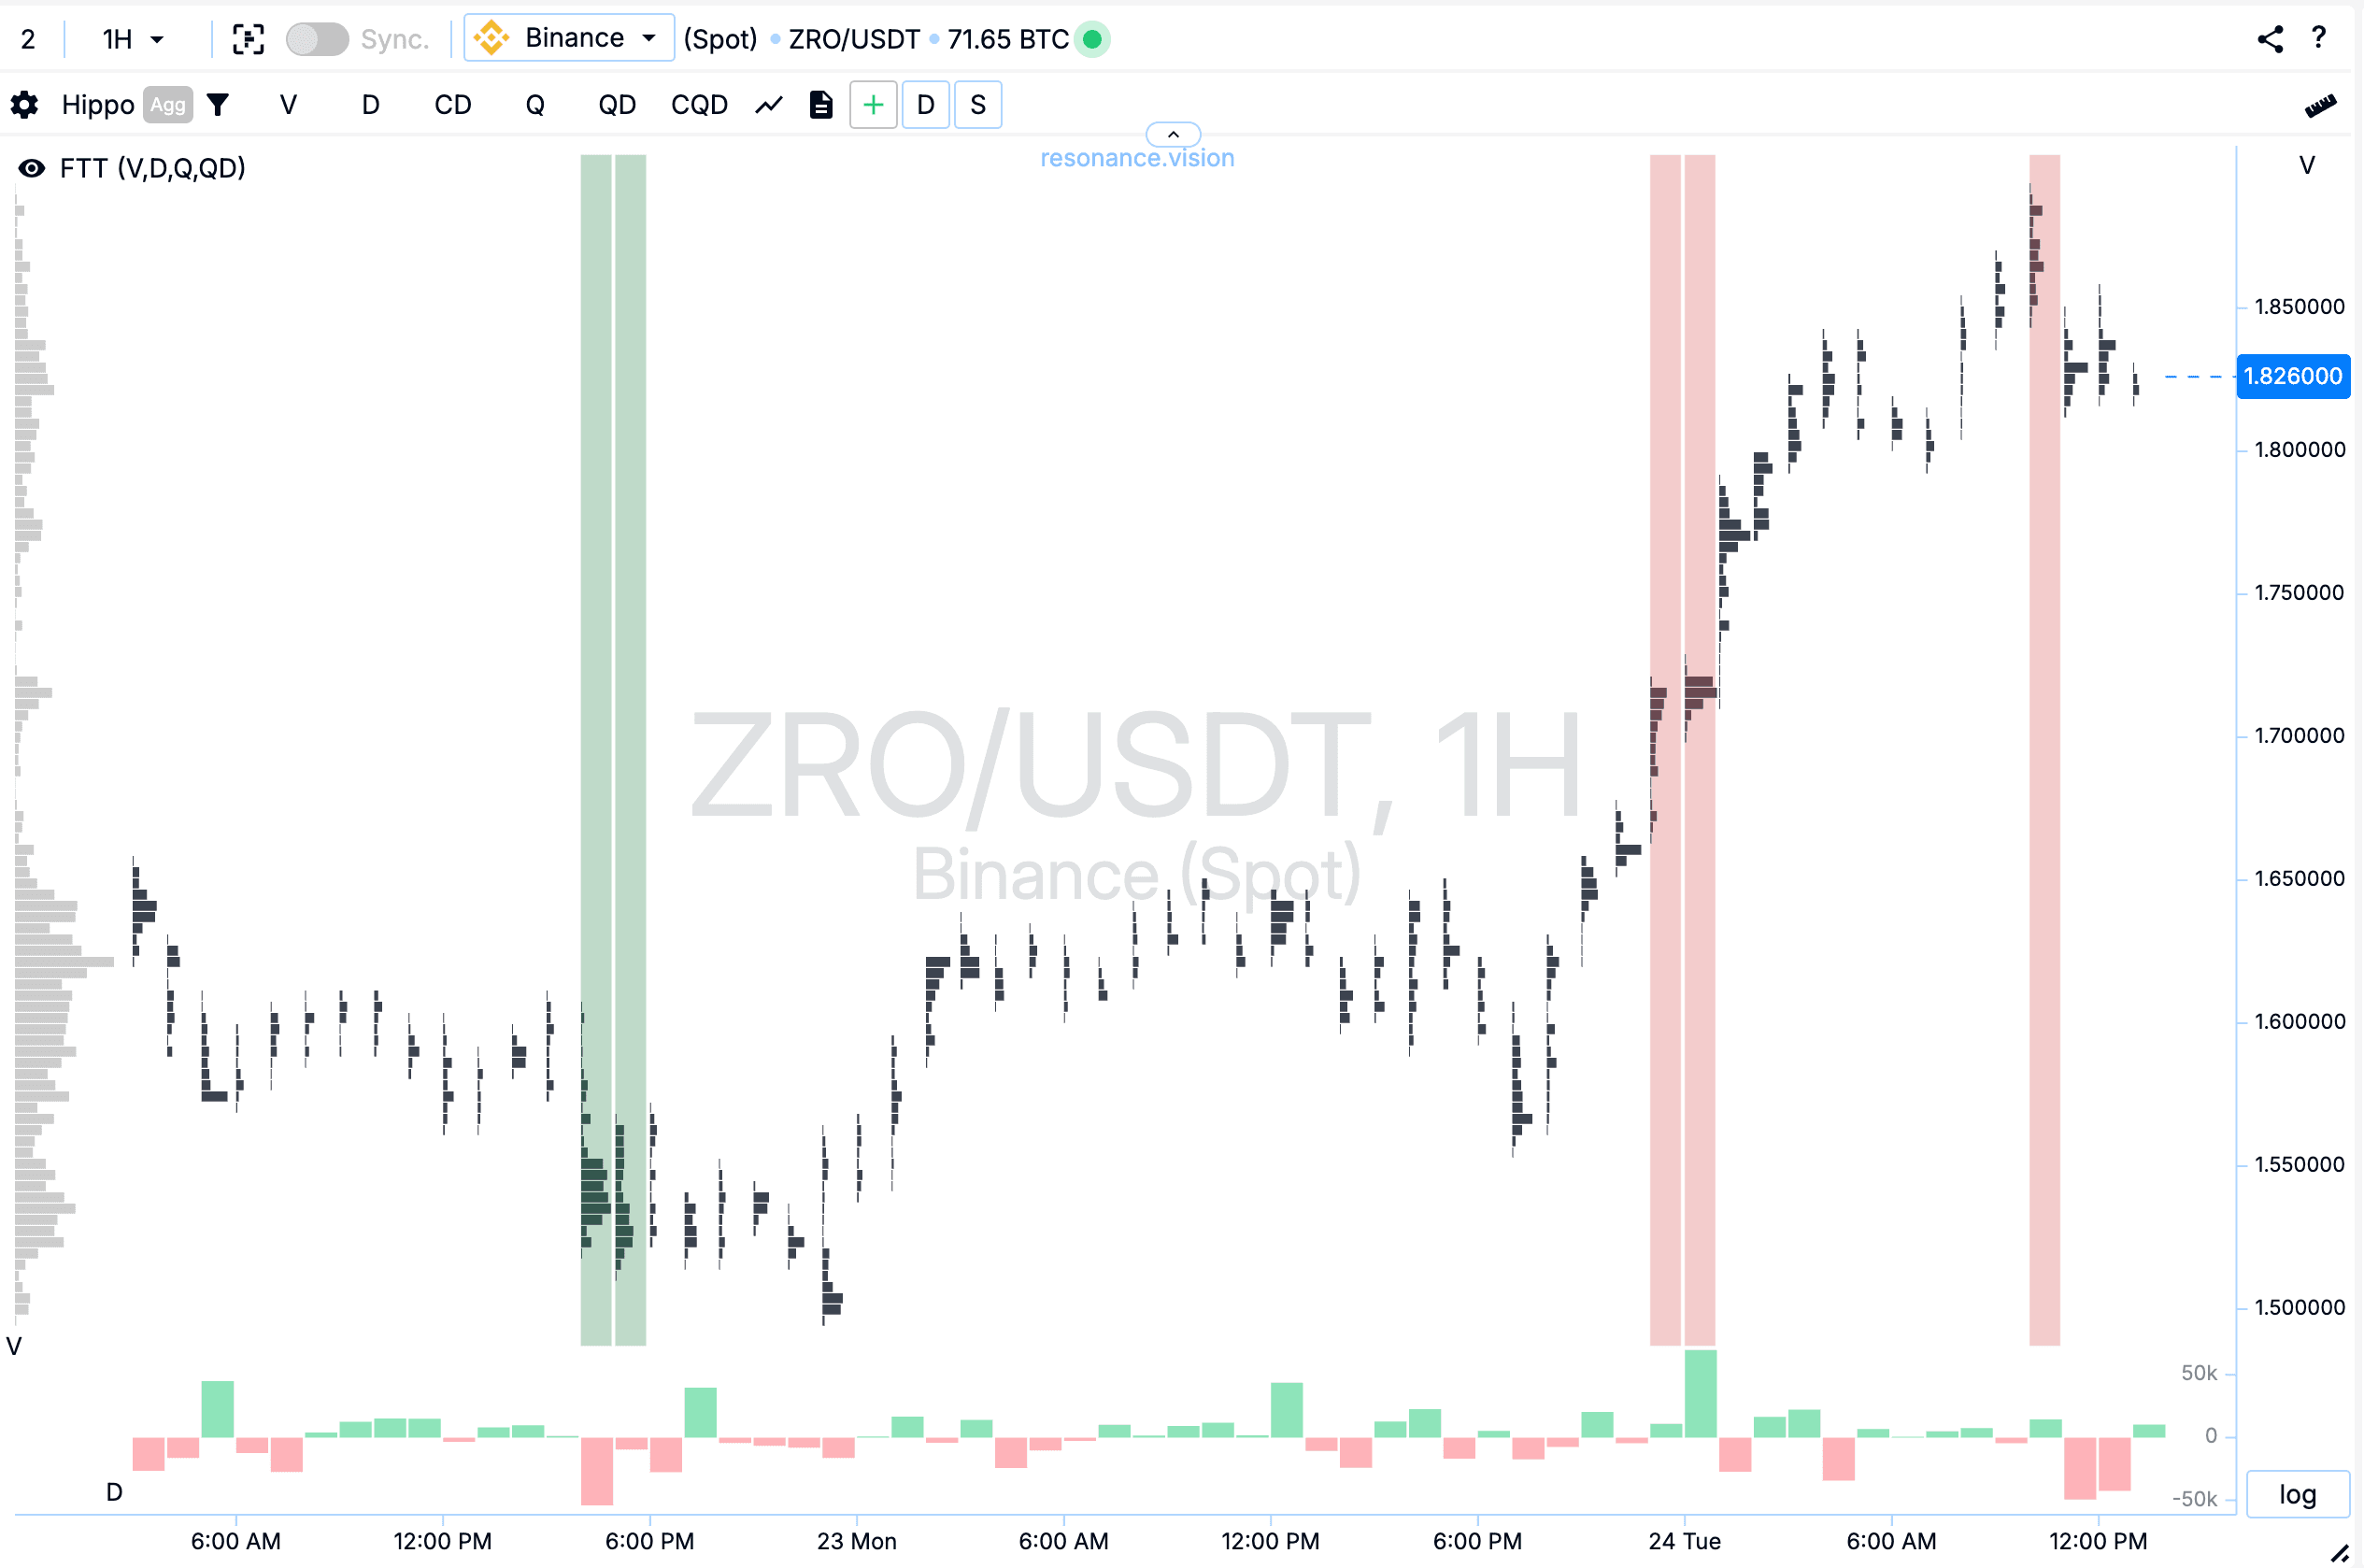
Hippo - detects large limit orders or their clusters and visualises data on limit orders as a heat map on the cluster chart.
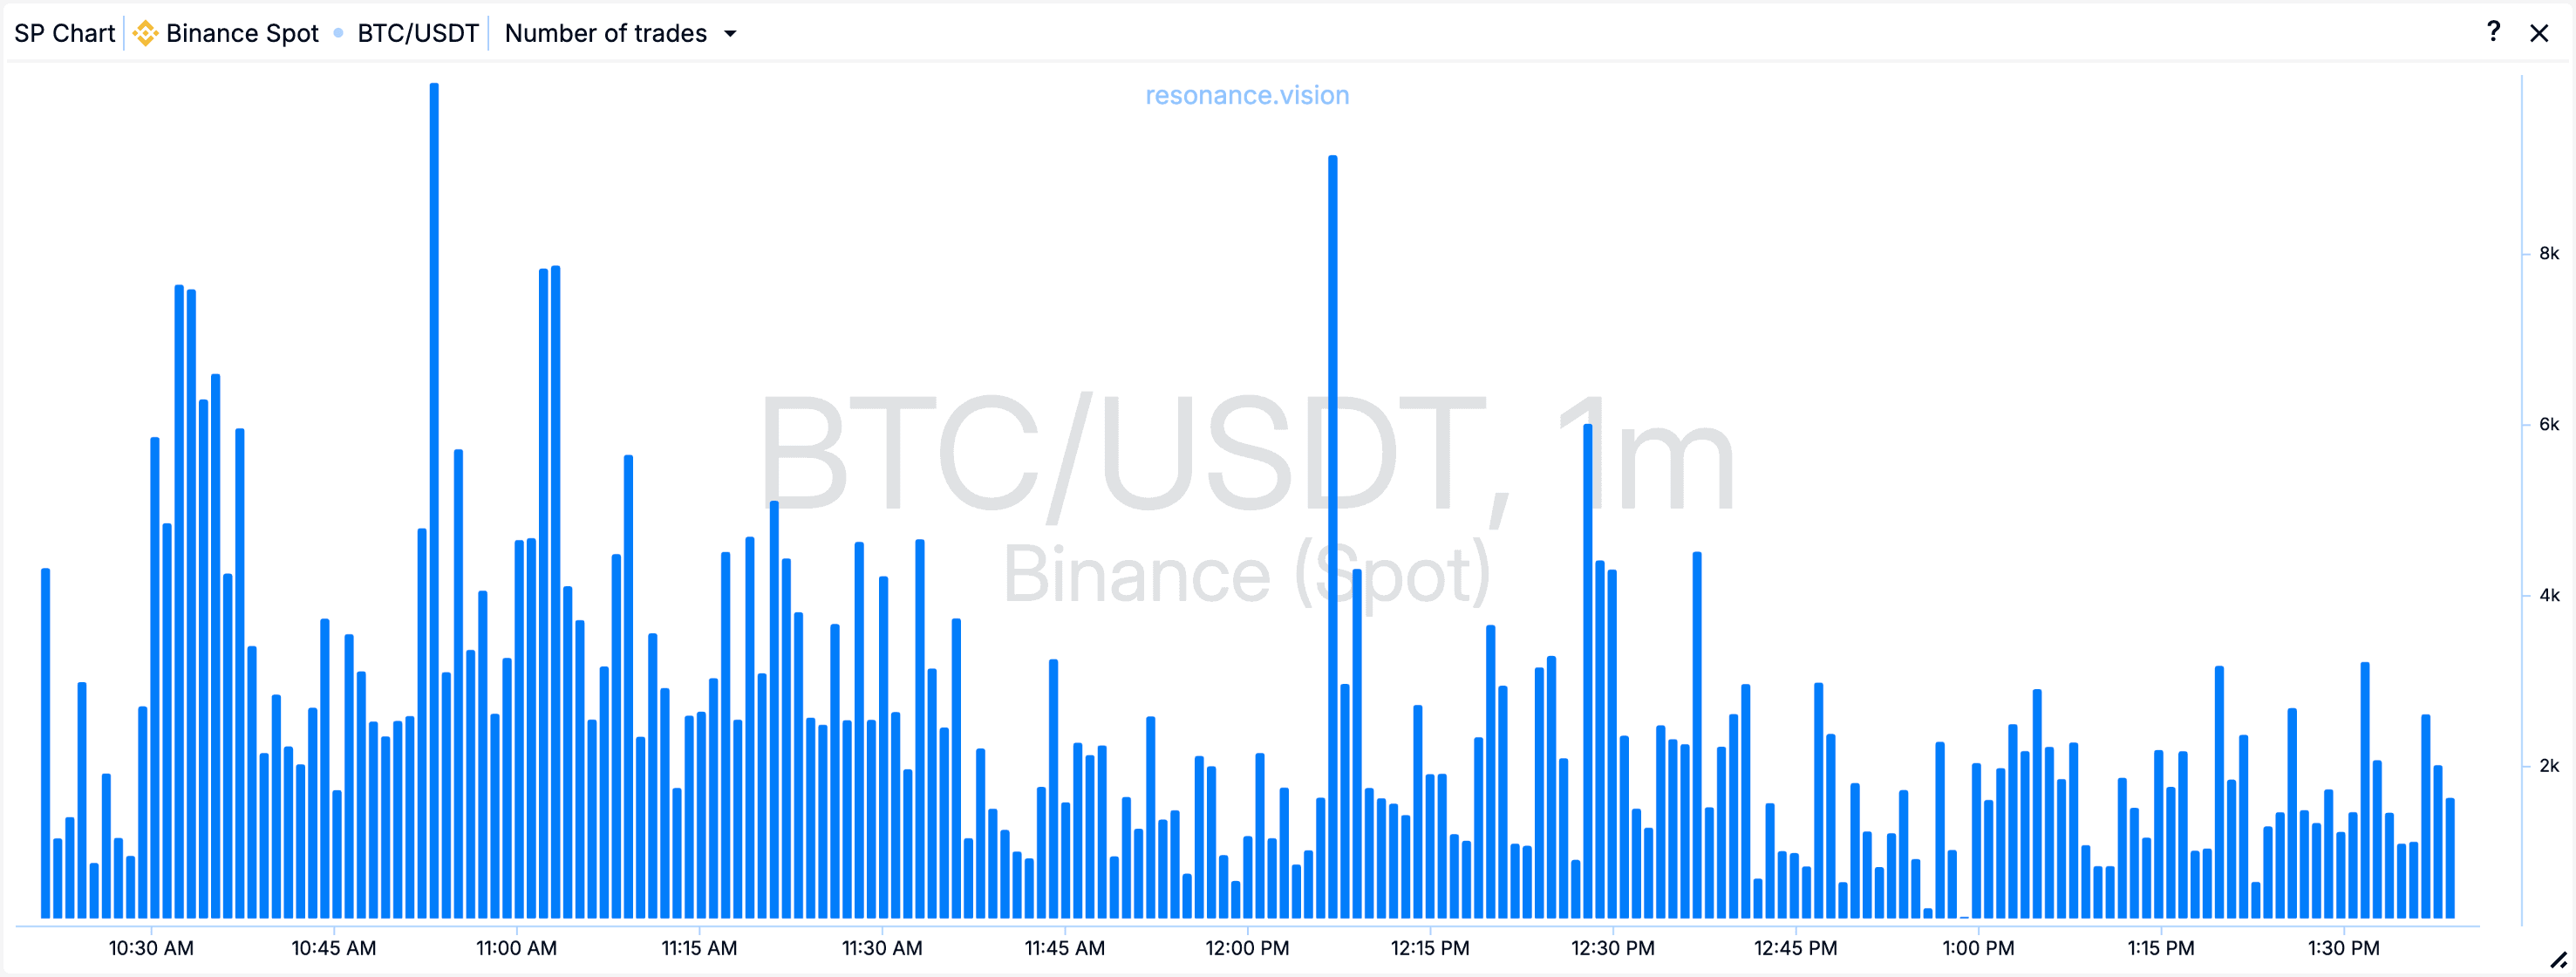
Speed Print - analyses abnormal market activity, including algorithmic actions of major players.
These tools are the basis for finding trading ideas for investment, guiding trading strategies and scalping cryptocurrencies.
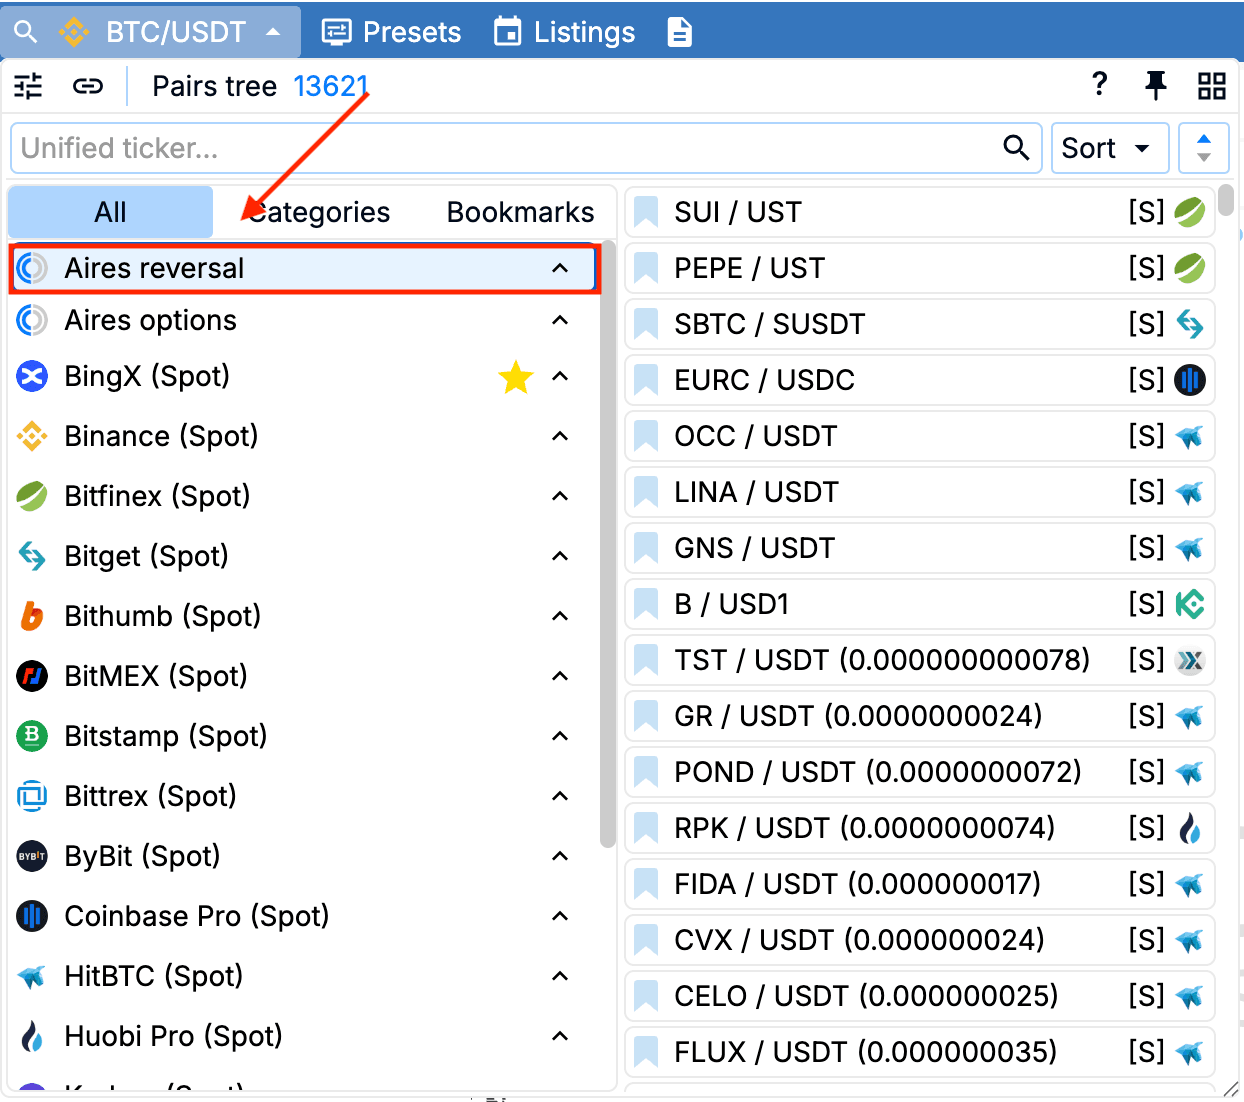
Pairs Tree
This is a convenient navigation through all trading pairs from dozens of exchanges (futures and spot). You can start your first crypto trading for beginners right here - by sorting and analysing cryptocurrencies based on the basic principles of market mechanics.
Sorting options are available:
- by volume,
- by number of trades,
- by delta,
- or simply in alphabetical order.
In addition, the pairs tree contains ready-made trading solutions:
- Aires Reversal signals - coins with signs of potential reversal for cryptocurrency scalping.
- Option signals - points of expected changes in BTC volatility.
They help you spend less time searching for interesting market situations and provide guidance on trade targets and execution.
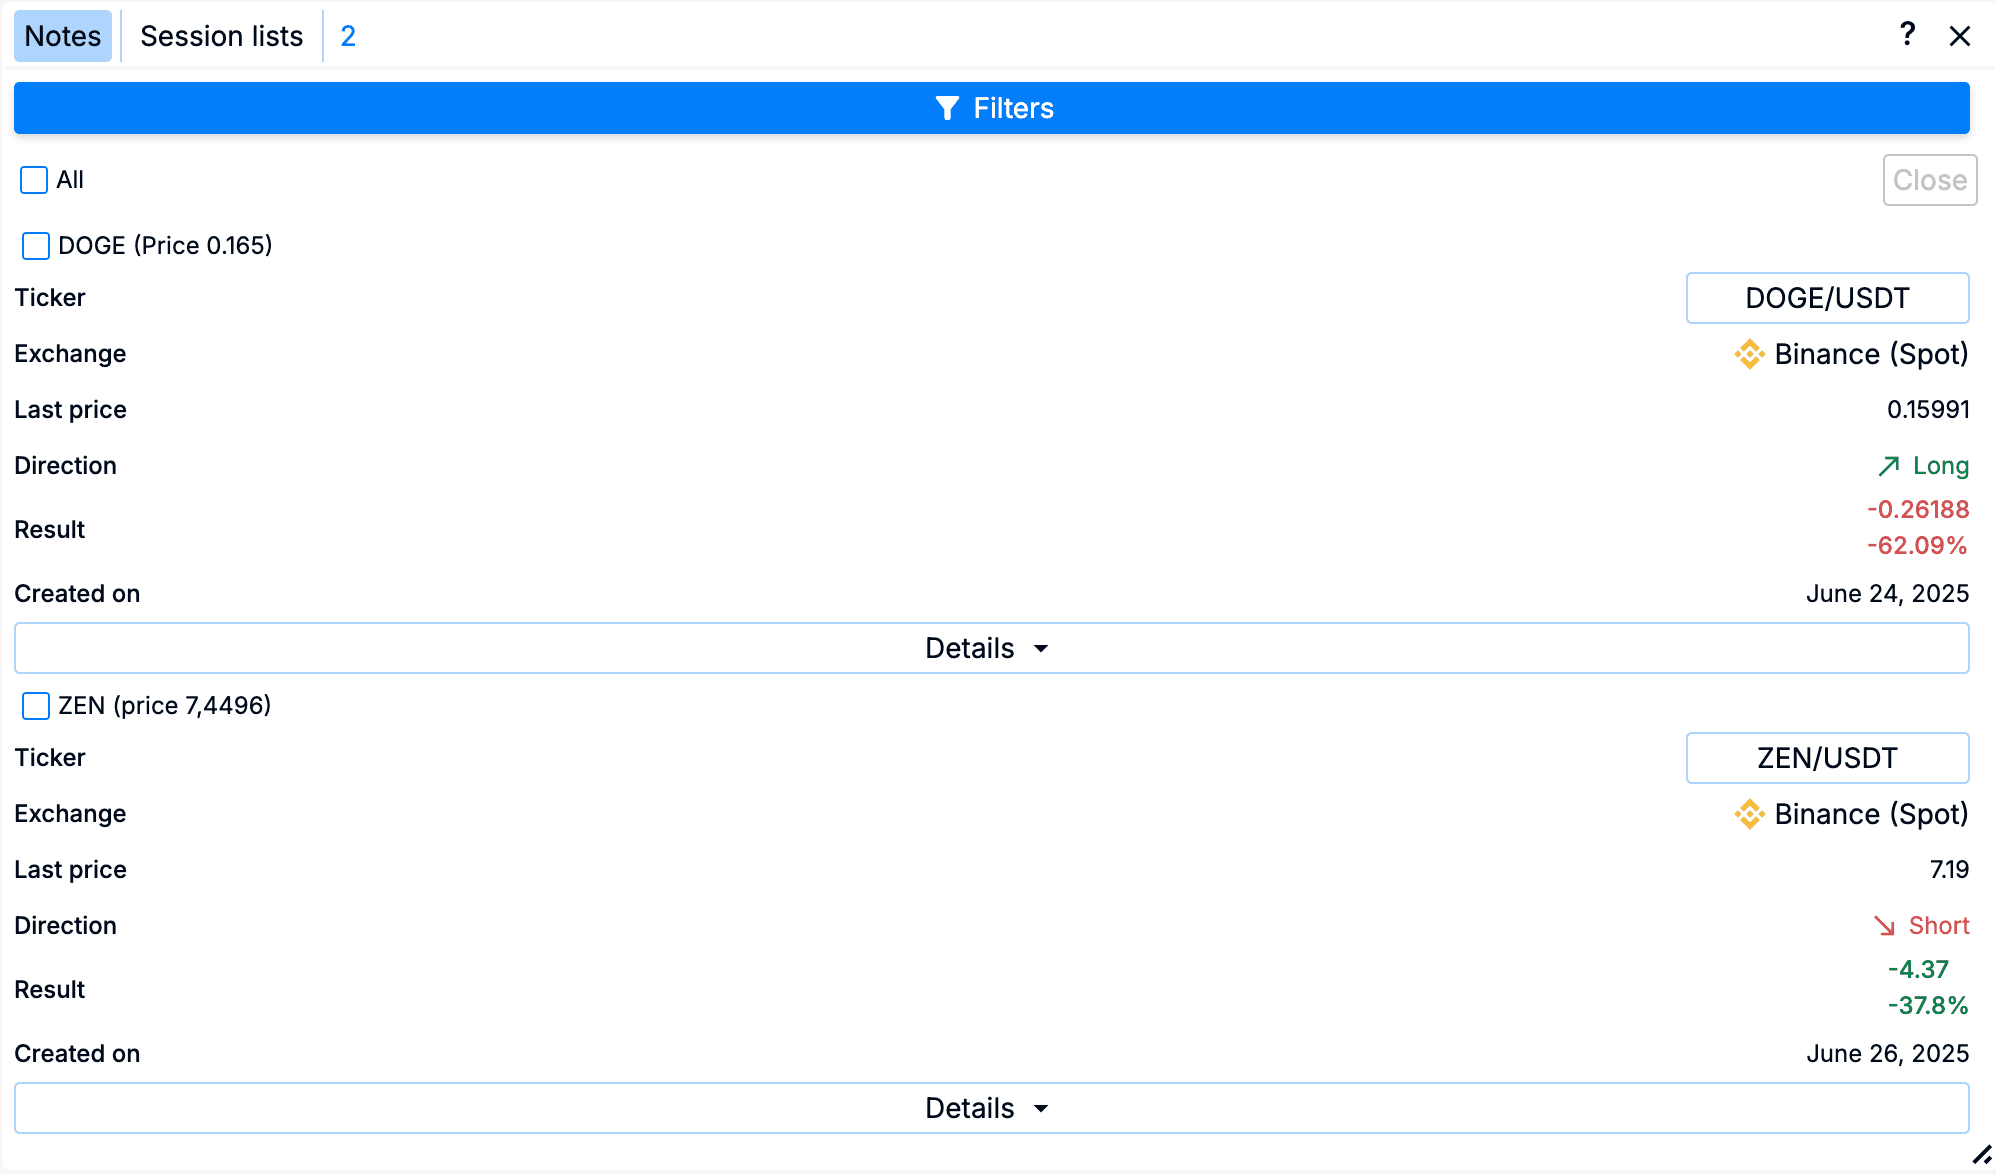
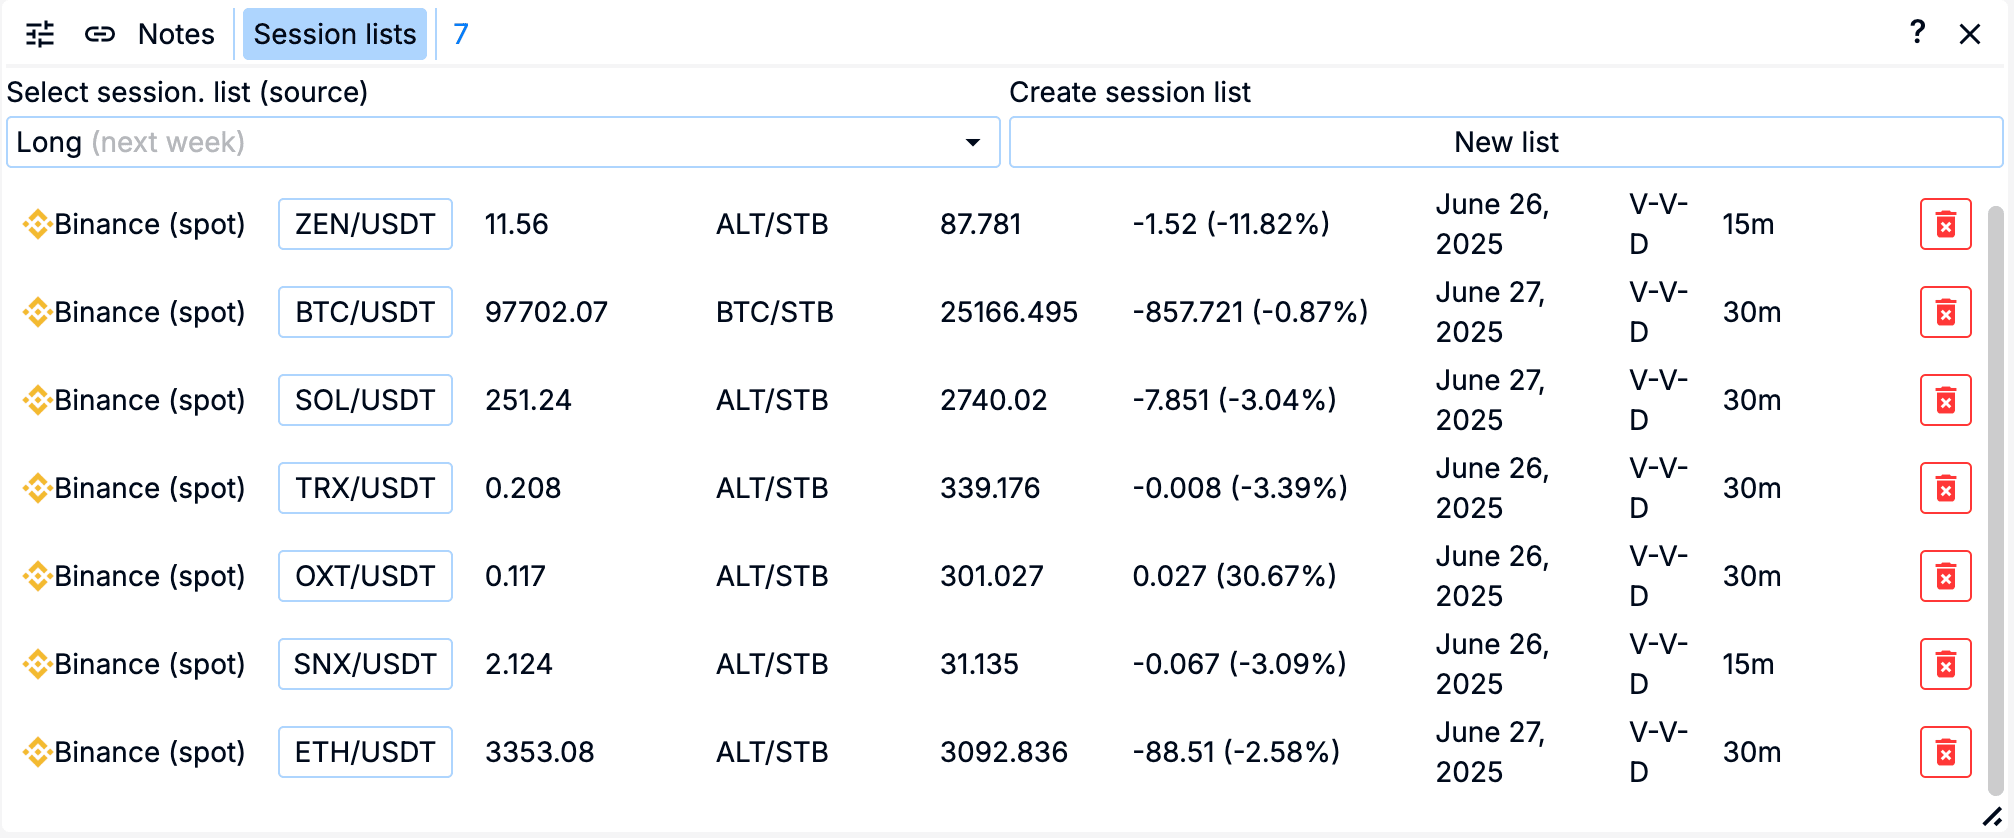
Session List and Notes
These tools are designed specifically for quick access to important assets and easy real-time market tracking.
They allow you to keep your coins in focus, switch between them without delay, and keep personal notes for effective decision-making.
Conclusion
RTT is an analytical interface that helps to understand the logic of the market, analyse the behaviour of participants, find entry points with an advantage, and make money on crypto based not on intuition but on market mechanics and supply and demand.
If you want to properly analyse cryptocurrency charts, read an order book, and make money on crypto, then Resonance’s RTT is the right tool to start with.
Don’t complicate things. Just use the power of the Resonance platform and trade with an advantage.
Follow new insights in our telegram channel.
No need to invent complex schemes and look for the "grail". Use the Resonance platform tools.
Register via the link — get a bonus and start earning:
OKX | BingX | KuCoin.
Promo code TOPBLOG gives you a 10% discount on any Resonance tariff plan.
Recommended articles


