FTT – Tool for Finding Reversal Accumulation Zones

Get acquainted with the FTT search algorithm - an indispensable assistant for crypto traders. It finds reversal accumulations of volumes at extremes, visualises data in tables and charts, helps to analyse the market faster and more accurately. The FTT index, which shows the general market sentiment, is also discussed and examples of using the tool in a screener are given.
Table of contents

An indispensable assistant of a trader on the crypto market
In a huge flow of market data, it is easy to miss important information. In order not to miss important details. A trader needs his personal detective, who will quickly find significant clues and help to make the right decisions. The FTT search algorithm acts as such a detective on the cryptocurrency market. It methodically scans the market and identifies accumulations of abnormal volumes at extremes. In fact, FTT finds and highlights the ‘footprints’ of major players - accumulation zones - at local lows and highs, allowing traders to act based on reliable data. This in turn makes trading more profitable.
The FTT is so useful that at certain moments a trader may perceive it as a grail. But it is important to remember: even the best tool is only effective when used correctly. A hammer is perfect when hammering nails, and absolutely useless if you need to tighten a nut. Therefore, study FTT carefully to understand its capabilities and use it in trading strictly for its intended purpose.
The essence of the tool and FTT settings
FTT (abbreviation for Full Tail Turn) is a tool that quickly and efficiently identifies reversal accumulations throughout the market.
A reversal accumulation (or reversal formation) is an accumulation of volume at an extremum (top or bottom of a bar).
Extreme is the point of maximum or minimum price for the selected period. If the price was rising, the extremum is formed at the top, if it was falling - at the bottom.
Important! The FTT algorithm does not search for just accumulations, but only those in which market participants were unable to push the price further with high volume concentration. Such accumulations become the most promising points for price reversal and formation of profitable trading situations.
All detected accumulations, which meet the search conditions, get into the table, which is updated every five minutes. Each anomaly is a signal to pay attention to the coin.
In the table settings you can add or hide the columns that will be displayed in the table:
- Exchange
- Uniform ticker
- Direction (location where the accumulation was found: bottom or top)
- Data type
- Timeframe
- Index group
- Daily volume (in BTC)
The data in the table can be filtered using the Filter button. For numerical indicators there are filters ‘From’ and ‘To’.
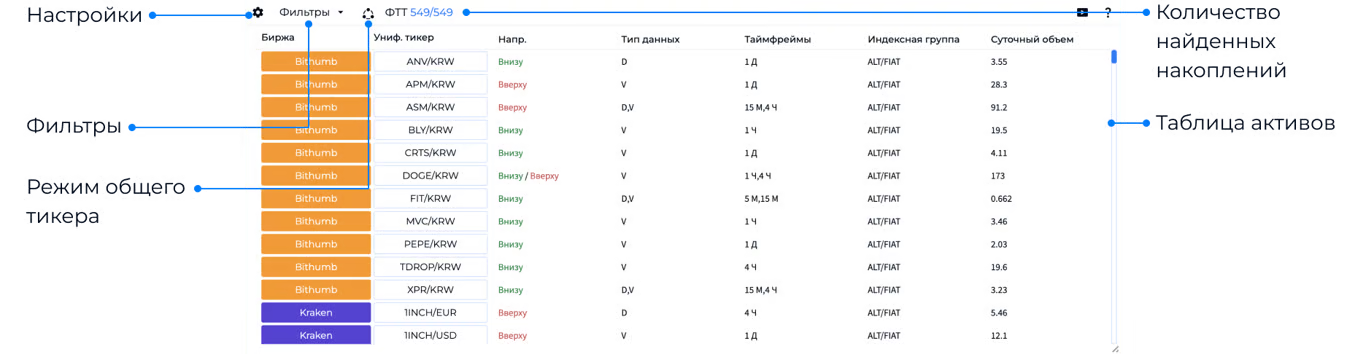
The ‘Volume from’ filter allows you to quickly cut off coins with insignificant liquidity, and the ‘Direction’ switch instantly divides the list into assets with potential shorting or longing accumulations at extremes.
To evaluate the situation on the cluster chart in detail, you need to click on the coin name in the ‘Unif. ticker’ column. The chart of the selected ticker will be loaded at once, where coloured lines marking bars with reversal accumulations will appear. Meaning:
- Red line - accumulation at the top of the bar (possible short)
- Green line - accumulation at the bottom of the bar (possible long).
Thus, FTT allows a trader to quickly find promising coins and trade entry points by finding anomalies at extremes.
But it is important to remember that the FTT algorithm is not a signal to open a trade, but an auxiliary tool that saves the trader’s time. Any accumulation found using a search engine requires additional analysis as part of your strategy.
If you don’t have your own strategy yet, you can take a mini-training from Ayres, in which you will understand the basics of a directional strategy for trading in the cryptocurrency market in just 6 steps.

FTT Index - a quick assessment of the entire cryptocurrency market
The FTT Index - allows you to instantly assess the mood of the overall market. It collects accumulation data from all coins and visualises it with histograms.
- A red histogram shows that many assets have formed volume accumulations on top of the bars. This means that sellers are actively restraining price growth with limit orders. This can be a clue for a trader that now it is better to look at shorts or treat longs with caution.
- A green histogram, on the other hand, indicates that accumulations are appearing at the bottom of the bars throughout the market. This is a sign that buyers are taking the initiative, placing limit orders and keeping prices from further declines. In such situations, it makes sense to look for long trades.
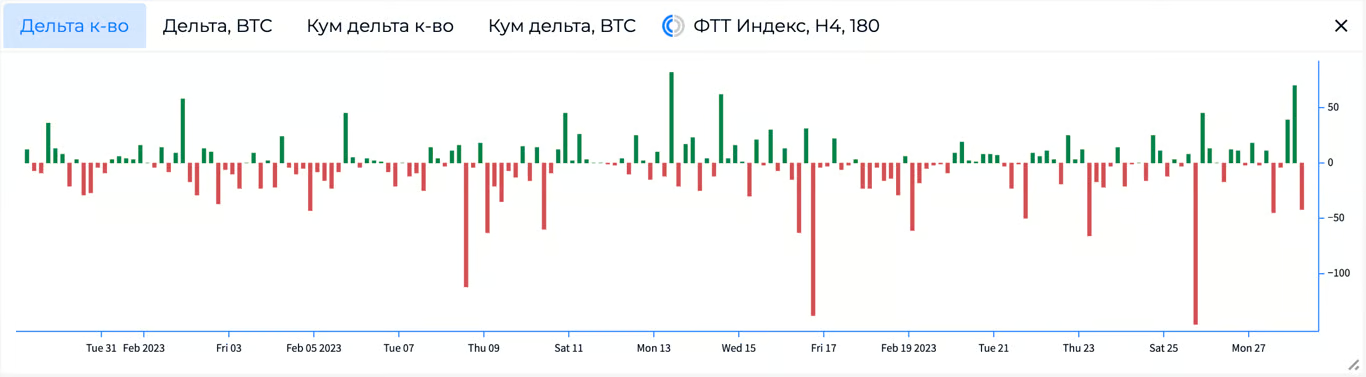
The advantage of the FTT Index is that a trader does not waste time analysing many separate charts, but sees the big picture at a glance. One glance and you understand who is dominating the market and in which direction you should direct your attention.
Tool application
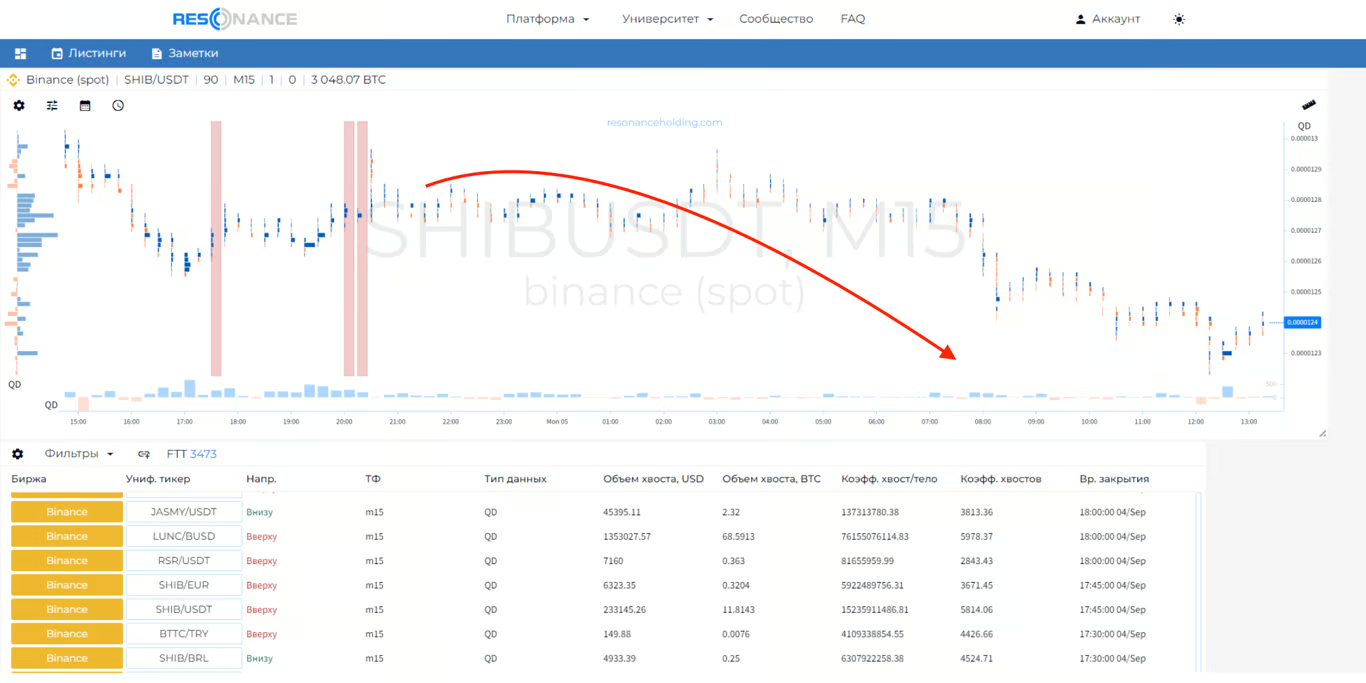
Let’s break down an example of a tool application. Below on the chart you can see that FTT three times said that a cluster of volumes was forming on top of the cluster bars, and the price was not allowed to go further. As a result, there was a drop in price.
Below is an example of the reverse situation where the FTT shows a cluster of orders at the bottom. This was followed by a rise in the price of the asset.
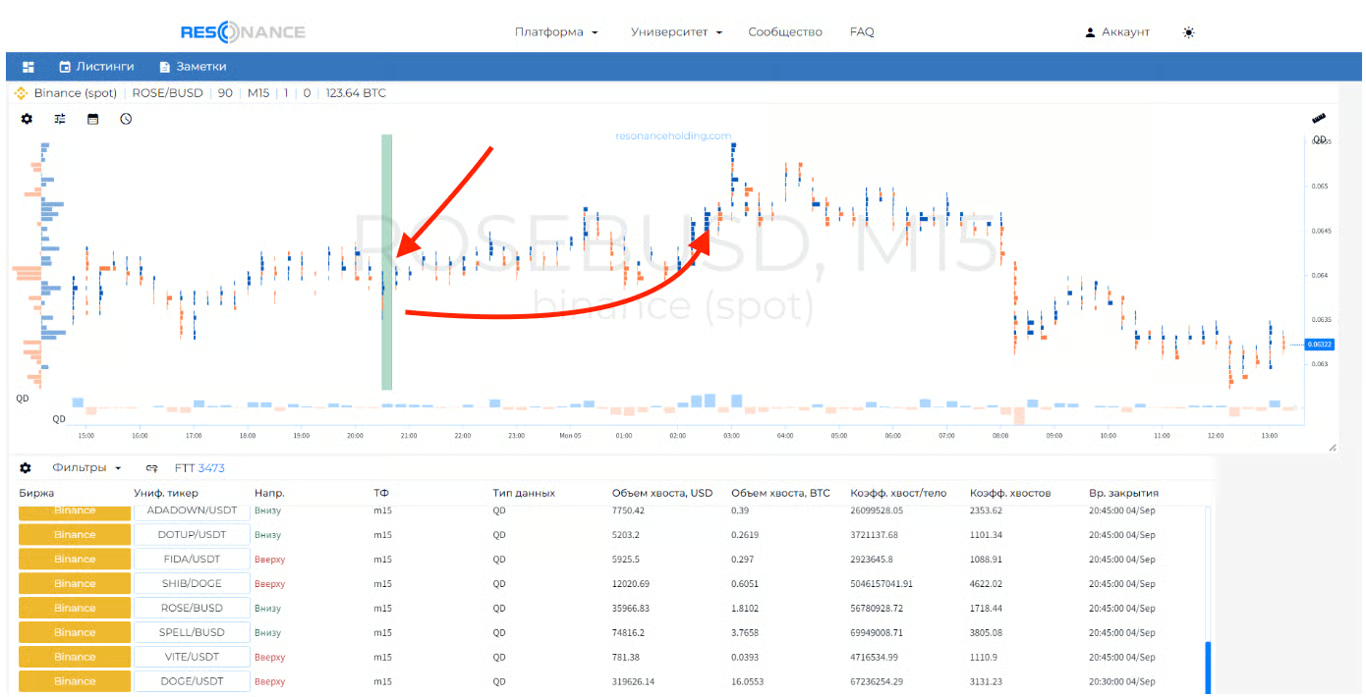
When the whole market starts to rise or fall, FTT becomes a powerful assistant in finding ideas for long or short positions.
How to use FTT in the Screener
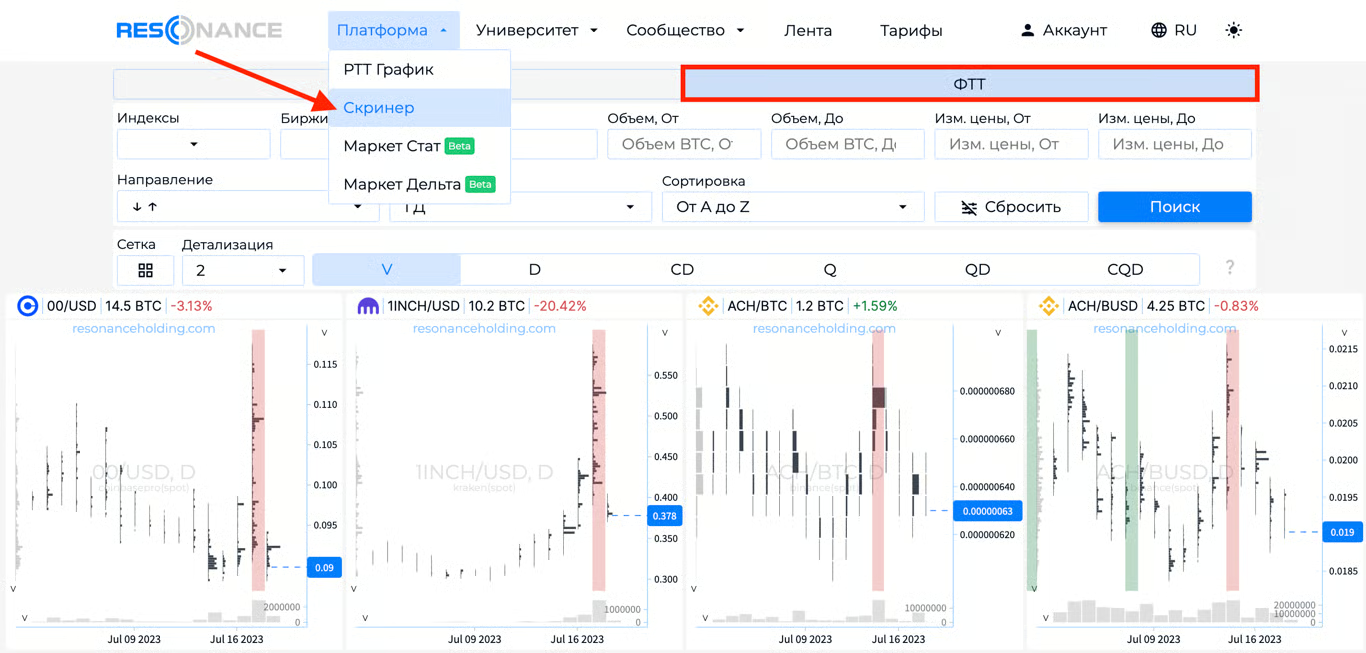
To view the ideas that FTT finds faster and more efficiently, we suggest using FTT inside the Screener. To do this, you need to go to the Platform - Screener - FTT tab.
Now let’s talk about the settings:
- Indices - selection of a group of tickers to be searched for
- Exchanges - select one or several exchanges to analyse
- Ticker - any ticker or pair
- Volume from - value of the volume from which the search will be performed
- Volume up to - volume value, up to which the search will be performed.
- Price change from - price change in % for 24 hours, from which the search will be performed.
- Price change up to - price change in % for 24 hours, up to which the search will be carried out.
- Direction - shows in which part of the bar the volume accumulation should be located.
- TF - timeframe on which the volume accumulation will take place.
- Sorting from A to Z - sorting assets alphabetically.
Let’s analyse examples of output by search. Set parameters: exchanges Binance and Bybit, timeframe - 1 hour, direction - accumulations from above.
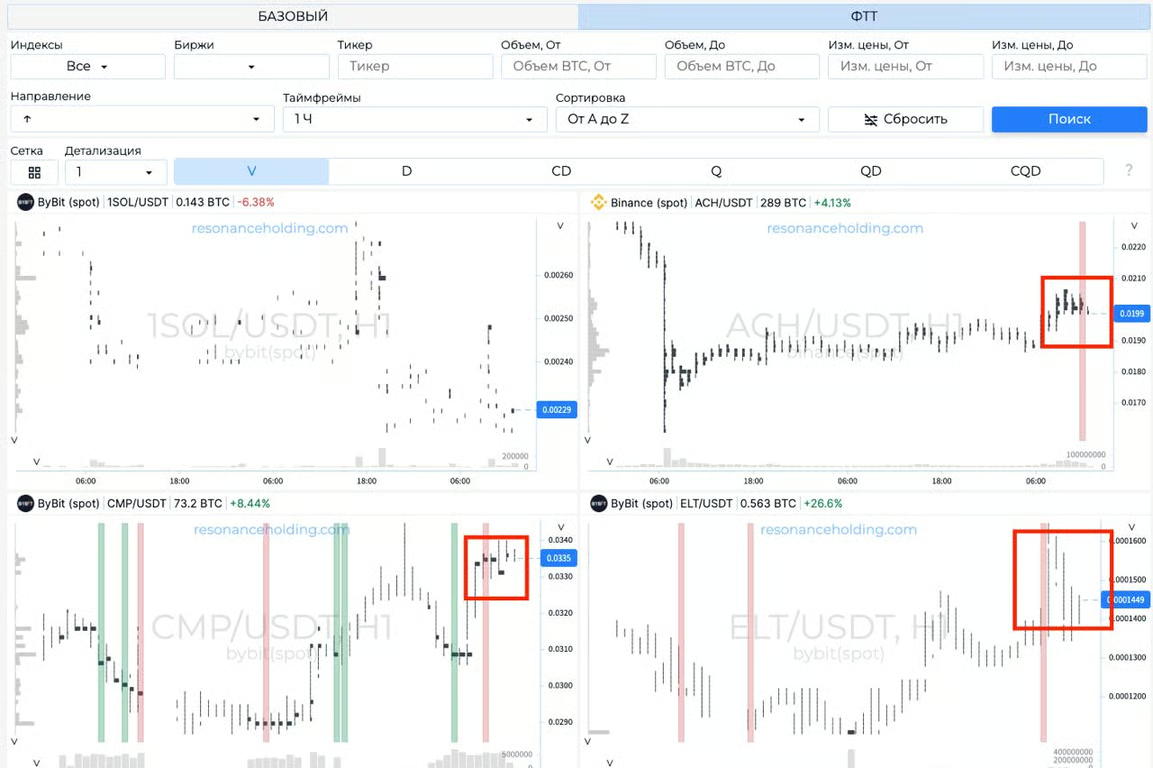
The ACH asset is immediately noticeable, where there is a clear accumulation of volumes on top. If the whole market is selling, this asset can be a good option for a trade.
Another example. Set parameters: ALT/STB index, OKEX and Huobi exchanges, timeframe - 15 minutes, direction - accumulations from below.
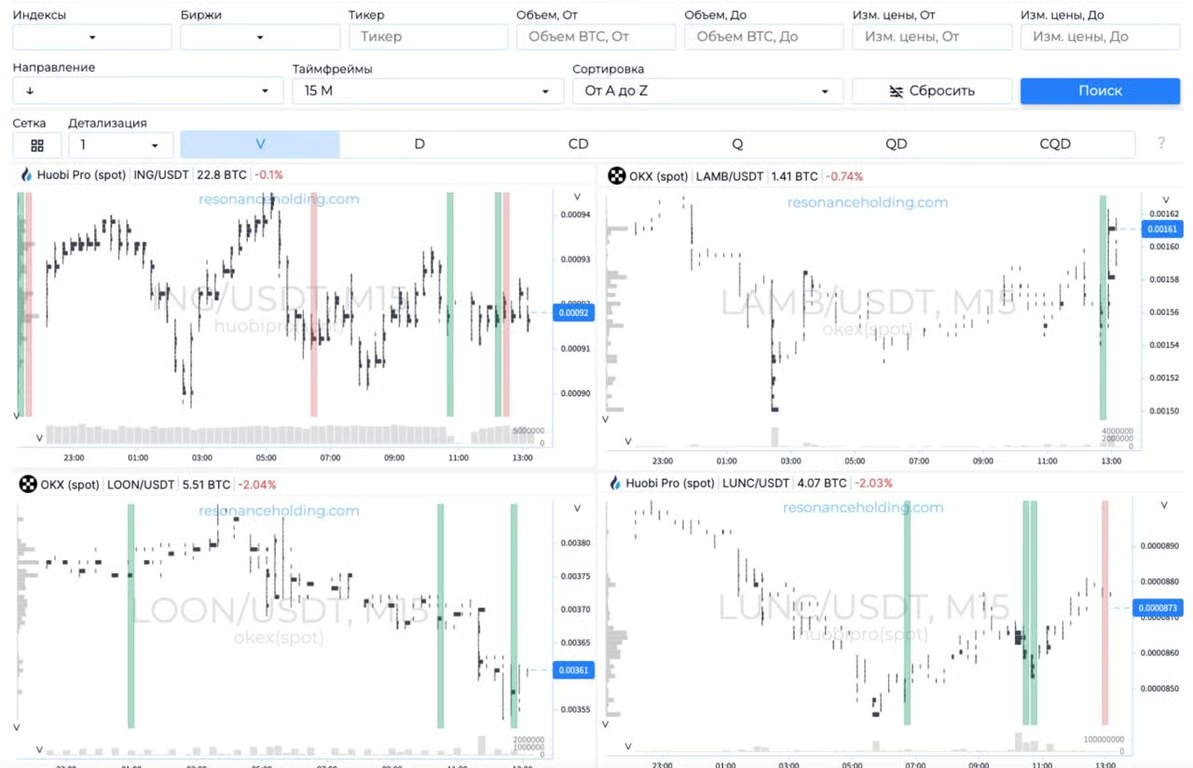
In this case, the asset LUNC/USDT stands out very strongly. Such coins are best to look out for in a rising market, and the bigger the accumulation of volumes from below - the better.
Thanks to the FTT in the Screener, you can quickly and efficiently select both long and short assets with different timeframes for the realisation of a trade idea.
The benefits that are forgotten
Cryptocurrency beckons with its volatility, but lurks the pitfalls of impulsive decisions. FTT saves hours by allowing you to quickly find coins with high potential. This saves time and allows you to focus more on other important aspects of trading. While others are switching from chart to chart and guessing what the next move will be, your price prediction is already confirmed by volumes.
FTT’s search algorithm for reversal formations does not just find anomalous accumulations, but gives valuable clues about the places where deficits and surpluses are formed. After all, each accumulation zone is not just a mark on a chart, but a place where an asset changes hands. It is important to correctly interpret the meaning of each search engine signal.
The cryptocurrency market never promises easy paths, but it is generous to those who know how to quickly find trading opportunities amidst the market noise. Use the search engine wisely, and each reversal pattern in trading will become not a random insight, but a logical addition to your trading system.
There’s no need to invent complicated schemes or look for the 'holy grail’. Use the tools on the Resonance platform.
Register via the link to get a bonus and start earning:
OKX | BingX | KuCoin.
Use promo code TOPBLOG to get 10% off any Resonance plan.
When the market moves fast and noise hides real signals, ftt trading becomes one of the best ways to cut through uncertainty. Instead of guessing or relying on weak price prediction, you work with clean, objective data — the actual behaviour of buyers and sellers at extremes. That is why ftt in crypto gives traders an edge: it turns chaos into structure and highlights where reversals are truly forming.
Used correctly, ftt trading is not a shortcut, but the foundation for a best volume-driven approach. A clear ftt trading strategy helps you filter noise, focus only on high-potential setups, and integrate every FTT signal into a broader, disciplined system. With the right tools, smart analysis, and a mindset built on facts — not hope — the crypto market becomes far more predictable. And that means more clarity, more control, and more opportunity in your crypto trading.
Recommended articles


