Rules for Building and Confirming Trend Lines

The final part of the series on trend lines — about how to build them correctly, confirm them, and test their validity. There are no “magic formulas” here — only logic, volume, and the behaviour of market participants. You’ll learn why two points don’t yet make a trend, how the rule of three touches works, and what genuine trend confirmation looks like. This piece will help you see the real actions of buyers and sellers behind the chart, distinguish true movement from market noise, and build your own understanding of trends without unnecessary indicators — guided purely by volume and market logic.
Table of contents

This piece continues the series “Trend Lines in Trading: How to Build and Use Them Properly”, which includes:
- Fundamental Understanding of Trends. What a trend is, how it forms, types according to Dow, and the law of market inertia.
- Who Really Drives the Trend. Supply and demand, scarcity and surplus, volumes, delta, and market phases.
- Rules for Building and Confirming Trend Lines. How lines are constructed, the rule of two and three points, and validation through volumes.
This is a sequential series, best read from start to finish: each part builds on the previous one, forming a comprehensive understanding of how trend lines reveal the true behaviour of the market.
Why Trend Lines Are Needed
Simply put, trend lines are a way to visualise where the market price is heading.
However, you shouldn’t see them as a magical indicator or a precise prediction of the future.
They don’t forecast — they illustrate how the market has behaved up to this point.
The “Rule of Two” and “Rule of Three” Points
Every trend line begins with two points.
Connecting two lows (for an uptrend) or two highs (for a downtrend) only gives you a potential trend — the line exists “in theory” until a third touch occurs.
When the price reacts to it for the third time, the trend is considered confirmed. This is known as the “rule of three points”: the third touch verifies that the movement is genuine.
• In an uptrend, the line runs through the lows.
• In a downtrend, it runs through the highs.
How a Trend Line Is Truly Confirmed
It’s important to understand that the strength of a trend isn’t defined by the number of points, but by how the volumes behave.
If you see that sales aren’t pushing the price to new lows, while purchases are driving it higher, that’s the real confirmation.
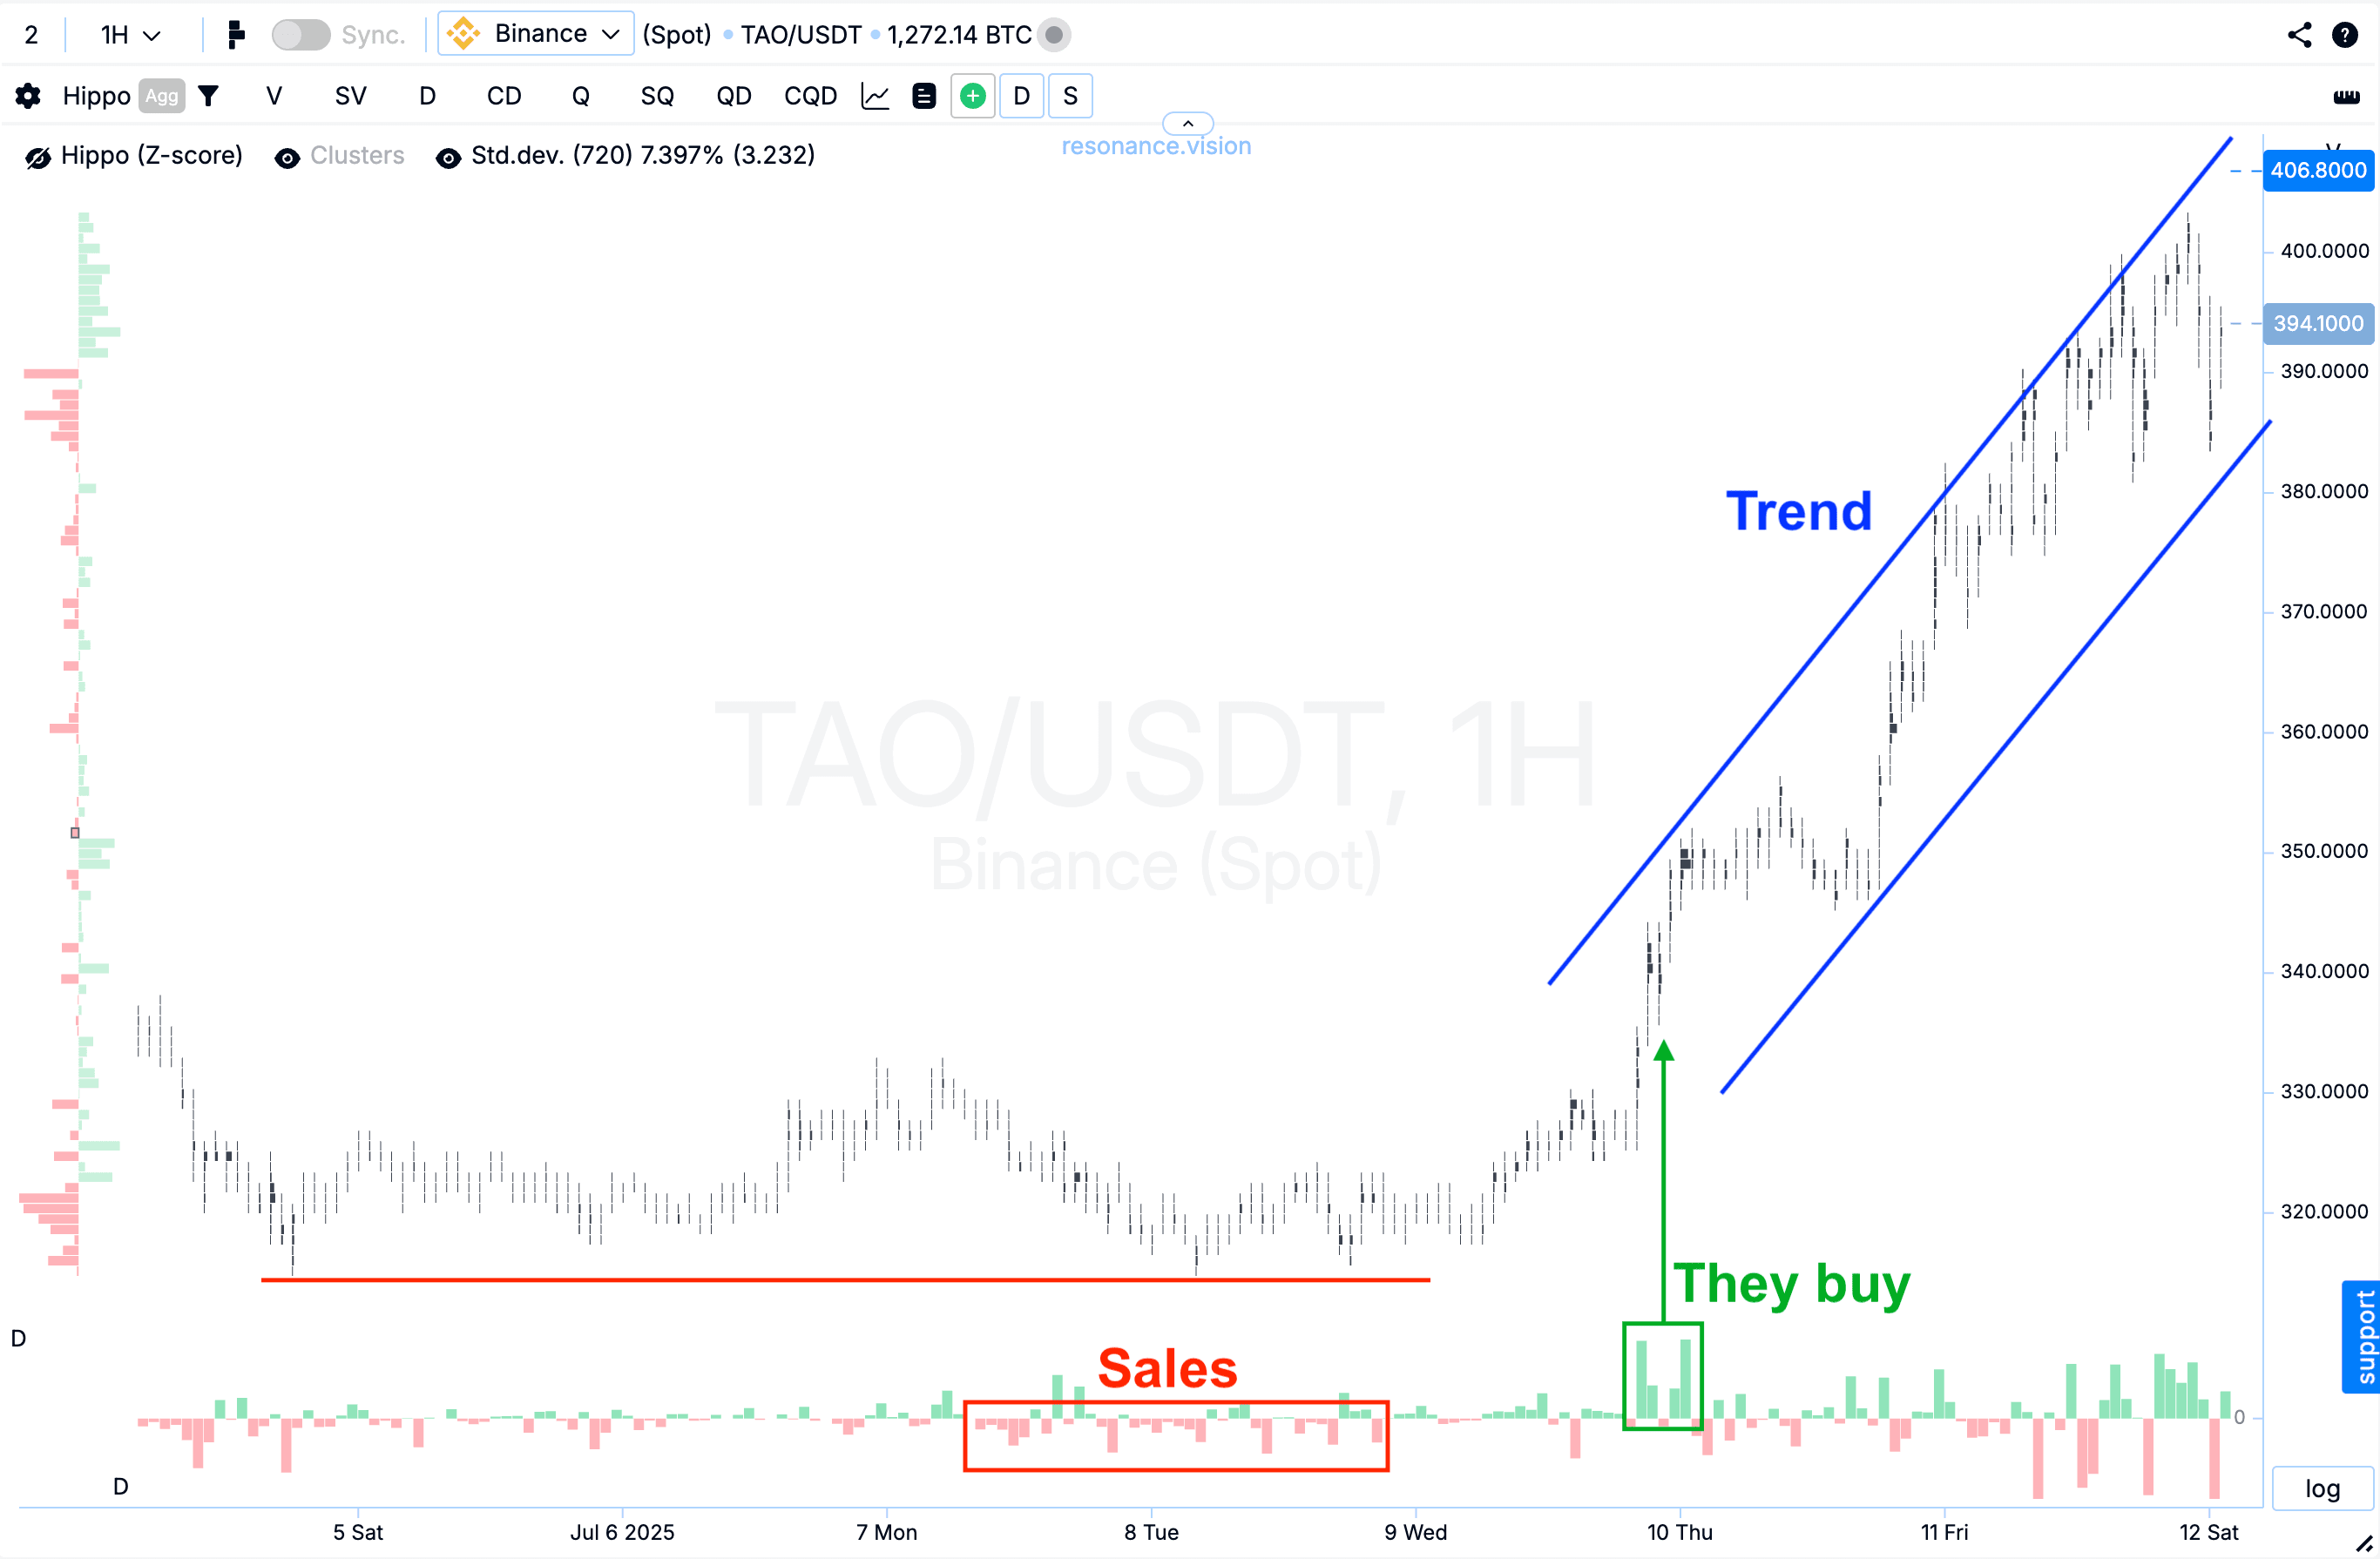
Trends are confirmed not by lines, but by supply and demand.
You can draw hundreds of lines, but only when volumes align in one direction does the movement make sense.
If the market is rising and the delta shows buyer activity, it’s a real trend.
If the market rises on unconsolidated (thin or scattered volumes), it’s merely a temporary move.
So, it doesn’t matter how many lines are on your chart—what matters is whether there’s money behind them.
That’s the true criterion for validation.
How to Build a Trend Line Correctly
Two points don’t make a trend—they’re just a hypothesis. The third touch is the test. If it occurs with supporting volumes, then you can say the trend is confirmed. But it’s critical to look beyond the line itself to the behaviour of market participants—whether buyers are genuinely driving the market or if it’s just a meaningless graphical shape.
The algorithm is simple:
- Identify two key points—lows or highs.
- Draw a tentative line between them.
- Watch for the third “touch”: if the market reacts and volumes support the movement, the trend is confirmed.
- Don’t forget the context: are buyers really pushing, or is it just a pattern without substance?
Conclusion
When you see not just drawn lines but the behaviour of volumes behind them, the market becomes much clearer.
Buyers, sellers, and the balance of supply and demand—these are what create a trend.
No rigid dogmas of technical analysis, no unnecessary indicators — just you, the volumes, and the logic of the market.
Follow new insights in our telegram channel.
No need to invent complex schemes and look for the "grail". Use the Resonance platform tools.
Register via the link — get a bonus and start earning:
OKX | BingX | KuCoin.
Promo code TOPBLOG gives you a 10% discount on any Resonance tariff plan.
Recommended articles


