The essence of trading in 7 minutes

The market price is not a coincidence, but the result of the balance between supply and demand. If you are tired of ‘secret indicators’ and want to truly understand what is happening on the chart, this article is for you. Here you will see how the market works from the inside: how a deficit is formed, why the price sometimes does not fall during sales, and how to use a cluster chart to find strong entry points. The explanations are simple, the examples are real, and the knowledge is practical. Read it and see trading in a new light.
Table of contents


Hey!
Today I want to share with you the core logic that underlies all trading and investing.
While many expect complex formulas and fancy indicators, the foundation of the market is a simple and clear law of supply and demand.
It helps explain why prices move up or down, how scarcity is formed, and what happens on the exchange during periods of active trading.
In this material, I will explain how exactly these laws work in practice, using chart examples and real market situations.
If you want to better navigate market trends and make more informed trading decisions — this breakdown is for you.
Contents
- Step 1: Understanding the Law of Supply and Demand
- Step 2: Why Scarcity Is Important on the Exchange
- Step 3: Market Analysis Using Cluster Charts
- Step 4: How Participant Activity Affects Price
- Step 5: Market Cyclicality and Equilibrium Points
- Frequently Asked Questions (FAQ)
Step 1: Understanding the Law of Supply and Demand
Let’s start with the basics. The law of supply and demand is an economic principle that combines two interconnected phenomena:
- Demand — the desire and ability of buyers to purchase a product at a certain price.
- Supply — the amount of a product that sellers are willing to offer at the same price.
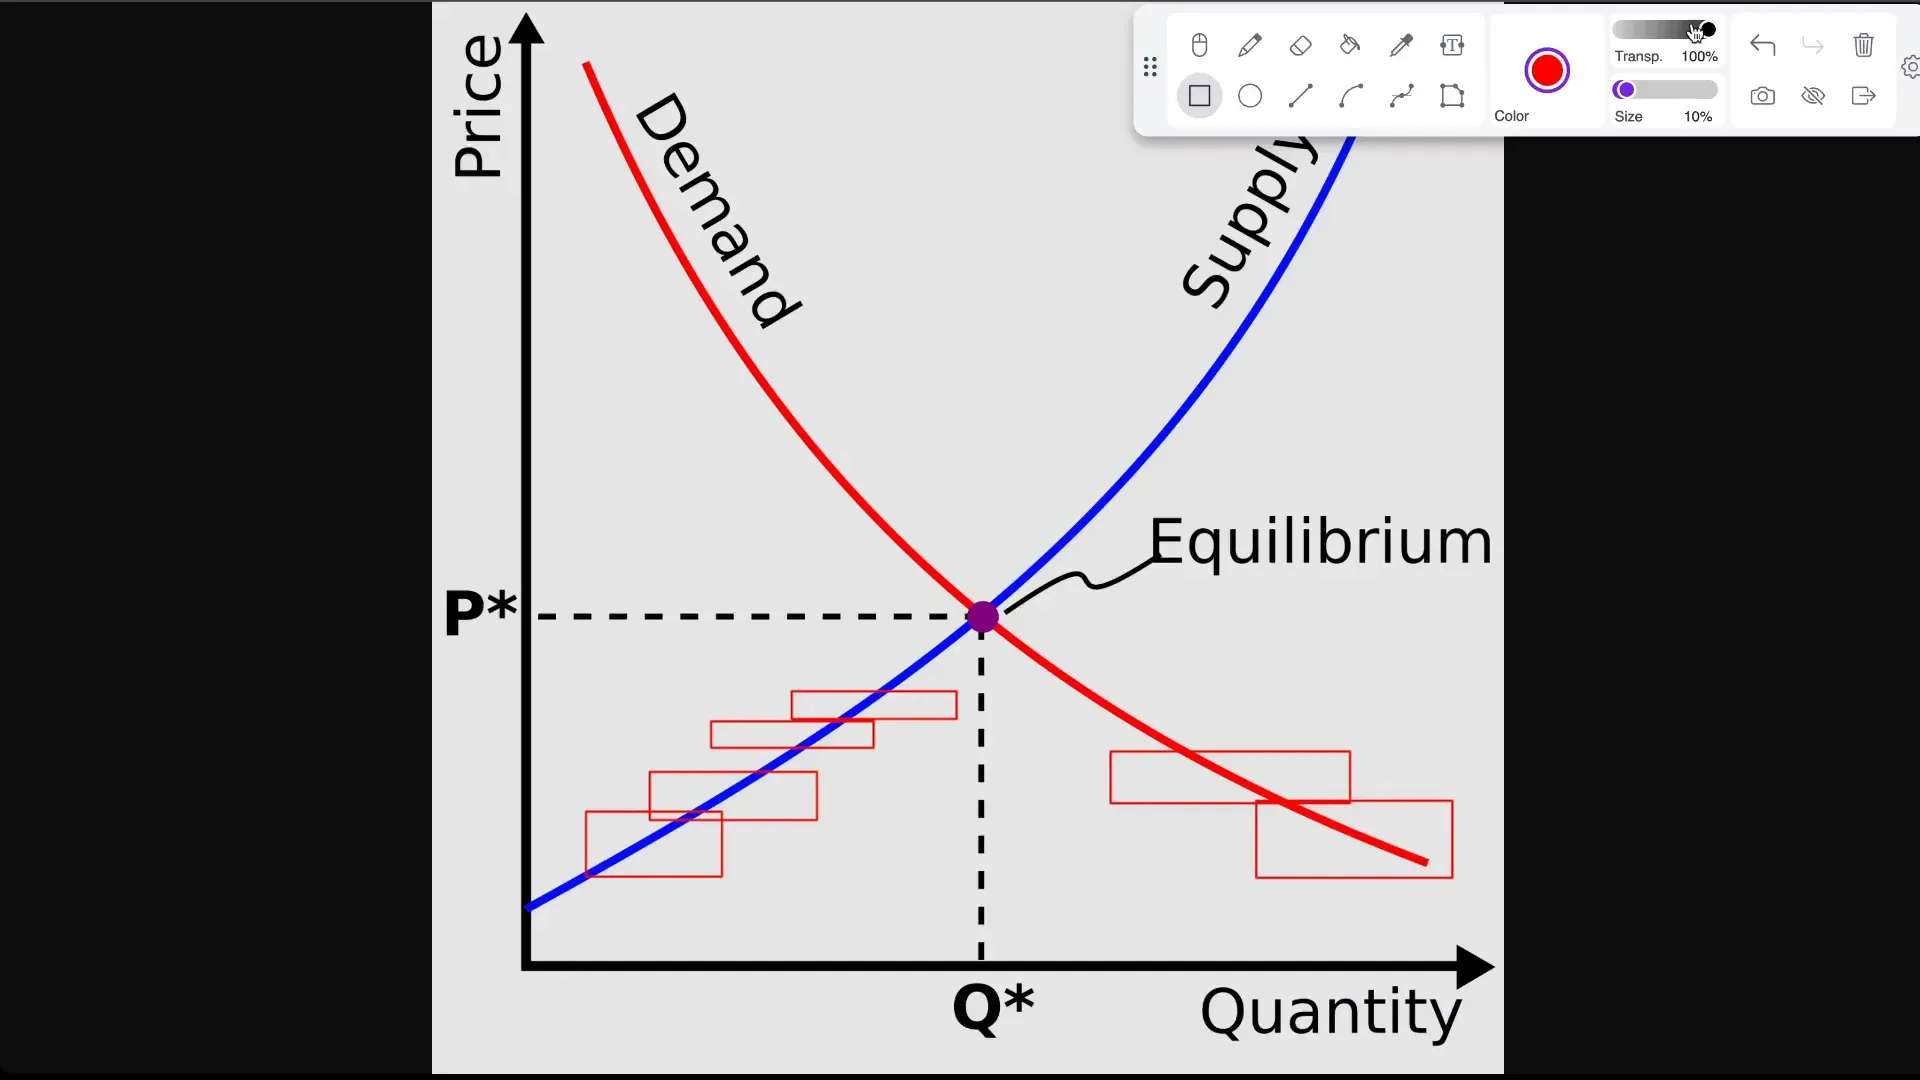
Price is established at the equilibrium point, where the quantity of demand matches the quantity of supply. All other things being equal, if the price of a product decreases, demand increases and supply decreases. Conversely, if the price rises, supply increases and demand drops.
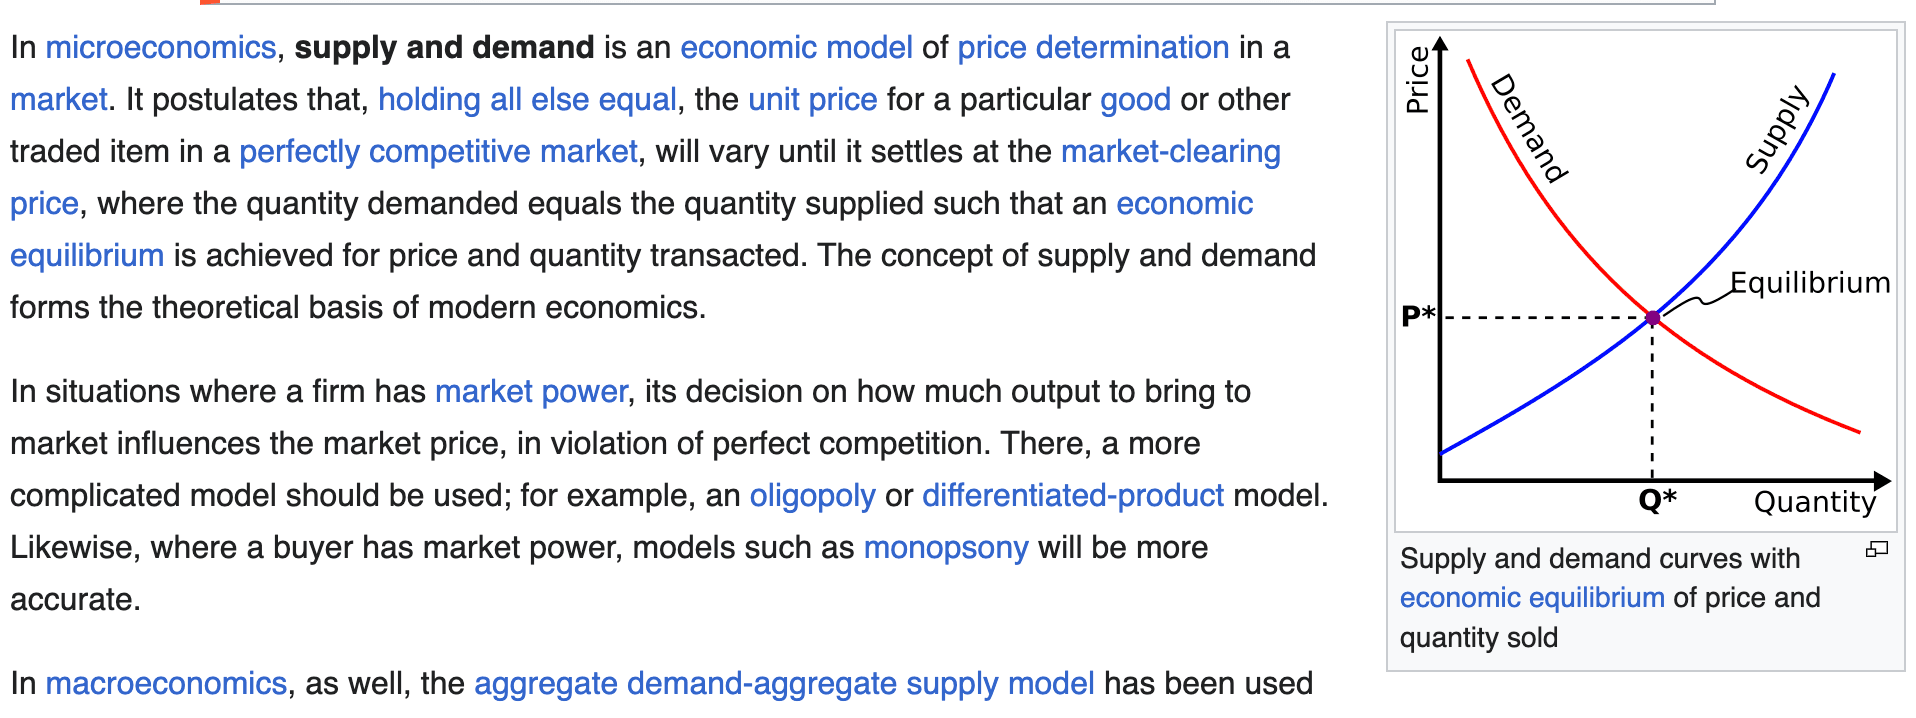
On the chart, this looks like the following: the blue line shows the supply dynamics, the red line shows demand. At low prices, demand is at its peak and supply is minimal. At high prices — the opposite.
Step 2: Why Scarcity Is Important on the Exchange
Exchange-traded goods are the most valuable products in the market.
Participants don’t buy assets for consumption, but for resale at a profit.
They aim to buy a valuable asset at a low price and sell it at a higher one.
But here’s the key nuance: at low prices, the available supply in the market is limited.
This means that even if buyers have a lot of money, they cannot buy more than what is currently being offered. To buy more, they need to move higher in price, where supply is greater.
This phenomenon is called deficit.
Deficit is a situation where buyers cannot purchase an asset at a certain price, even though they are willing to pay.
In such conditions, the price begins to rise because demand exceeds supply.

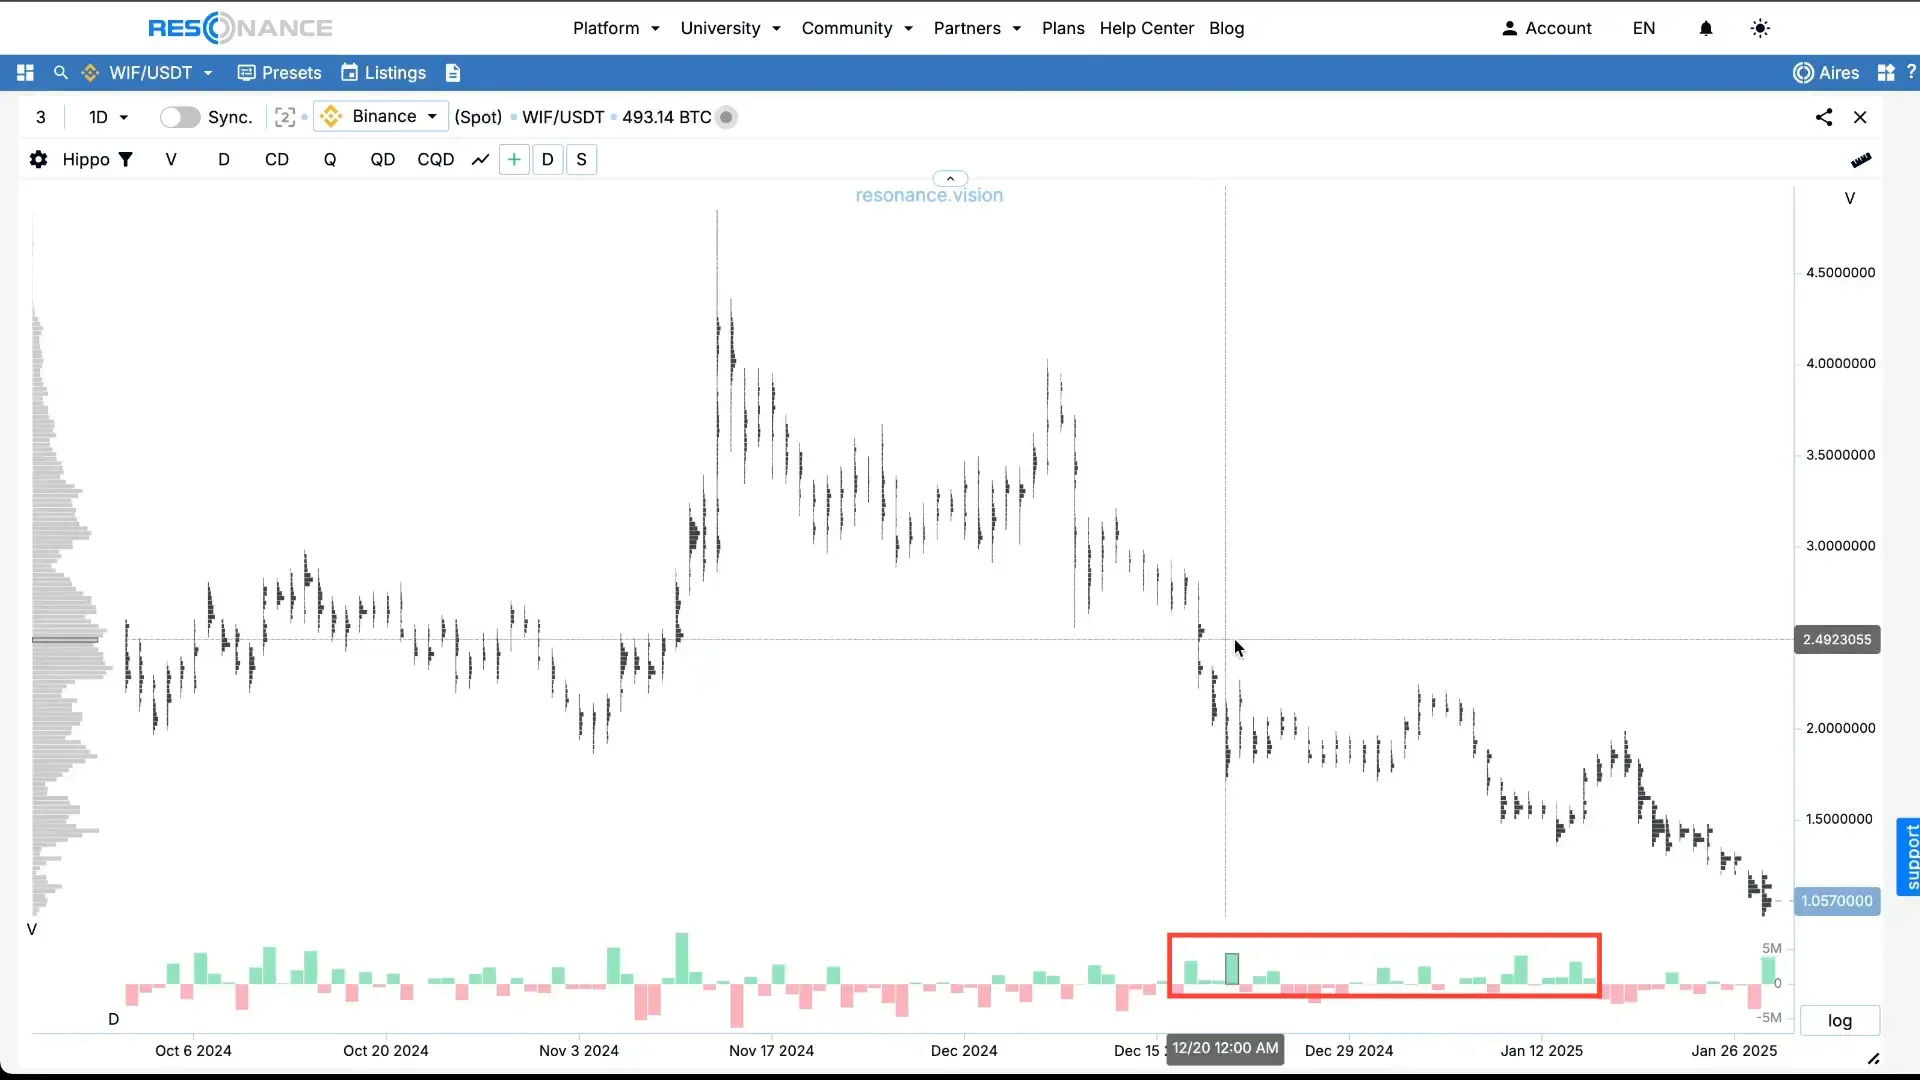
Step 3: Market Analysis Using Cluster Charts
Now let’s move on to a more detailed tool — the cluster chart.
It shows not only price changes over time, but also the trading volumes at each price level during a time period.
- The width of black rectangles — the traded volume: the wider the bar, the higher the volume.
- Delta histogram (red-green) — the difference between market buys and sells.
– Green indicates more buys than sells
– Red indicates more sells than buys
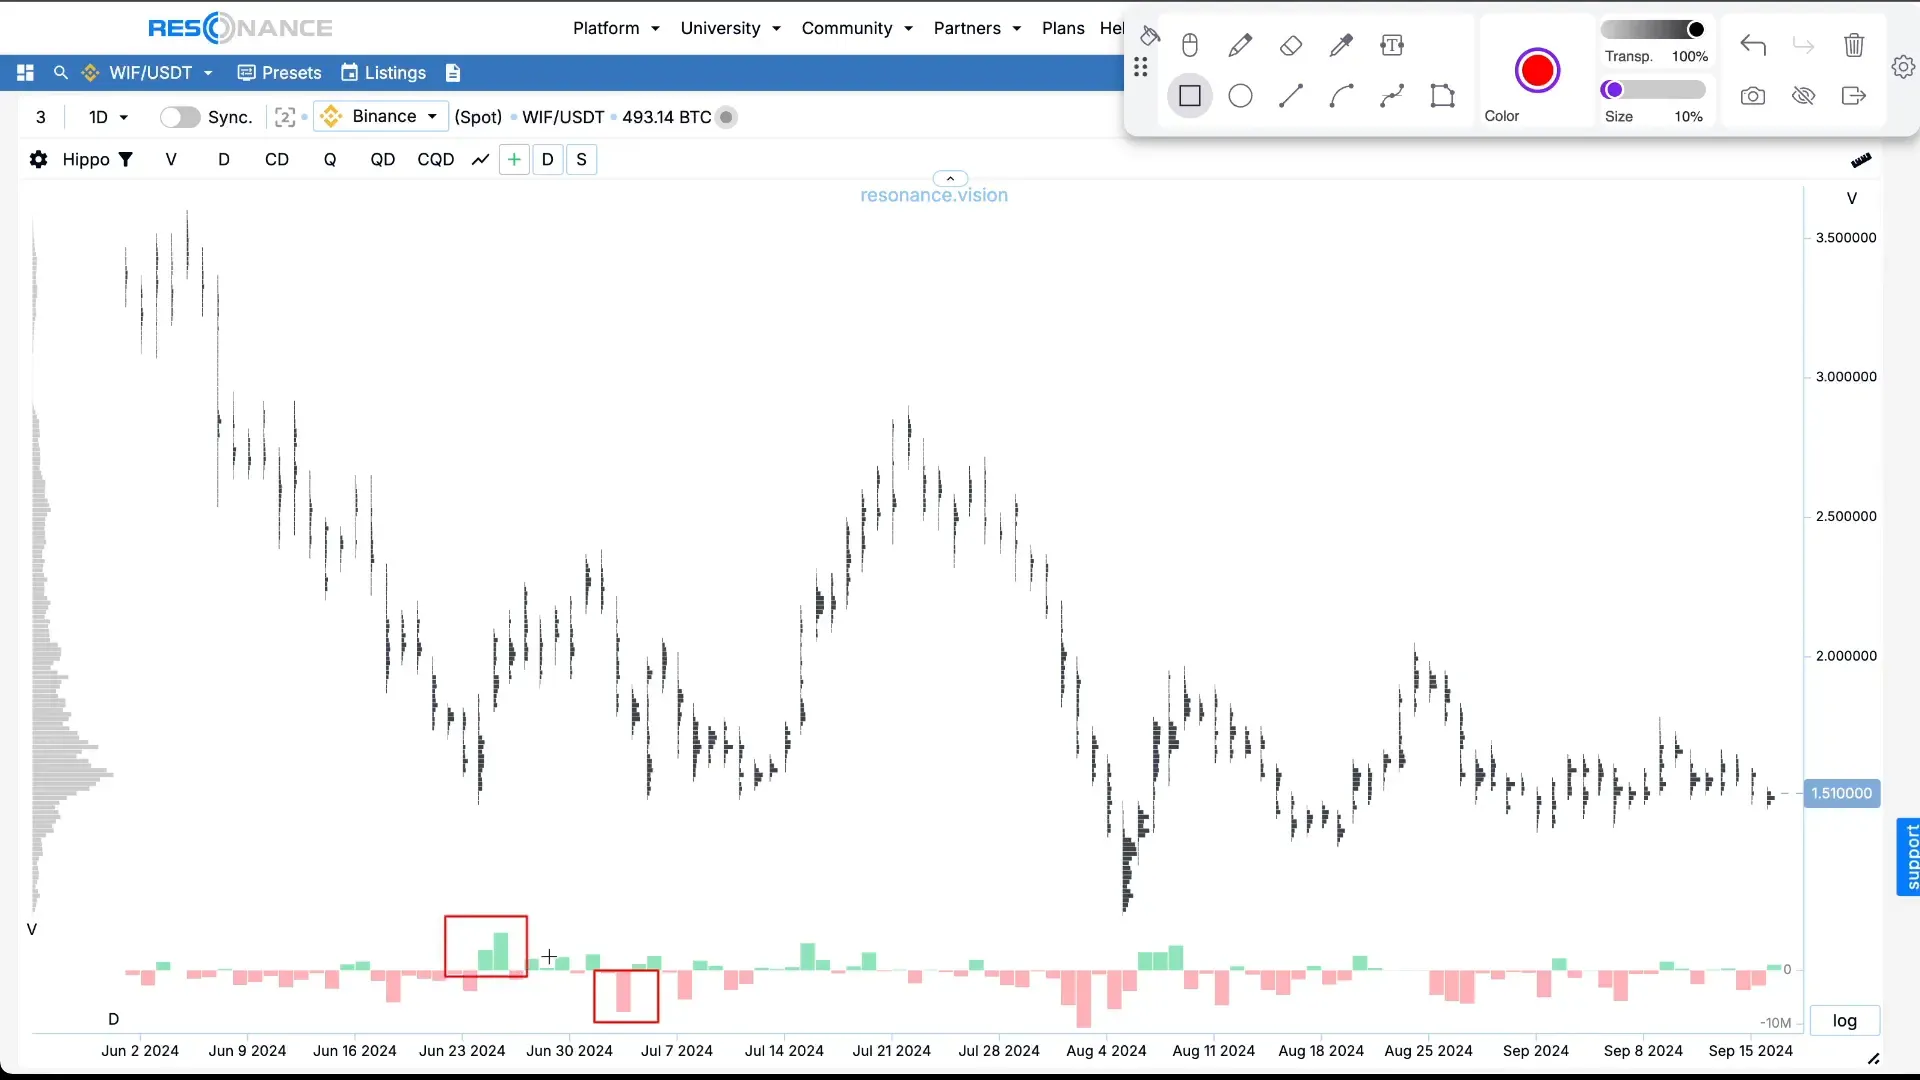
It’s very important to pay attention to situations where large sell volumes do not cause the price to fall.
This indicates that someone is actively absorbing the selling, and demand exceeds supply.
Such zones are where local scarcity forms, leading to price increases.
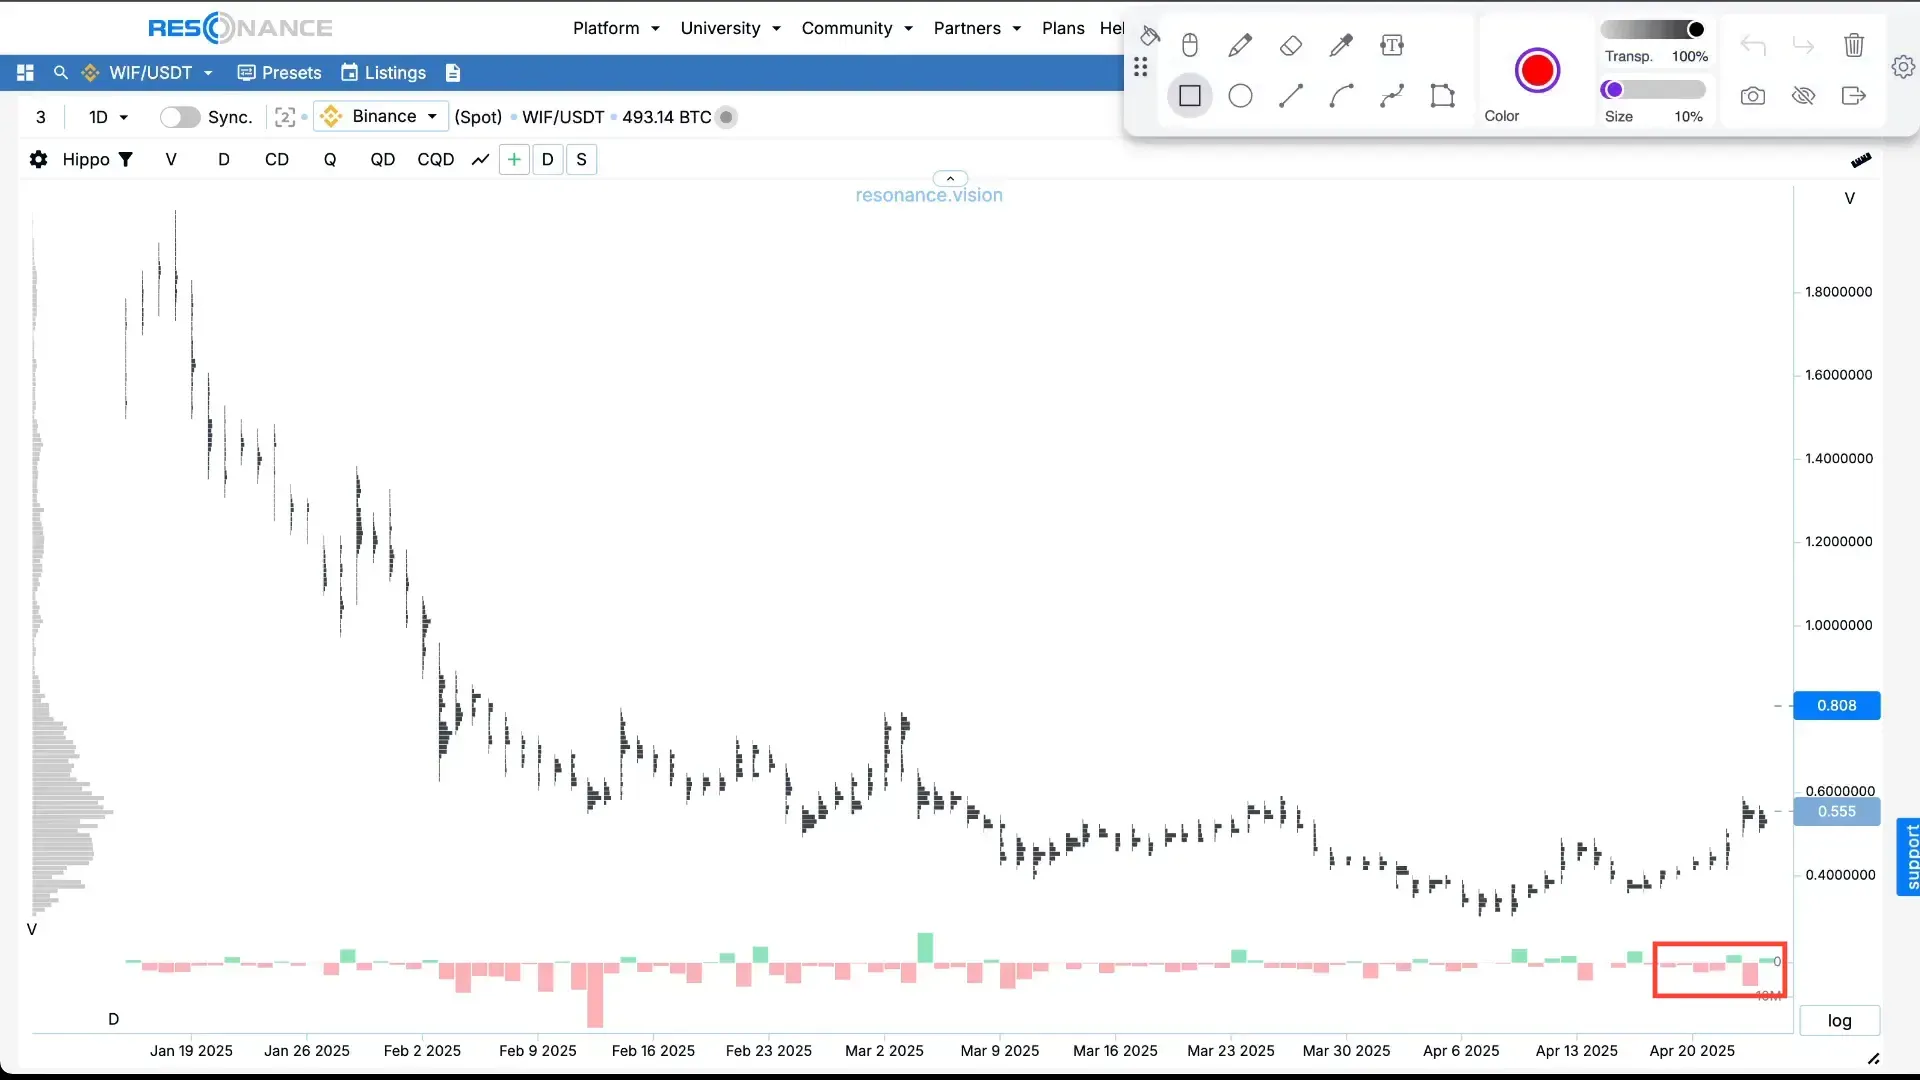
Step 4: How Participant Activity Affects Price
Imagine the following: those who bought an asset at low prices begin selling it at higher prices.
They will keep selling until either:
- they run out of inventory,
- or the price starts to drop.
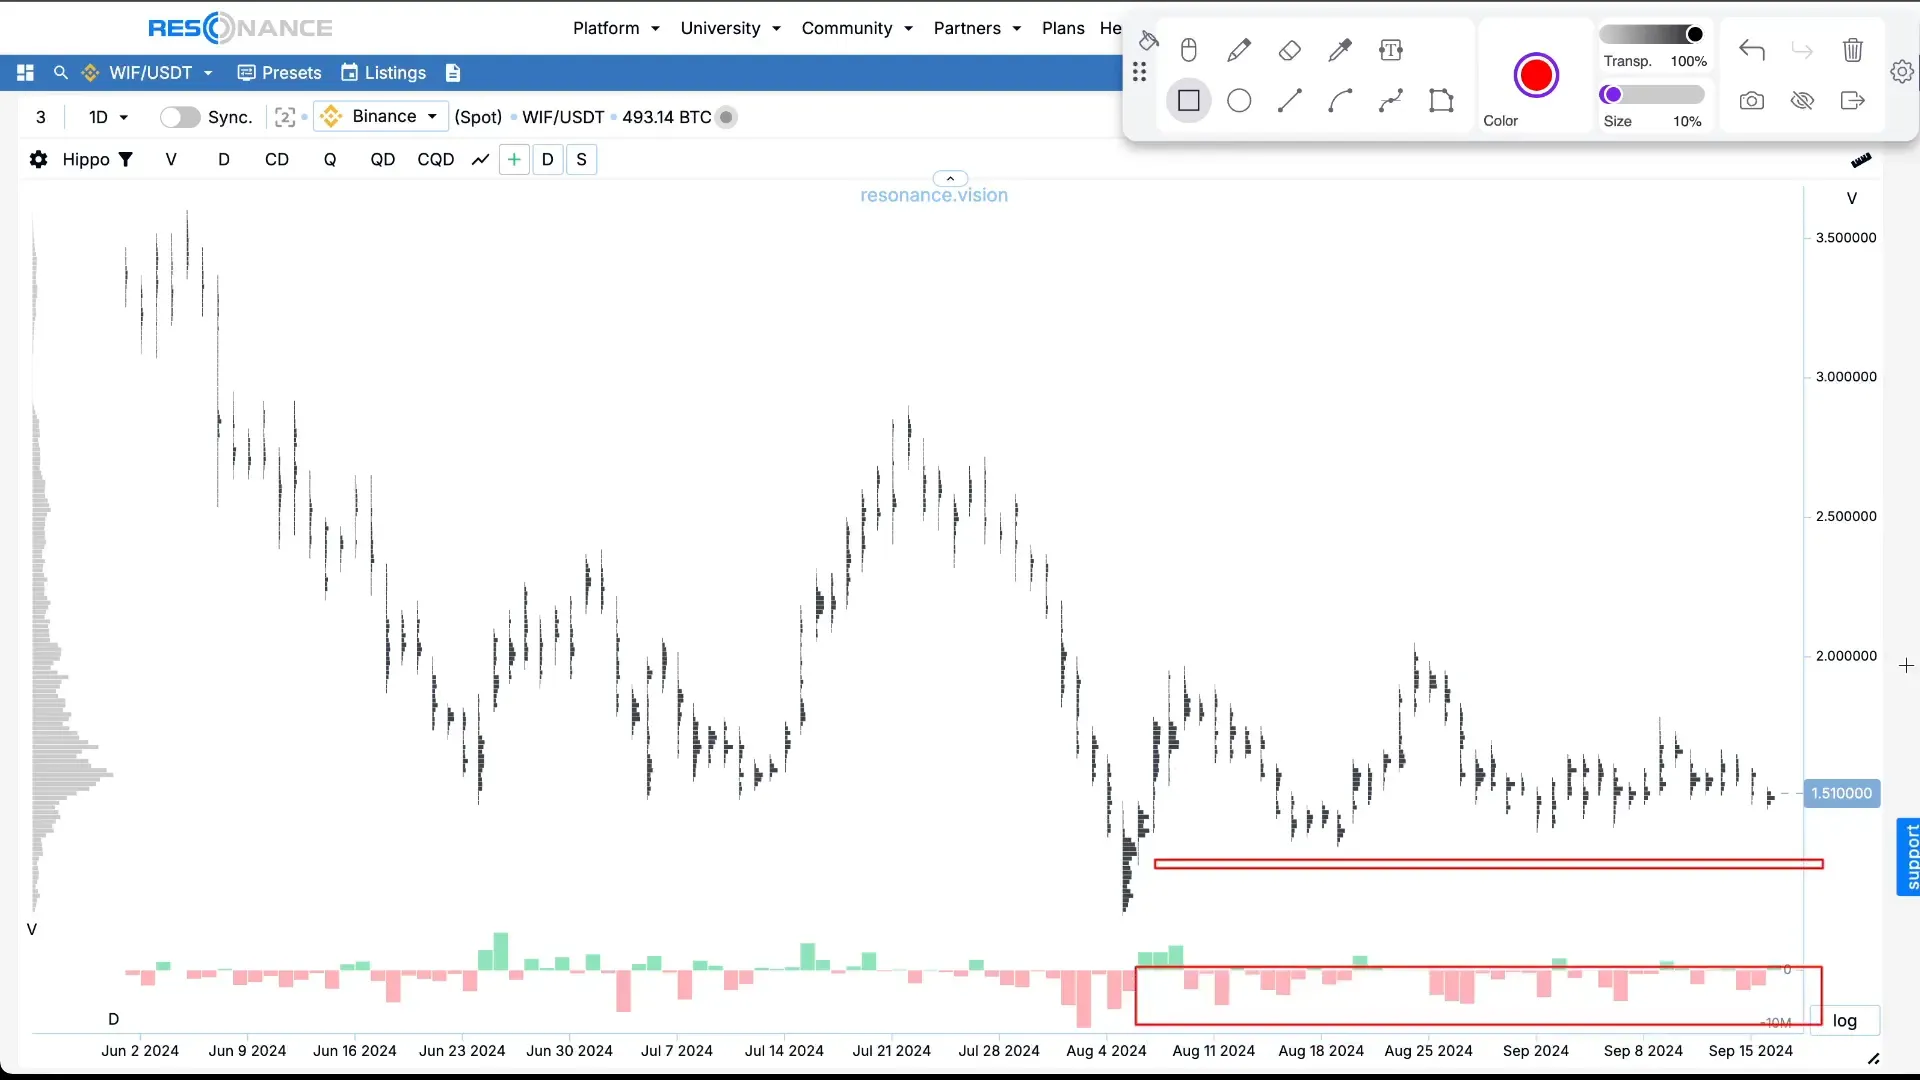
If selling is very active and voluminous, it pushes the price downward.
The more supply there is — the lower the price.
But if the price doesn’t drop during active selling, it means demand is absorbing supply, and a deficit is forming.
The opposite is also true: if there are buys, but the price doesn’t rise, and instead falls — then supply exceeds demand. This is known as surplus.
In this state, you need to wait for the moment when market buys are being absorbed without the price falling — this is a signal that scarcity is forming, with a potential for price growth.
Step 5: Market Cyclicality and Equilibrium Points
After a period of active buying and selling, the market returns to an equilibrium point, where the price stabilizes.
Here, participants can once again create scarcity when the price stops falling, and a new rally begins.
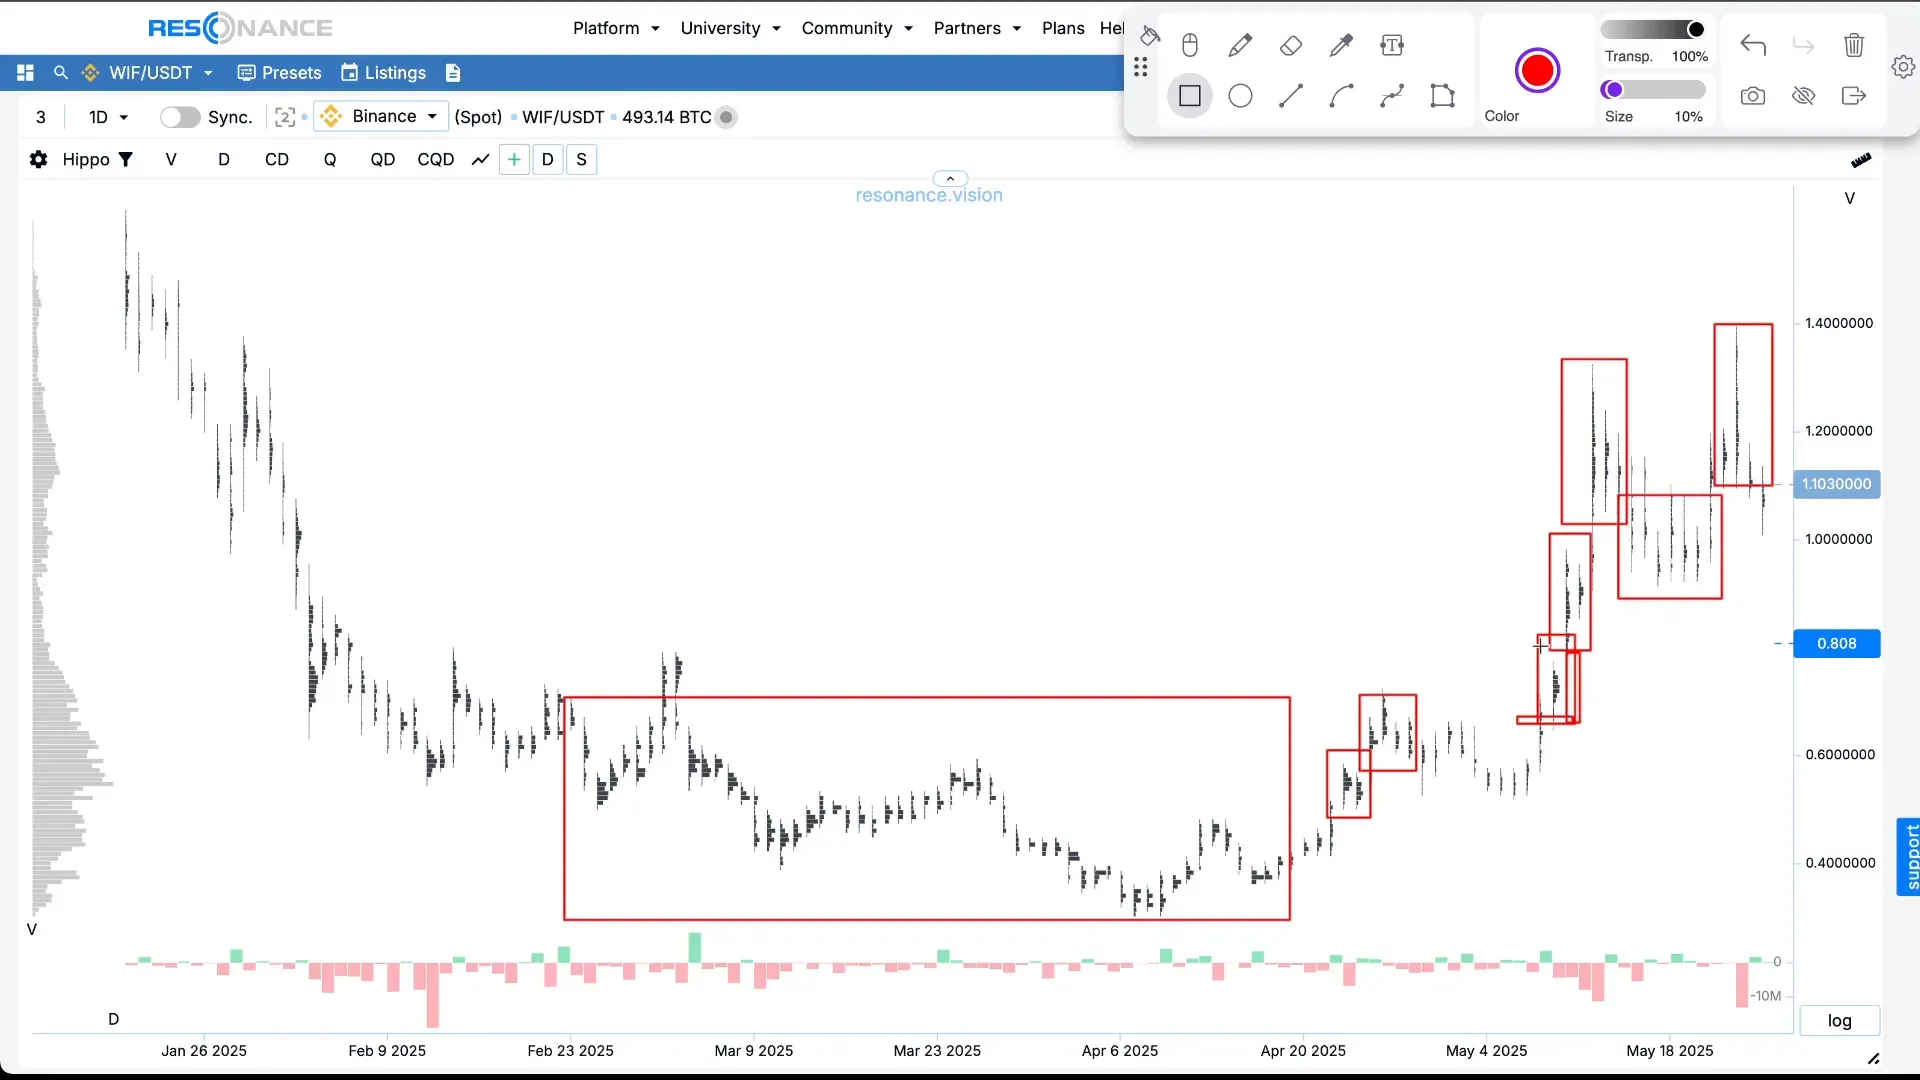
It’s important to understand that these laws apply to any market — whether it’s stocks, cryptocurrencies, or any other assets.
And regardless of whether you’re looking at minute, five-minute, or daily charts — the principles of supply and demand remain fundamental.
Conclusion
So, the essence of trading comes down to:
- understanding the balance of supply and demand
- recognizing the formation of scarcity and surplus
- and knowing how these states affect price behavior
If you learn to spot these signals on charts and understand what’s happening with trading volumes, you’ll be able to make more informed and profitable decisions.
Remember: trading is not about technical indicators, but about deep understanding of market mechanics, based on simple and timeless economic laws.
Frequently Asked Questions (FAQ)
What is market scarcity and why is it important?
The deficit is a situation where demand exceeds supply at a certain price. This leads to price increases because buyers are competing over limited goods.
How does a cluster chart help traders?
A cluster chart displays not only price, but also volume traded at each price, as well as the delta between market buys and sells. This helps identify where scarcity or surplus is forming.
Why doesn’t price fall sometimes despite heavy selling?
If price doesn’t fall during large sell-offs, it means there’s strong demand absorbing the supply — creating scarcity and supporting the price.
Can these principles be applied to any cryptocurrency or stock?
Yes, the law of supply and demand is universal and works across all markets and timeframes.
Follow new insights in our telegram channel.
No need to invent complex schemes and look for the "grail". Use the Resonance platform tools.
Register via the link — get a bonus and start earning:
OKX | BingX | KuCoin.
Promo code TOPBLOG gives you a 10% discount on any Resonance tariff plan.
Recommended articles


