Trading Falling Wedge Pattern: How the Formation Works and What Volumes Show

The falling wedge in trading is a popular technical analysis formation that many consider a ready bullish signal. But behind every pattern there is real money and real volumes. In this article, we explain when this wedge trading pattern actually works, why classical interpretations oversimplify the picture, and how modern tools — cluster chart, heatmap, delta balance, and price change per unit of volume — help validate the formation. Only volume analysis turns a picture on the chart into a working tool and gives traders an edge in the crypto market.
Table of contents
- 01Introduction
- 02What is a Falling Wedge
- 03Verification of Statement #1: Decline of Volume Inside the Formation
- 04Verification of Statement #2: Liquidity Spike at the Breakout
- 05Verification of Statement #3: Reduction of Sellers’ Pressure
- 06Verification of Statement #4: Asset Accumulation by Buyers
- 07Efficiency of Volumes’ Influence on Price
- 08Price Change per Unit of Volume
- 09Confirmation of Reversal
- 10Conclusion

Introduction
The trading falling wedge pattern is one of the most popular figures in technical analysis. Many traders see it as a guaranteed signal for growth since classical technical analysis insists that it is a bullish formation. However, behind any geometric figure drawn on a price chart, there are always volumes. It is the volumes that determine whether the wedge trading pattern really works or remains just a nice picture on the chart.
In this article, we will explain what a falling wedge is, how to validate it with volume analysis, and in which cases it truly predicts a reversal.
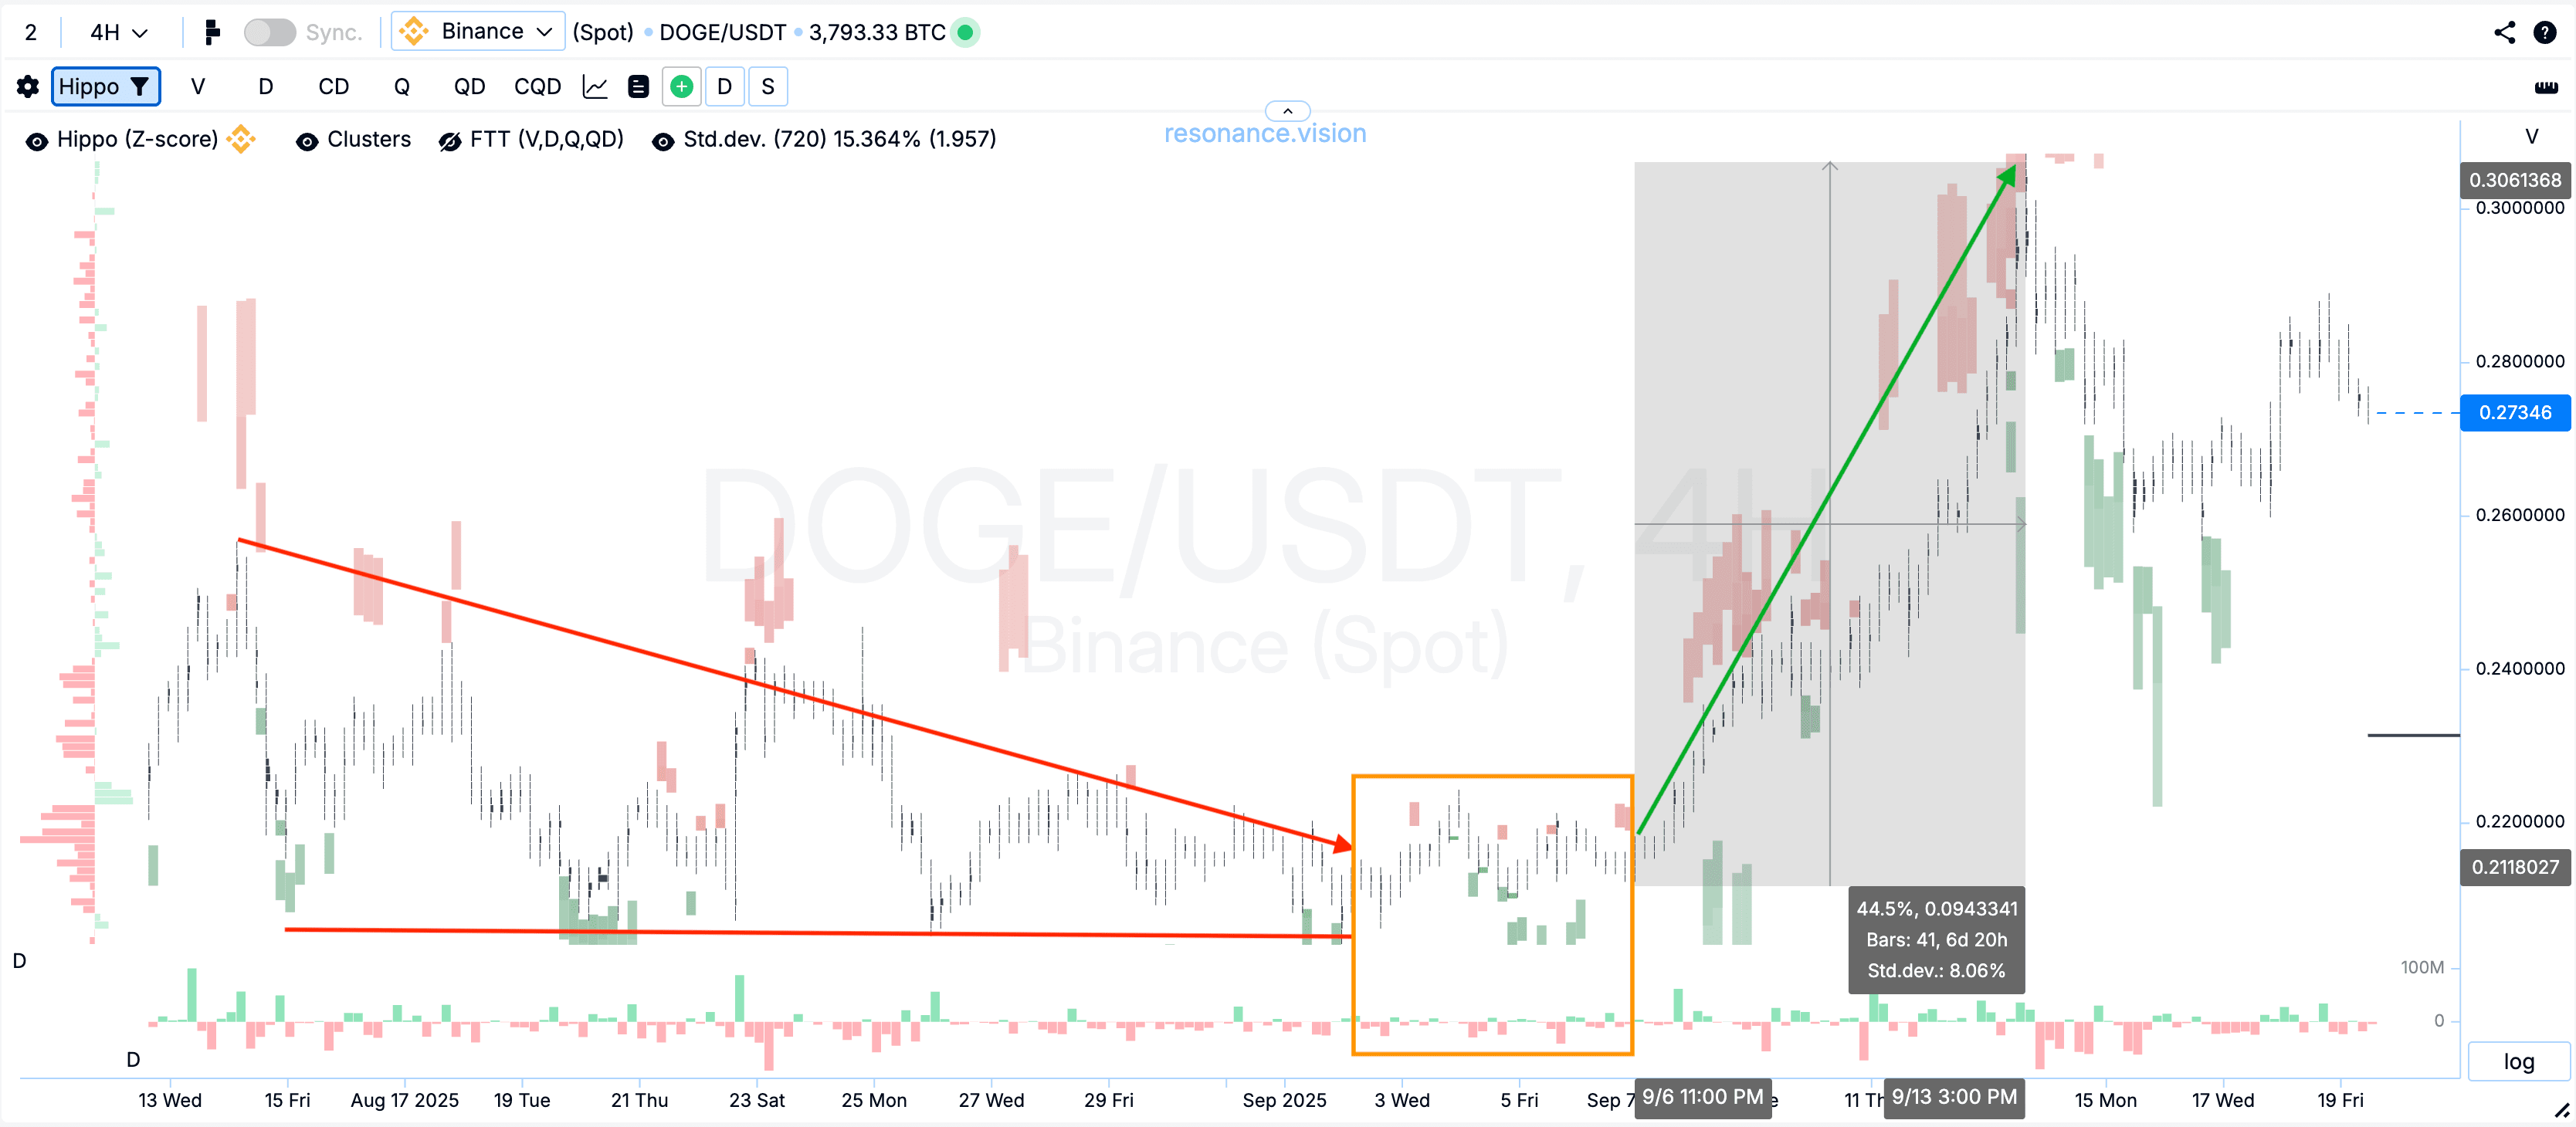
What is a Falling Wedge
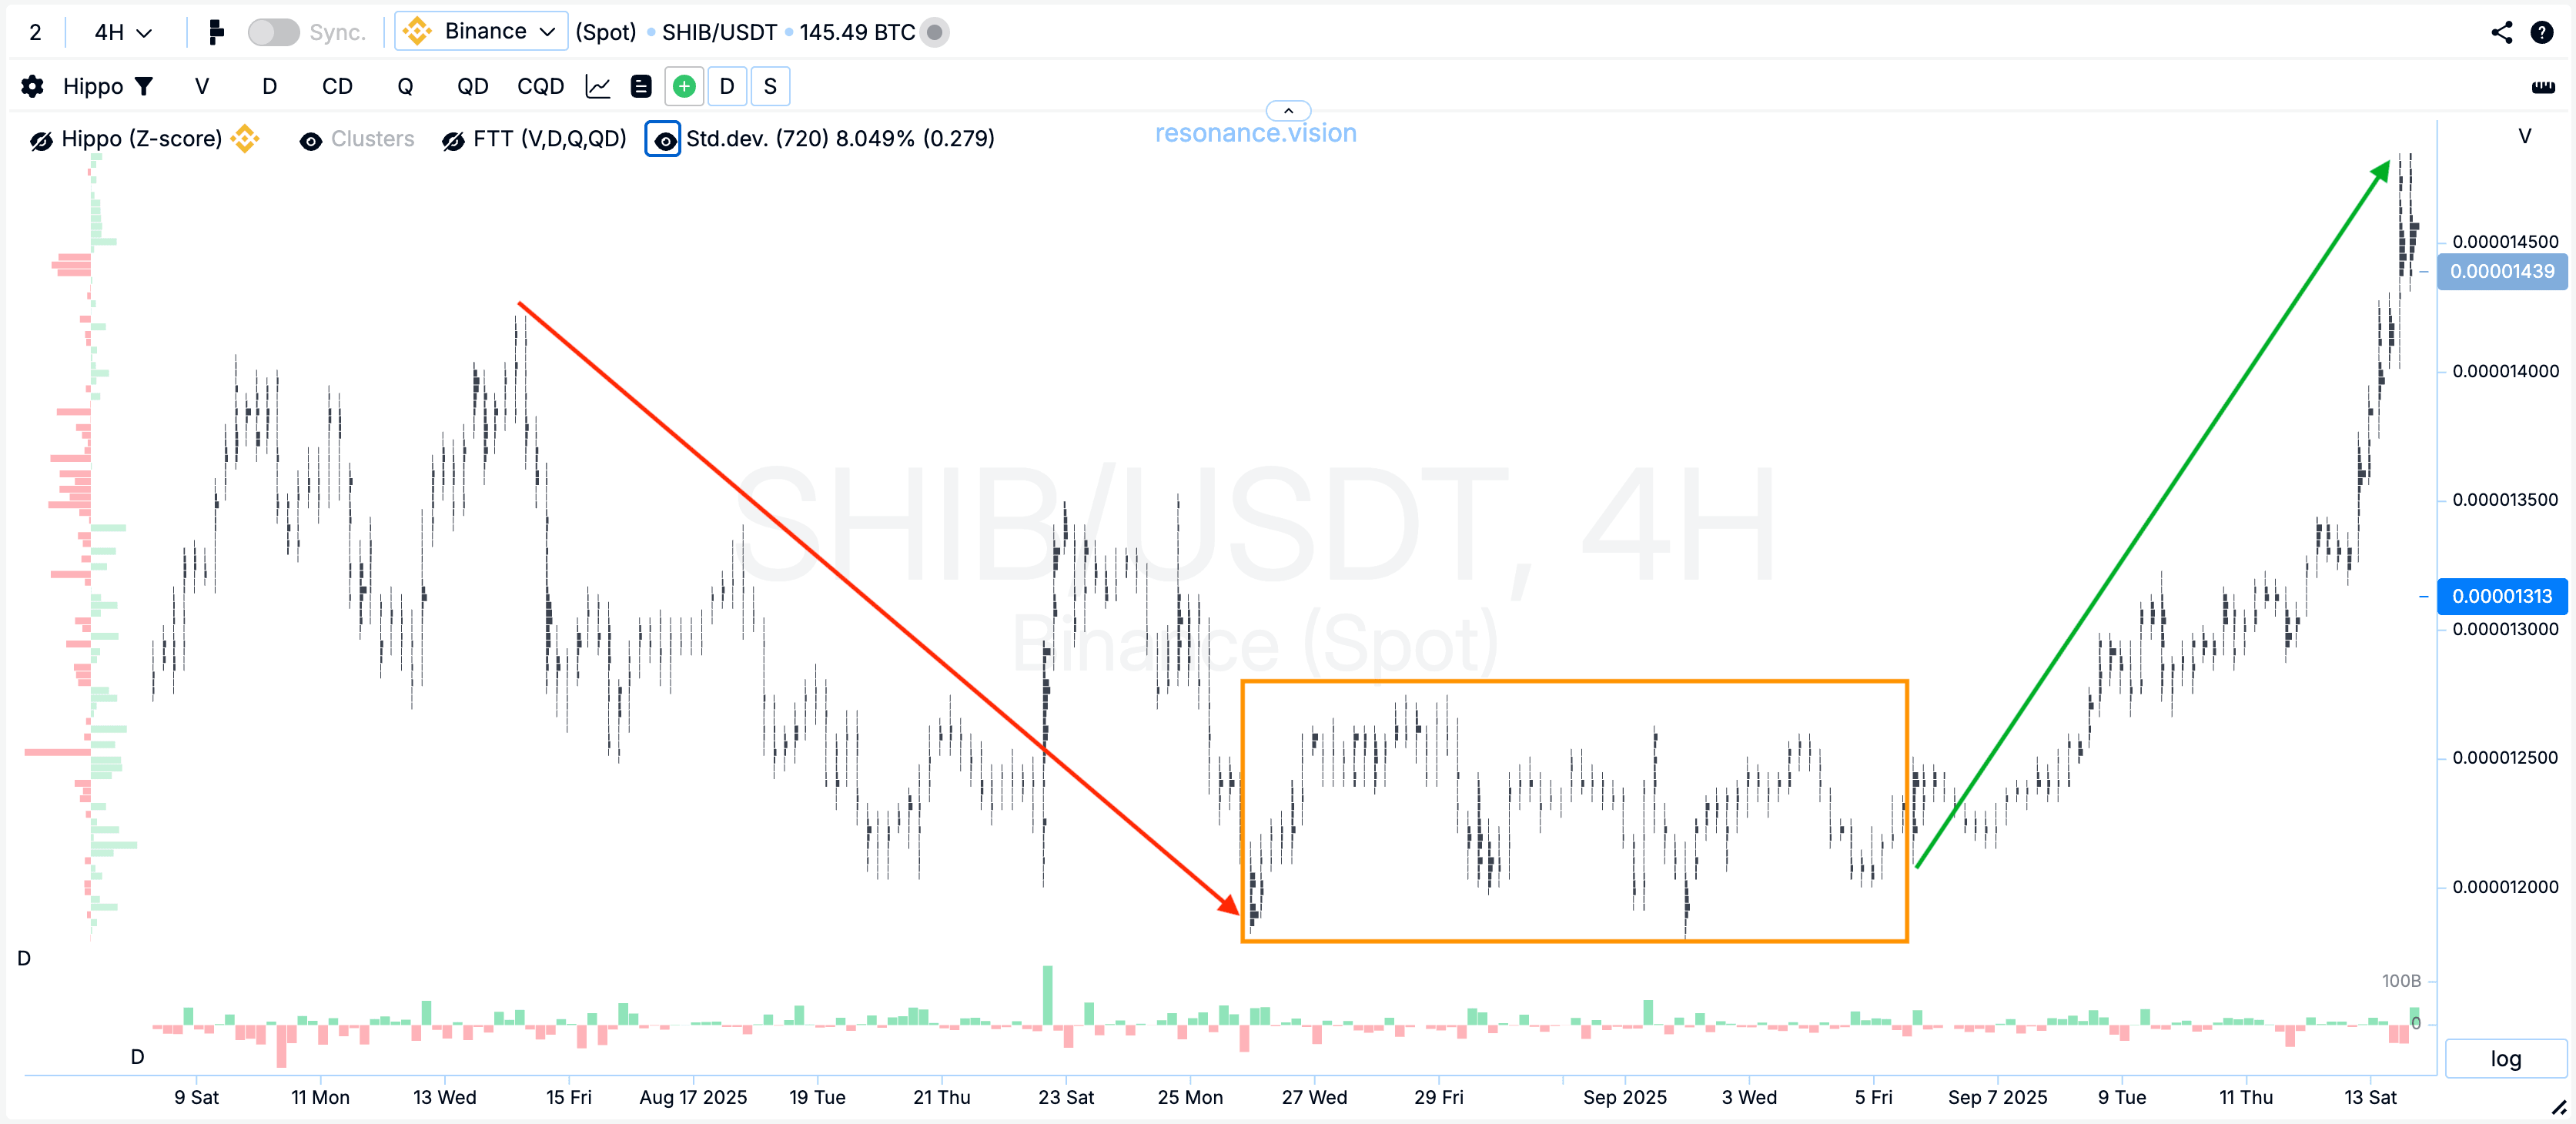
A trading falling wedge pattern is a graphical formation that develops in a downward movement and gradually narrows. The price makes lower highs and lower lows, which indicates a downtrend. The lines drawn through the highs and lows visually converge downward, forming the so-called wedge. The price fluctuation range narrows.
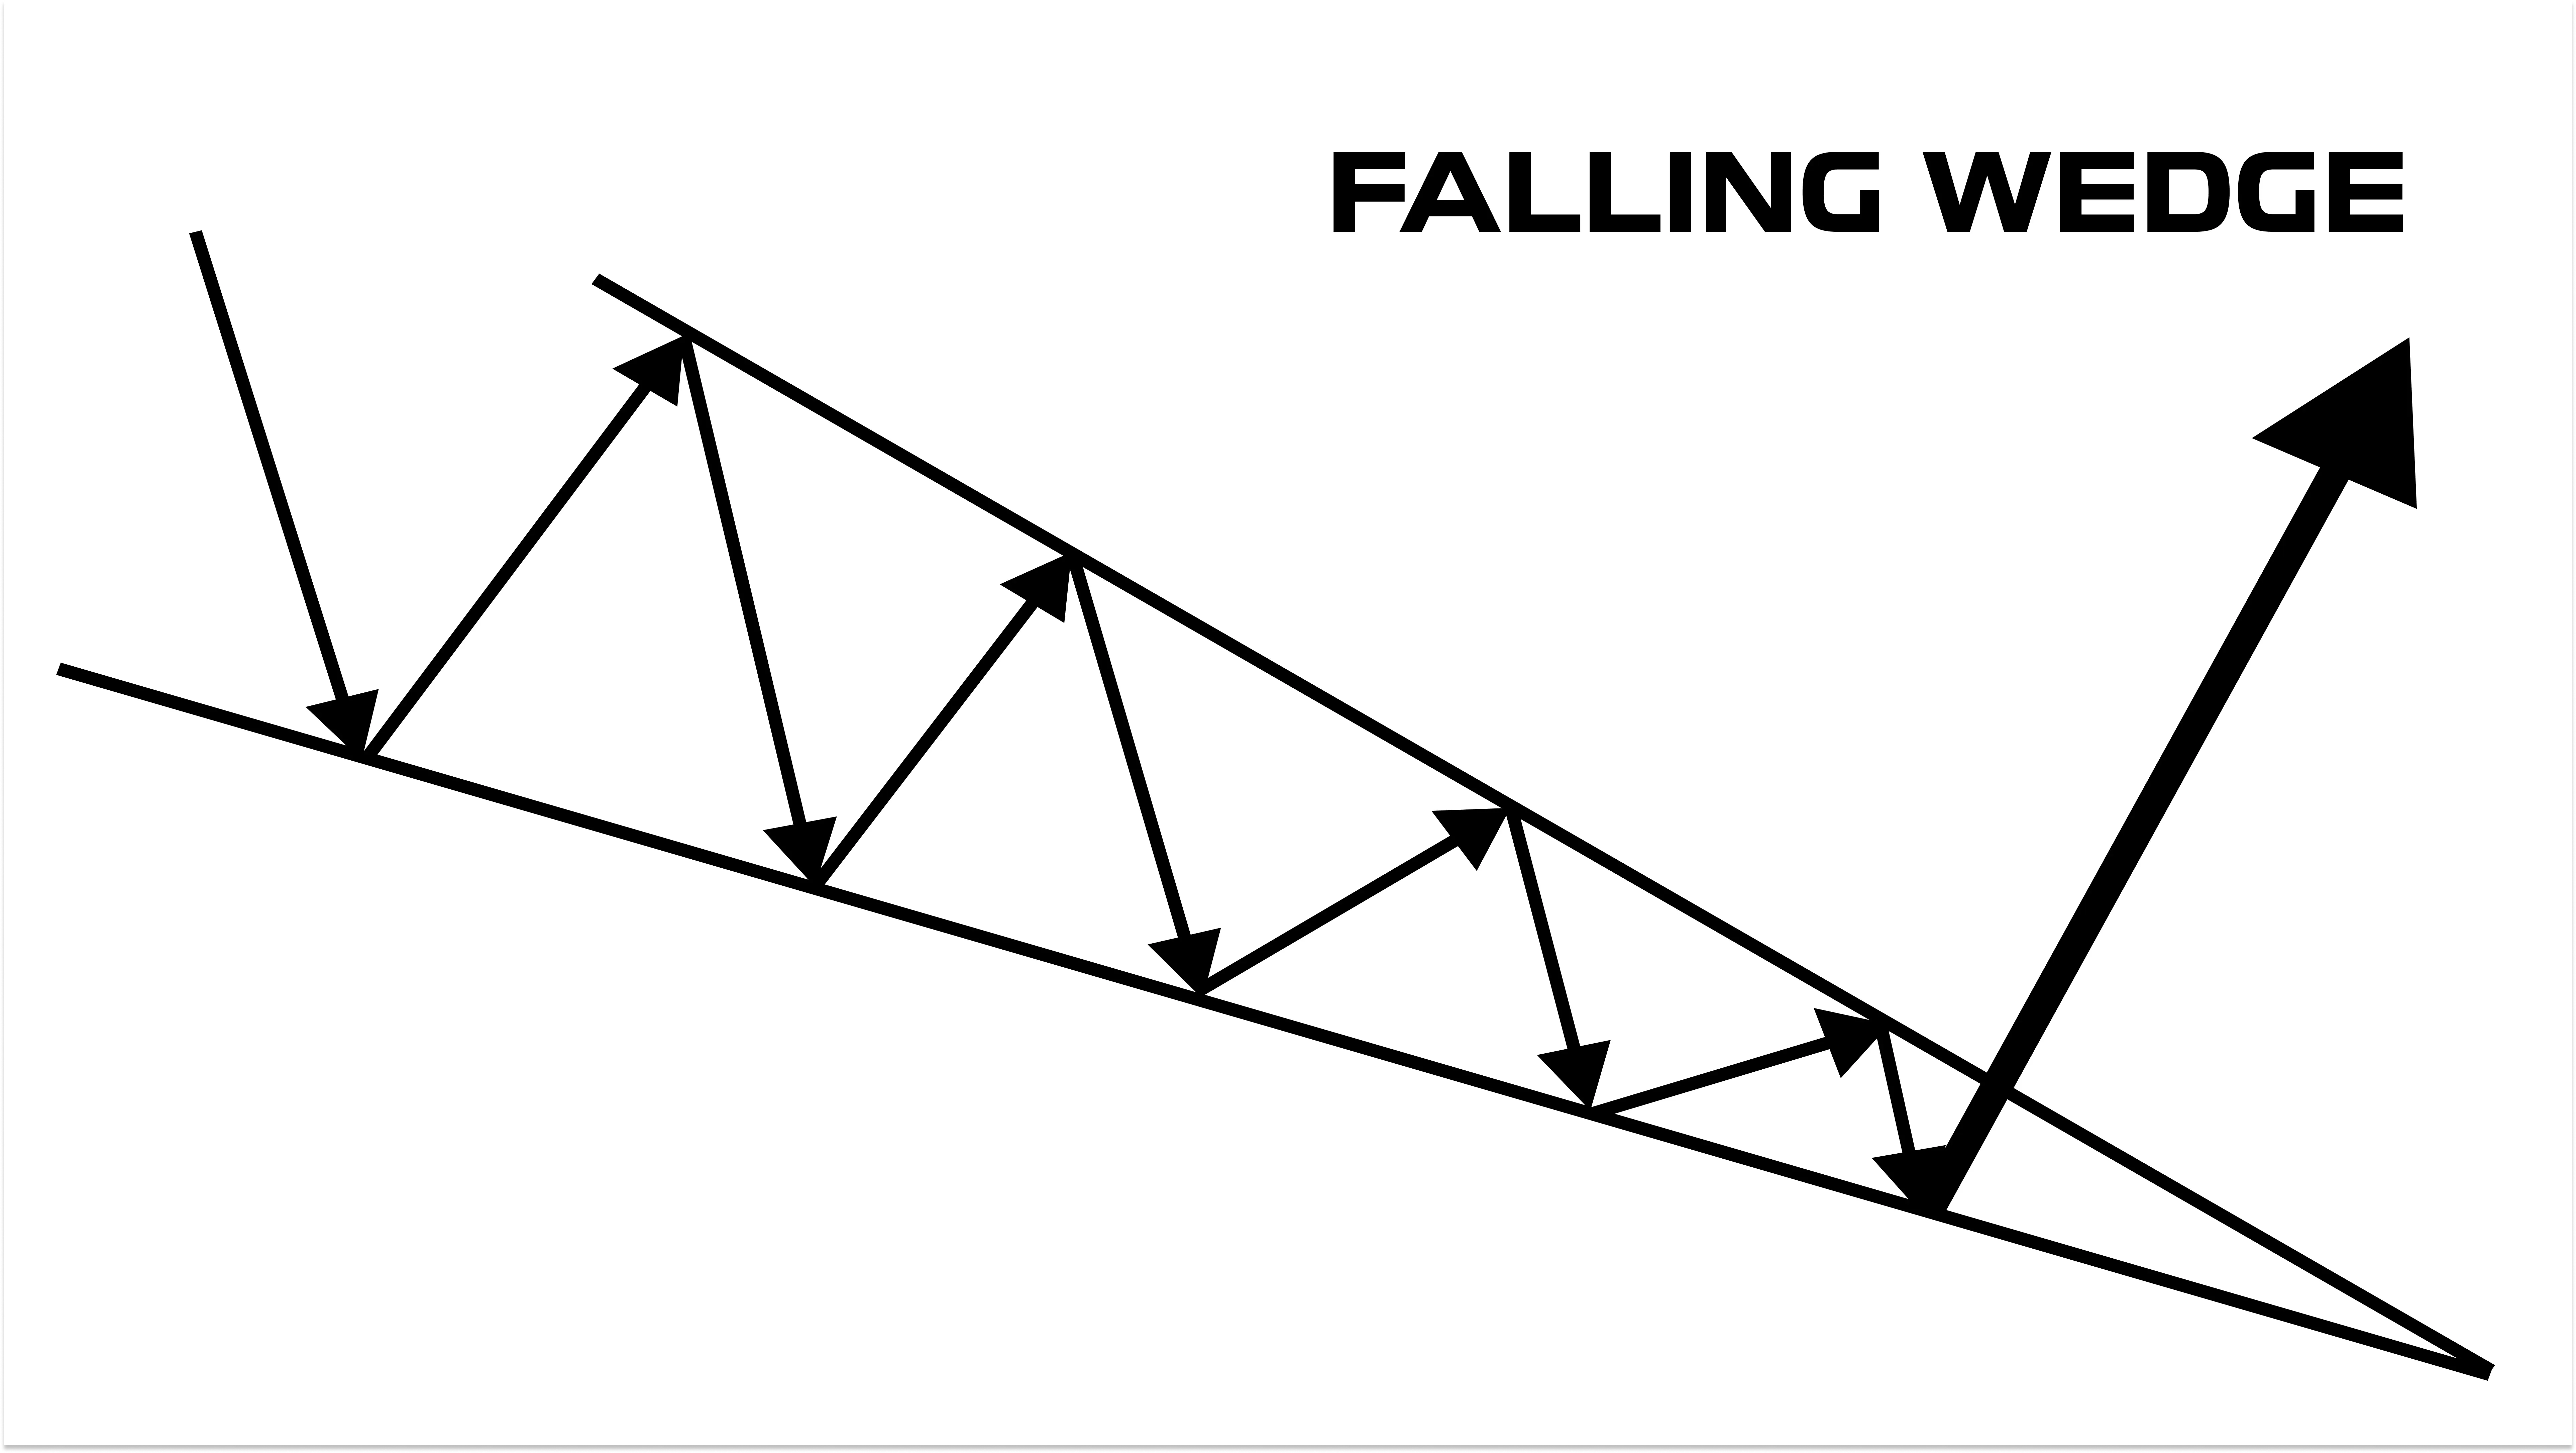
It is believed that such a formation reflects the weakening of sellers. That is why the wedge trading pattern is often considered a bullish signal: sellers exhaust themselves, and buyers gain the opportunity to take the initiative.
We will conduct a mini-research. Let’s take crypto coins with a falling wedge pattern and check 4 facts:
- decrease in volumes inside the “bullish wedge” formation;
- liquidity spike at the breakout of the formation;
- reduction of sellers’ pressure;
- accumulation of assets by buyers.
Before analyzing the trading falling wedge pattern, it is important to clarify the sample conditions. Coins were selected to minimize arbitrage influence: the bulk of their crypto trading volume was concentrated on Binance, currently the most liquid exchange. This allowed the data to be cleaner and more representative. The selected coins were liquid ones — ADA, DOT, APT, DOGE, NEAR, SUI, XRP, WIF, SHIB, STRK, VET.
To verify all assumptions of the figure according to classical technical analysis, we used the tools Delta/Balance by volume and Volume/Balance, which show what was really happening with volumes and why the price reversed.
Verification of Statement #1: Decline of Volume Inside the Formation
Historically, when the foundations of technical analysis were developed, there was no detailed market data. Traders saw only total trading volumes without separation into buys and sells. Therefore, classical interpretations of the falling wedge formation were built on this limited indicator.
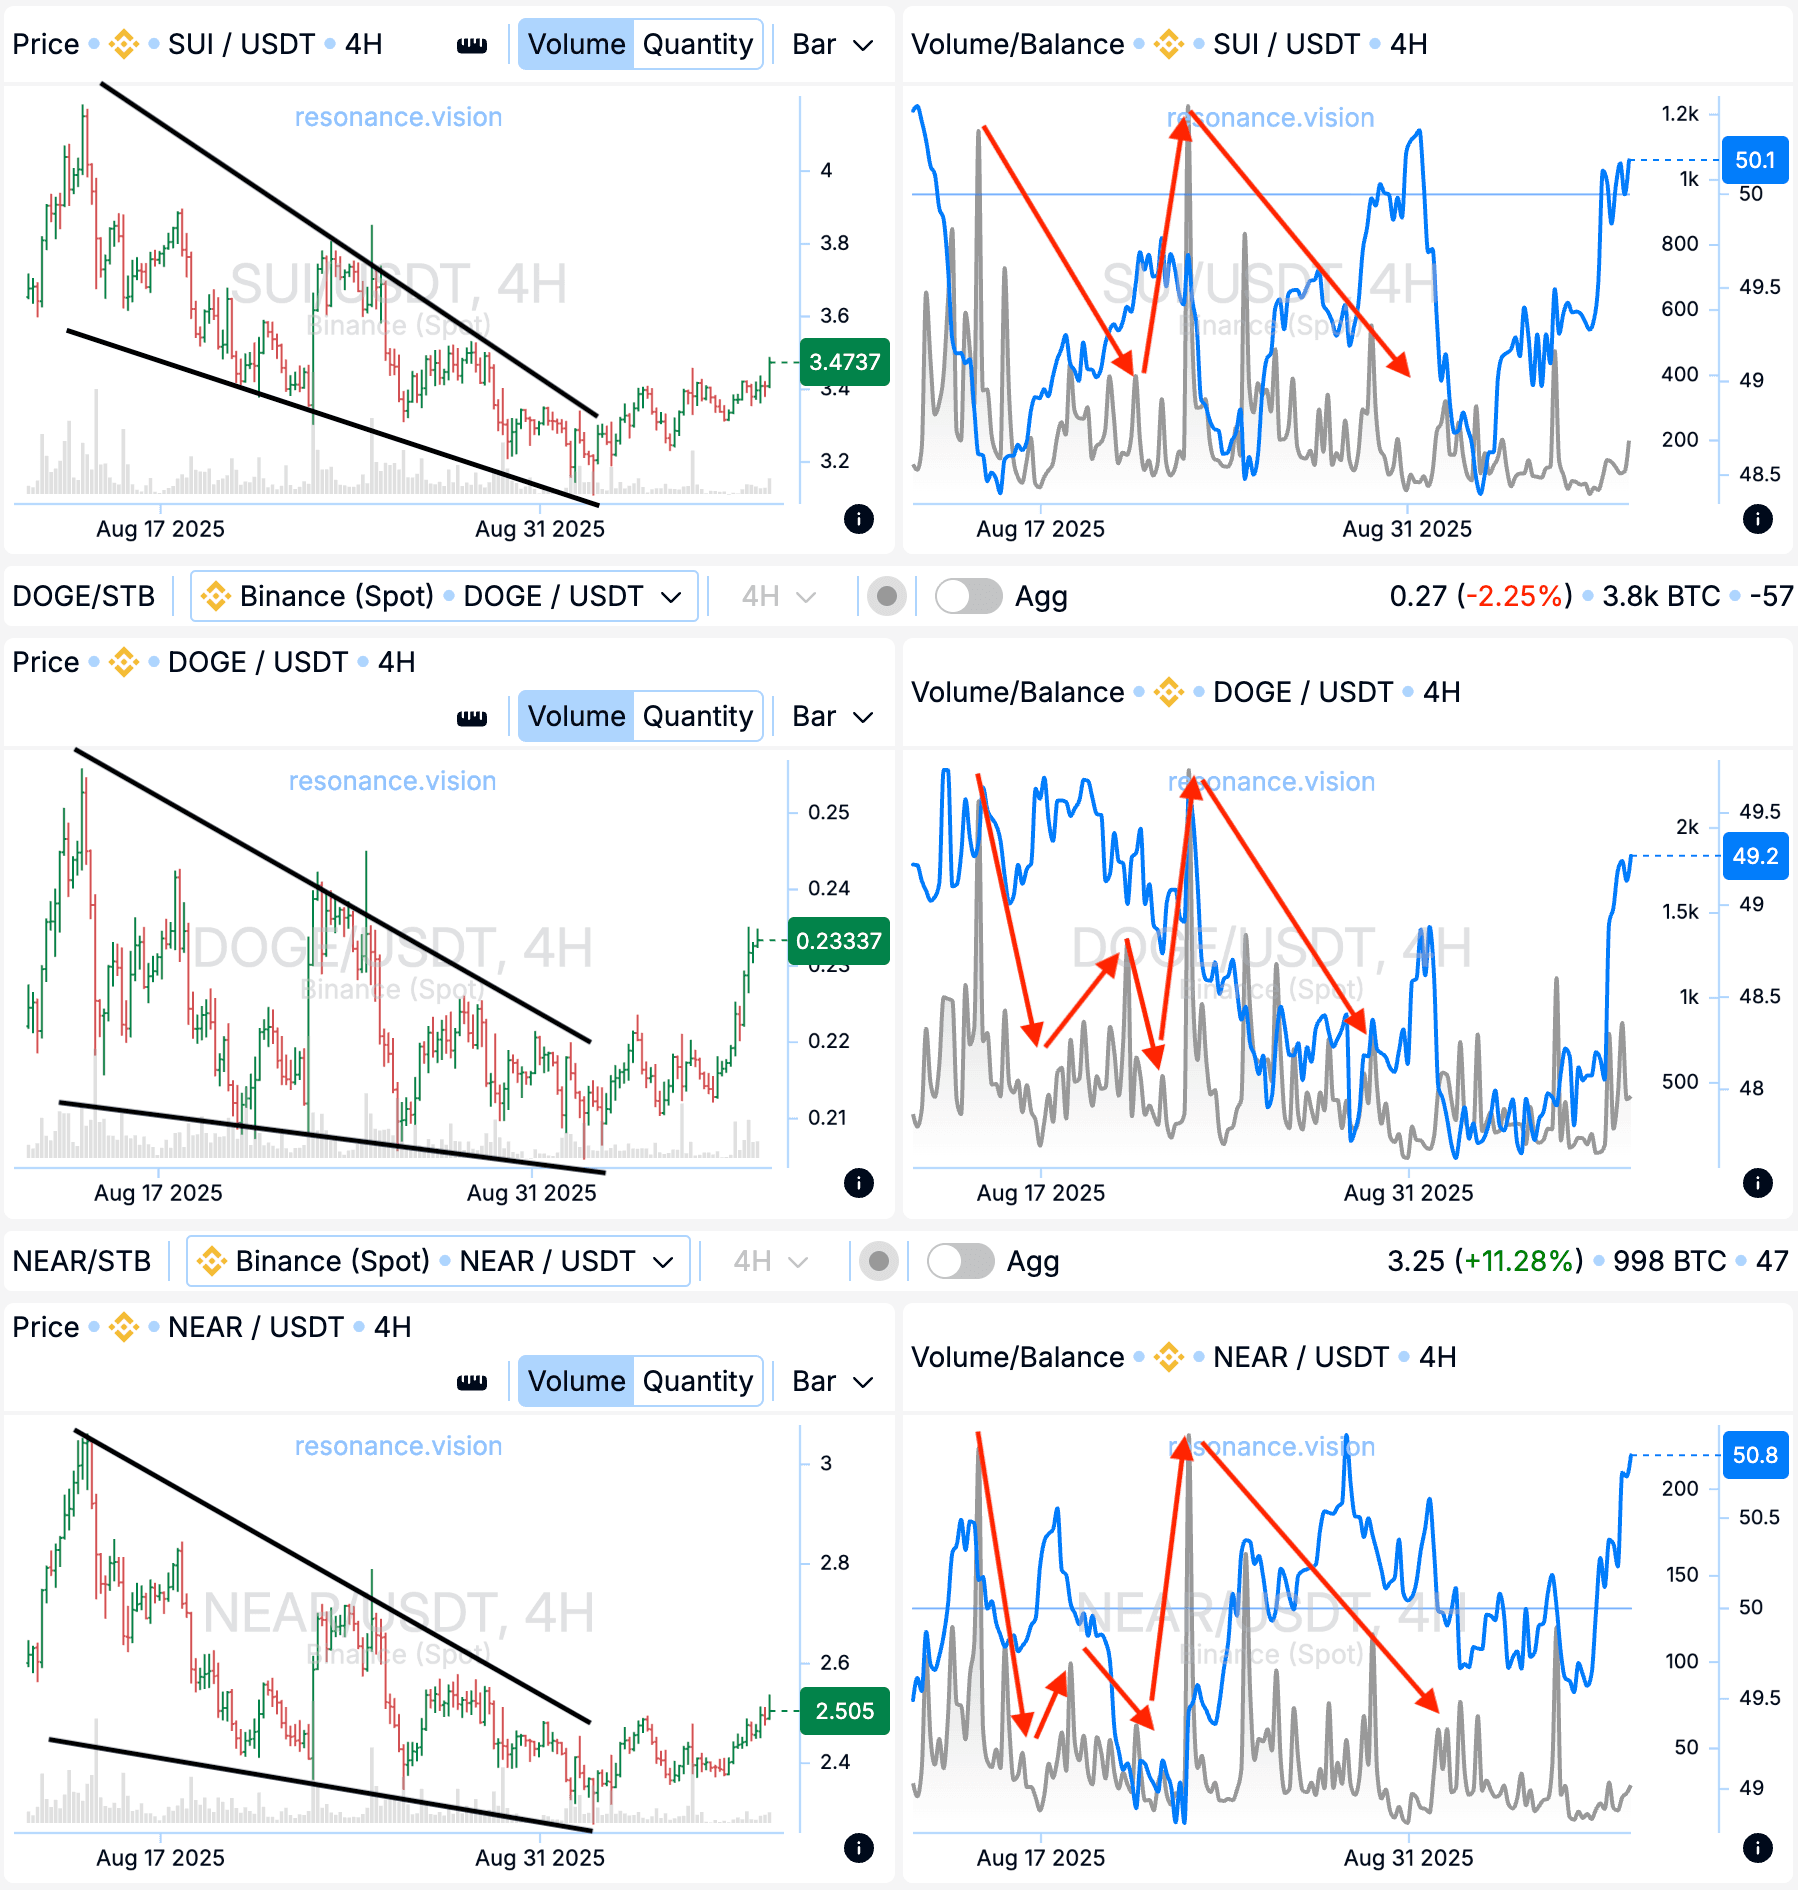
Now let’s see what really happens:
- In three considered cases, there was no stable decrease of volumes inside the formation.
- Periods of liquidity spikes, then declines, then new jumps were recorded.
- A smooth decreasing trend of volumes as a single line was absent.
Conclusion:
The statement that the trading falling wedge pattern is always accompanied by a stable decline in volumes inside the formation is not confirmed. In practice, we see fluctuations in liquidity, not a consistent decline.
Thus, the classical approach (orientation on total volumes) can be considered simplified and even outdated. In modern conditions, to validate the formation it is much more important to analyze the structure of volumes — separately for buyers and sellers, and through efficiency metrics.
Verification of Statement #2: Liquidity Spike at the Breakout
Classical theory claims that a trading falling wedge pattern must be confirmed by a spike in liquidity at the breakout upward. But what do real observations show?
In all reviewed cases, there was indeed a slight increase in volumes at the breakout. However, there are important nuances:
- Volume minimums fell on weekends. For the crypto market, this is absolutely typical: statistically, trading activity decreases during these days.
- Therefore, it is difficult to say whether the spike in liquidity reflects true buyer activity or whether it was caused by the simple restoration of trading at the beginning of the week.
- Often, at the start of the working week, volumes rise after the weekend, which can create the illusion of a confirmation indicator for the formation.
Conclusion:
The rise in volumes at the breakout of the falling wedge formation is questionable as a universal sign. In many cases, it may not be validation of the breakout but simply a calendar effect.
Verification of Statement #3: Reduction of Sellers’ Pressure
In classical analysis, it is assumed that the trading falling wedge pattern is accompanied by a gradual decrease in sellers’ activity. To verify this thesis, we used the Delta/Balance by volume tool in the Resonance dashboard.
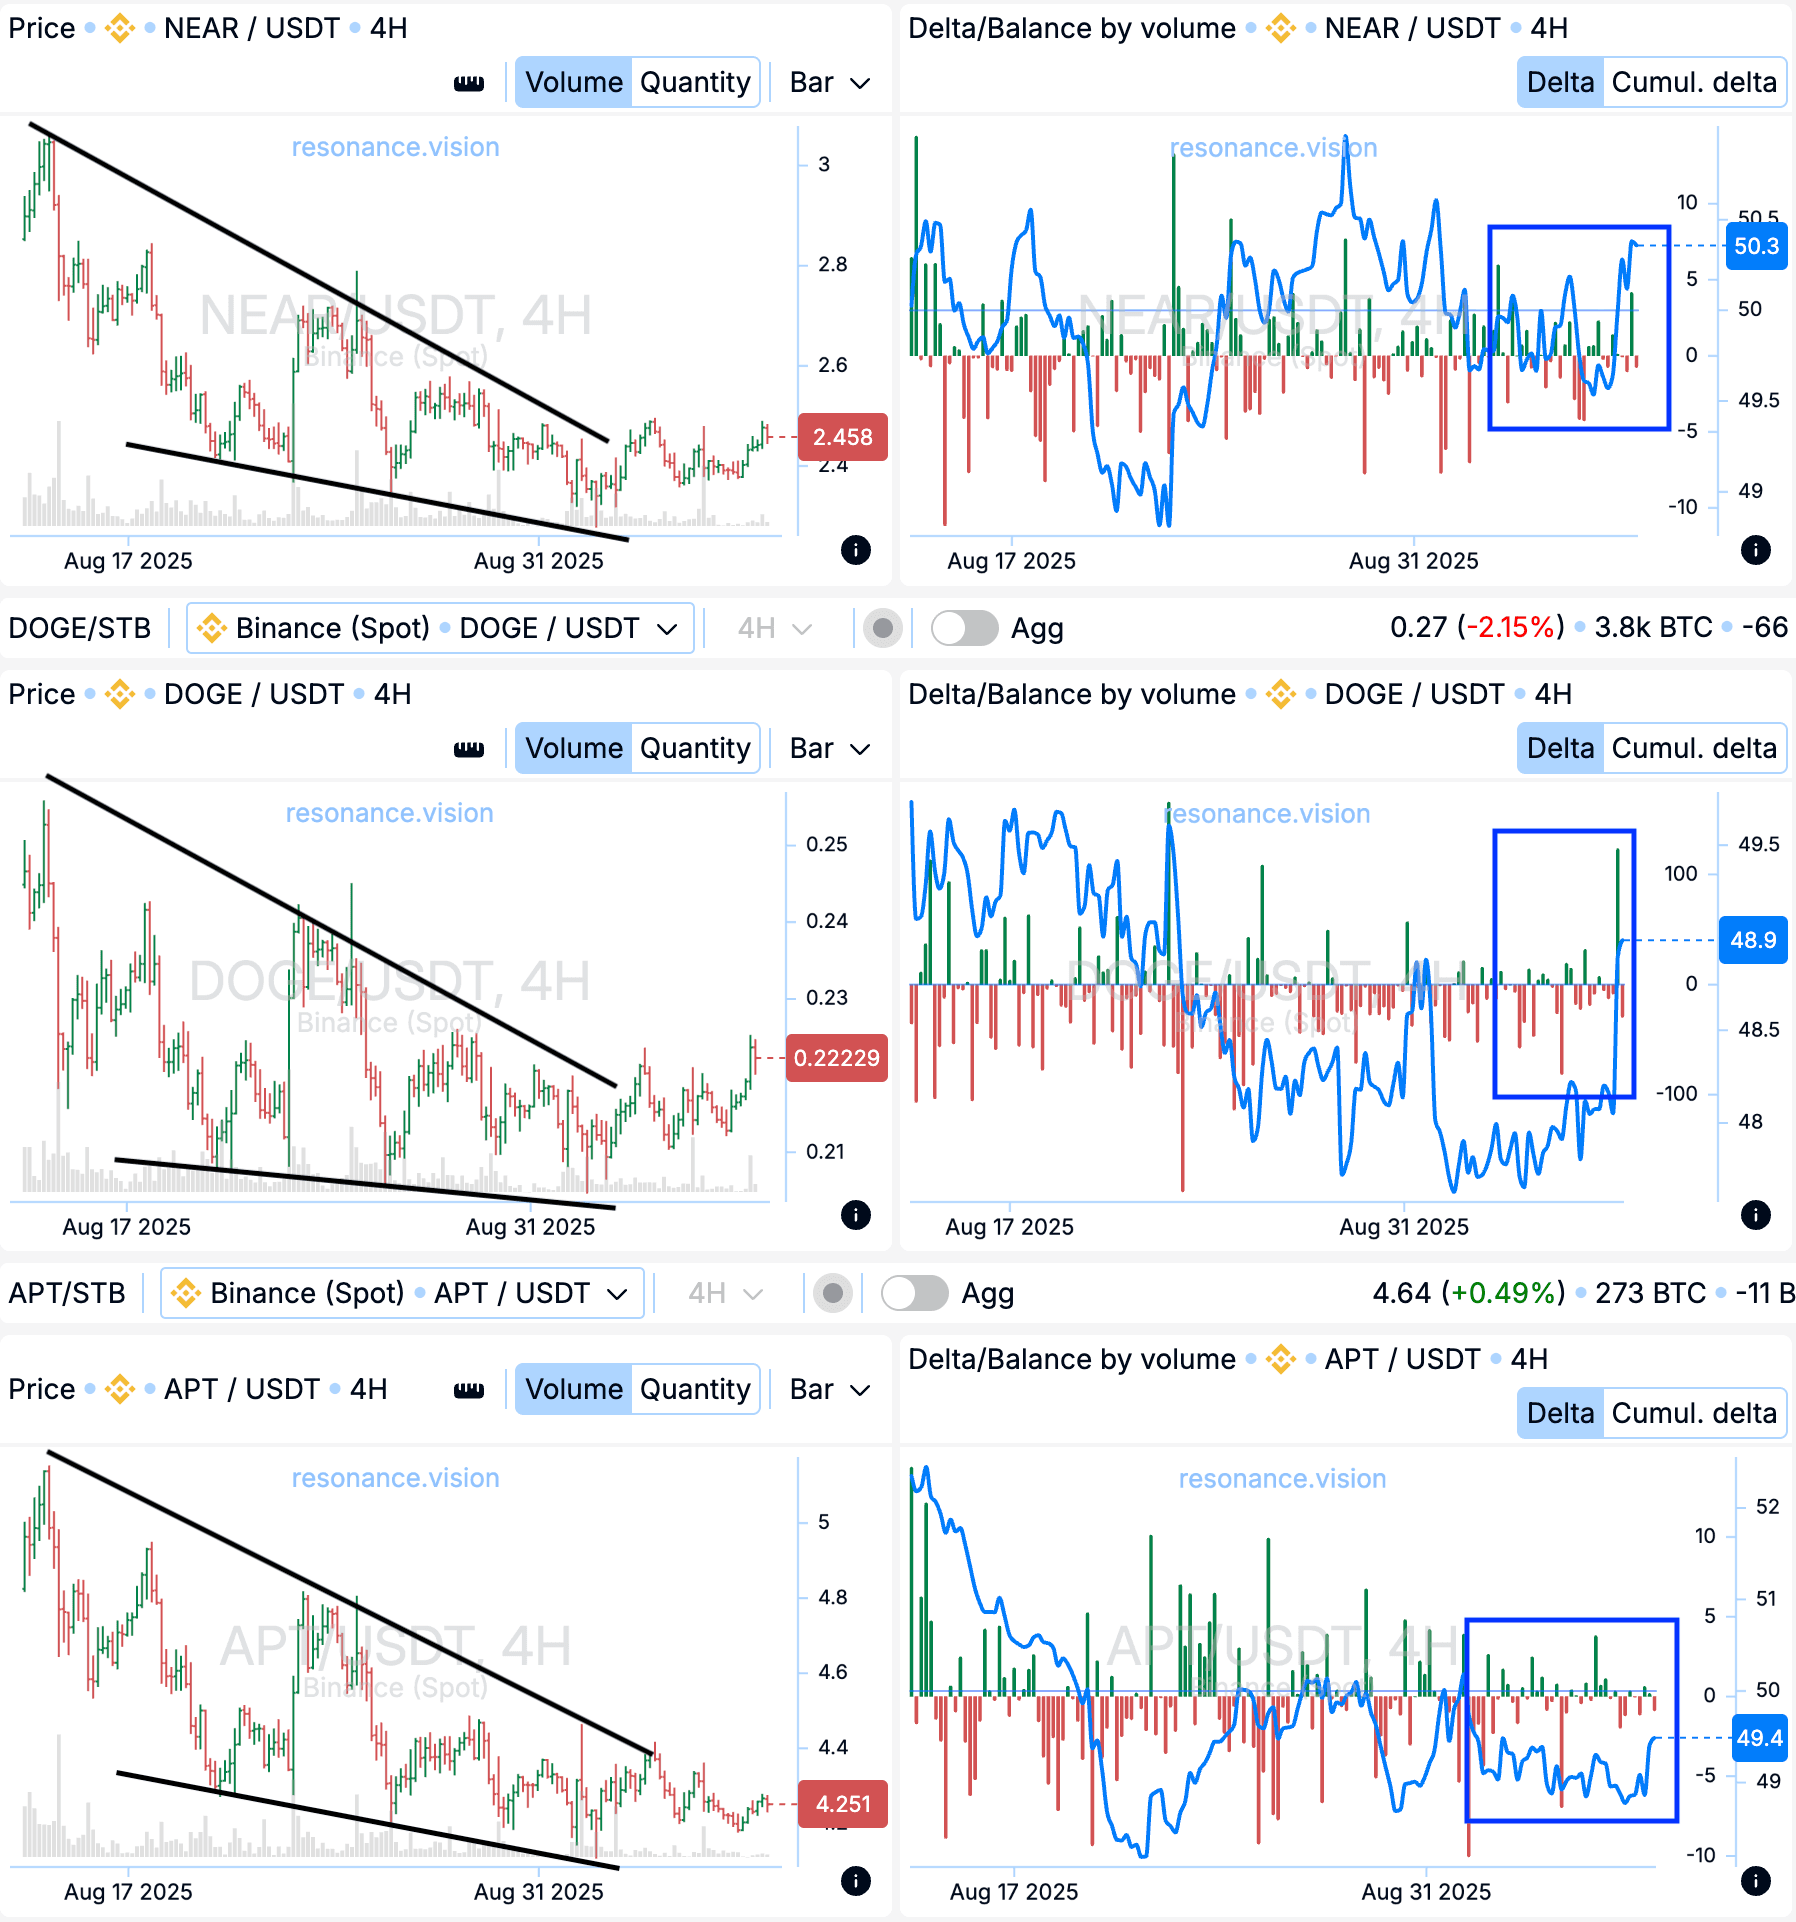
The market delta histogram shows the difference between market buys and sells.
- On the delta histogram, there is no clear confirmation of reduced sellers’ pressure.
- Selling volumes were sometimes the same as before, and sometimes even higher.
- The pressure from sellers remained throughout the downward movement inside the formation.
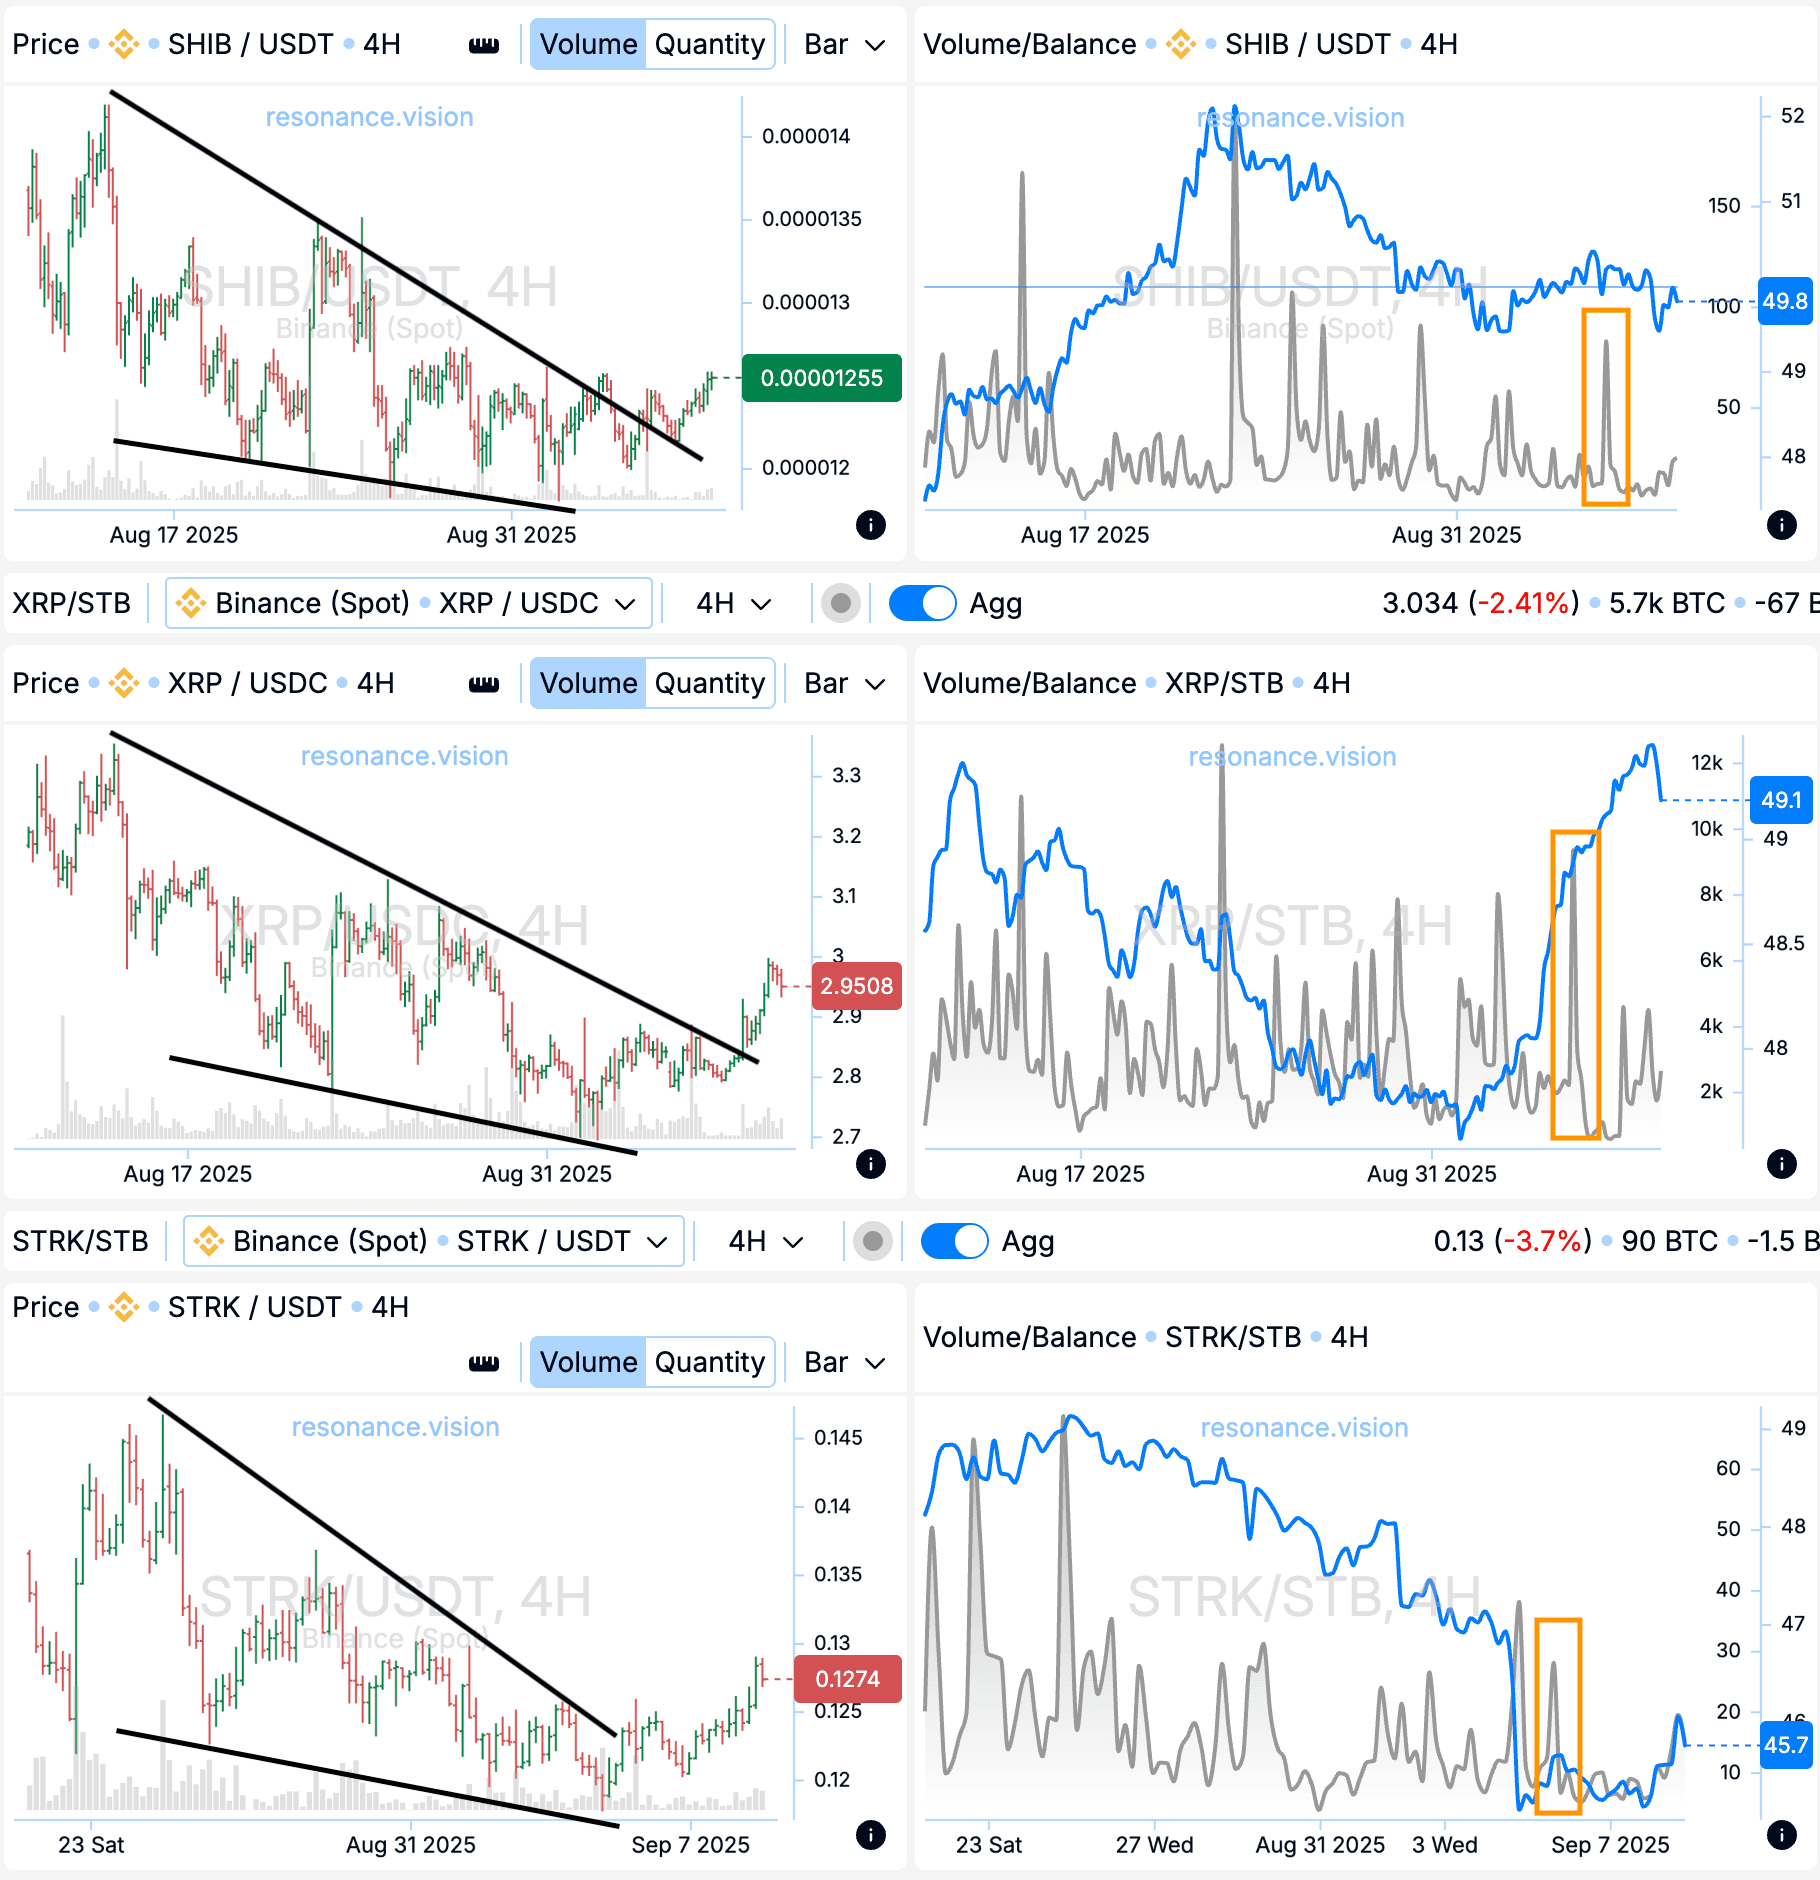
Key point: It is important to highlight situations where market sells did not lead to new price lows (blue rectangles). Previously, even small sells would push the price lower. At the turning point, sells stopped renewing lows (yellow rectangles). This is a signal of demand from buyers.
Conclusion:
- Sellers’ pressure formally did not decrease.
- But it ceased to be effective — the price no longer reacted to market sells with new lows.
- This indicates the emergence or growth of a deficit.
- At this moment, we can assume that buyers started accumulating assets.
To confirm this signal, it is reasonable to use a cluster chart and heatmap, where the activity of limit orders and volume concentration is clearly visible.
Verification of Statement #4: Asset Accumulation by Buyers
The main step in validating the trading falling wedge pattern is the analysis of the cluster chart and heatmap, which allow us to see asset accumulation by buyers during the decline.
Passive demand. It all starts with passive demand, i.e., limit orders. On ADA, APT, DOGE, NEAR we saw that buyers were placing large limit orders as the price declined (green rectangles).
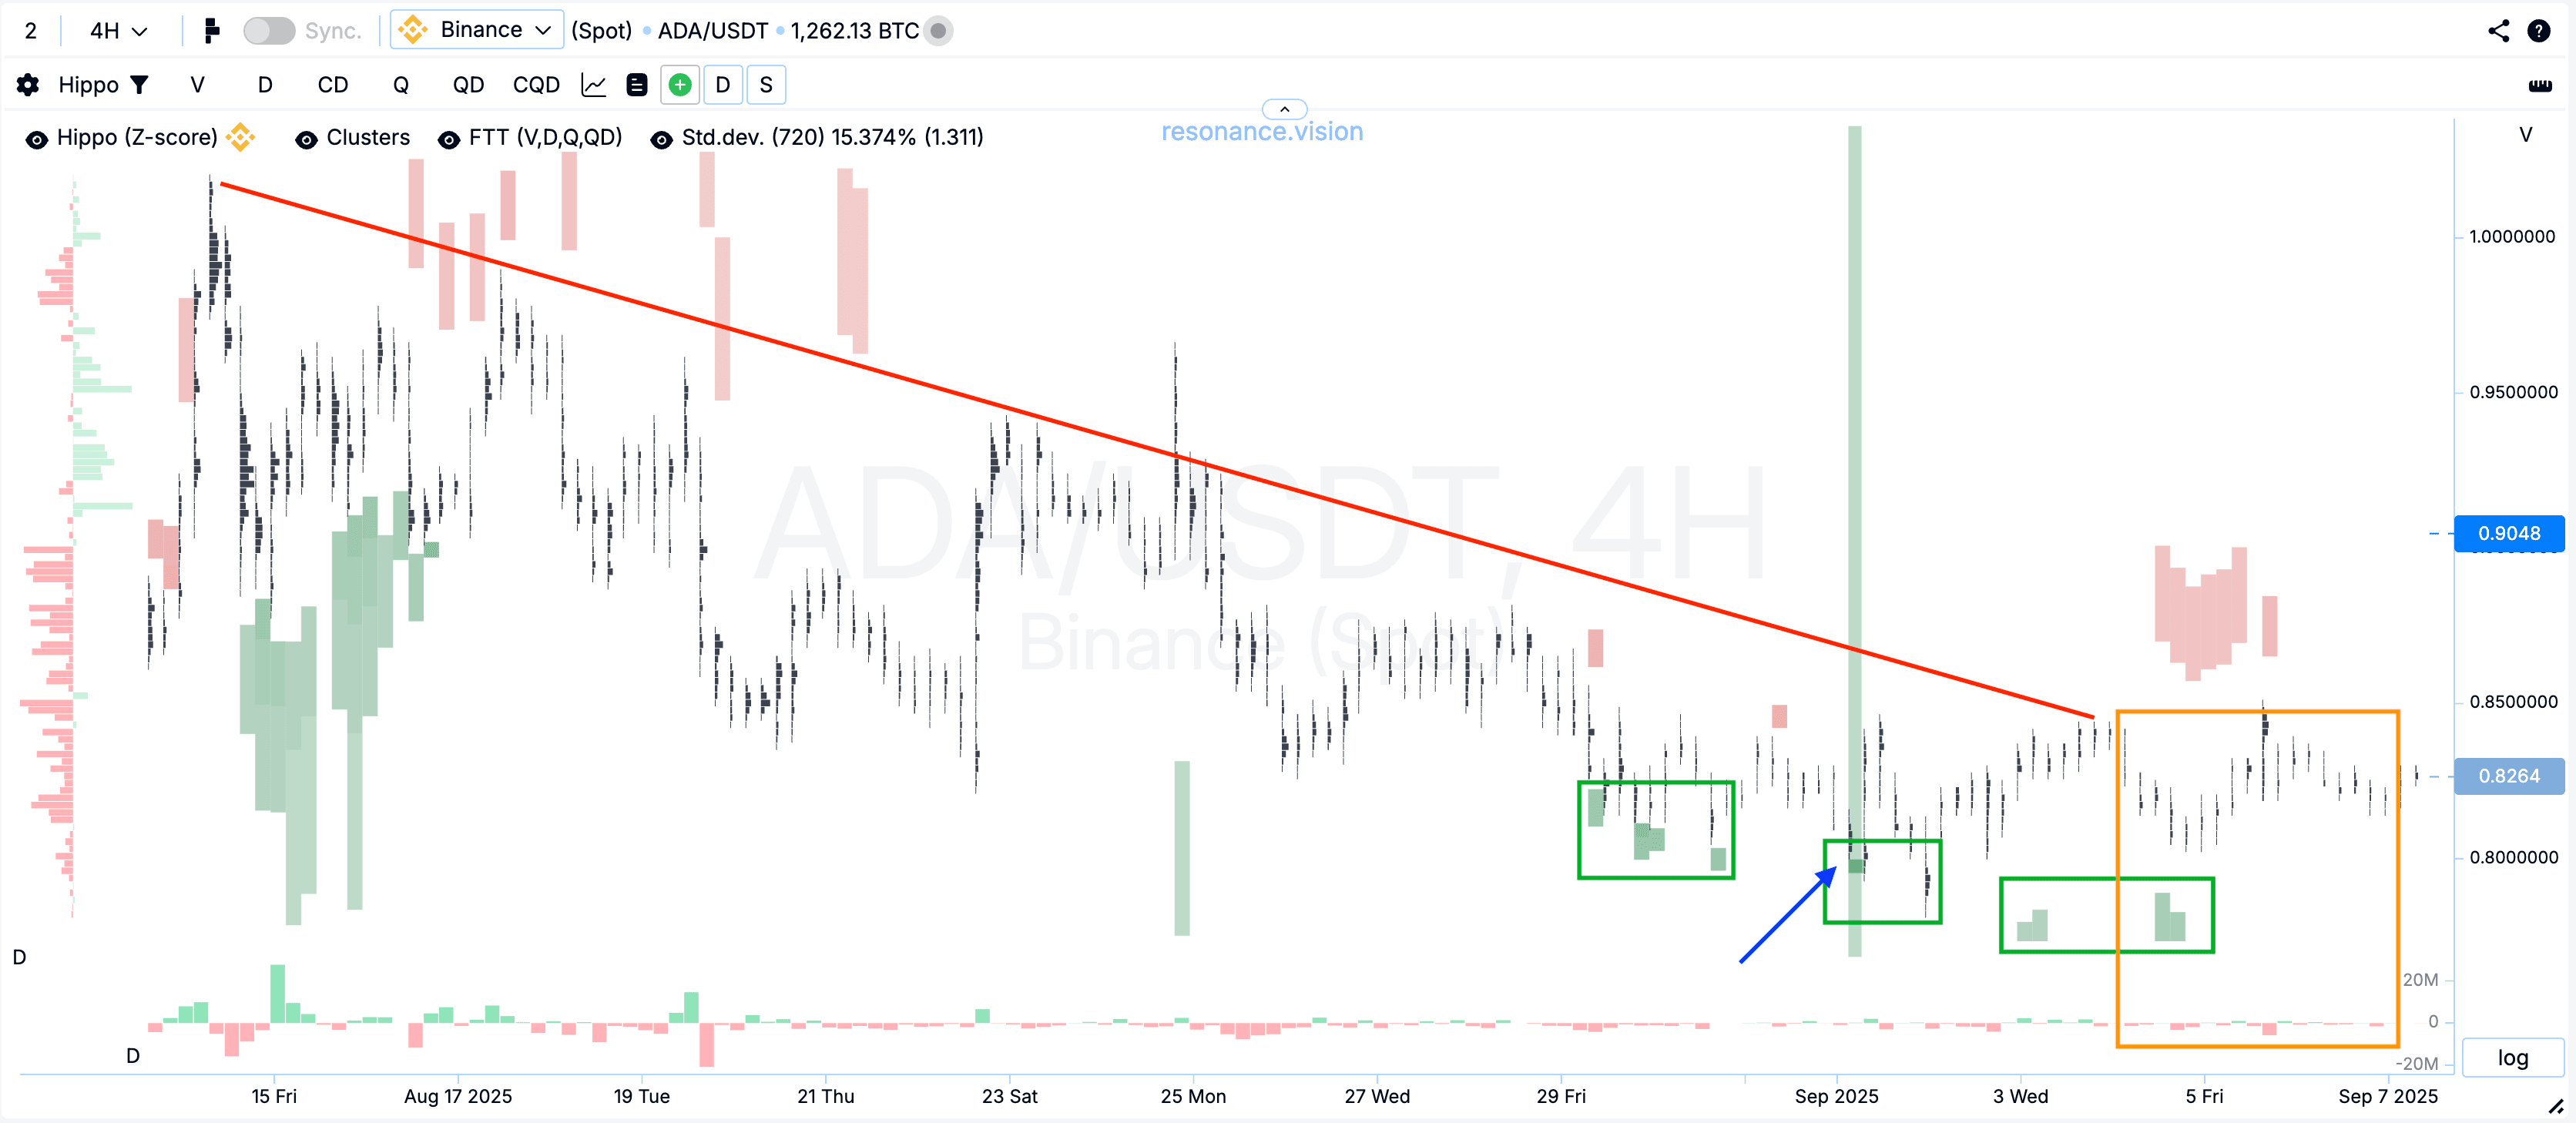
This is confirmed by the heatmap: anomalous “spots” appeared, indicating the presence of large limit orders. These orders were executed and stopped further decline, forming the basis for the upcoming reversal.
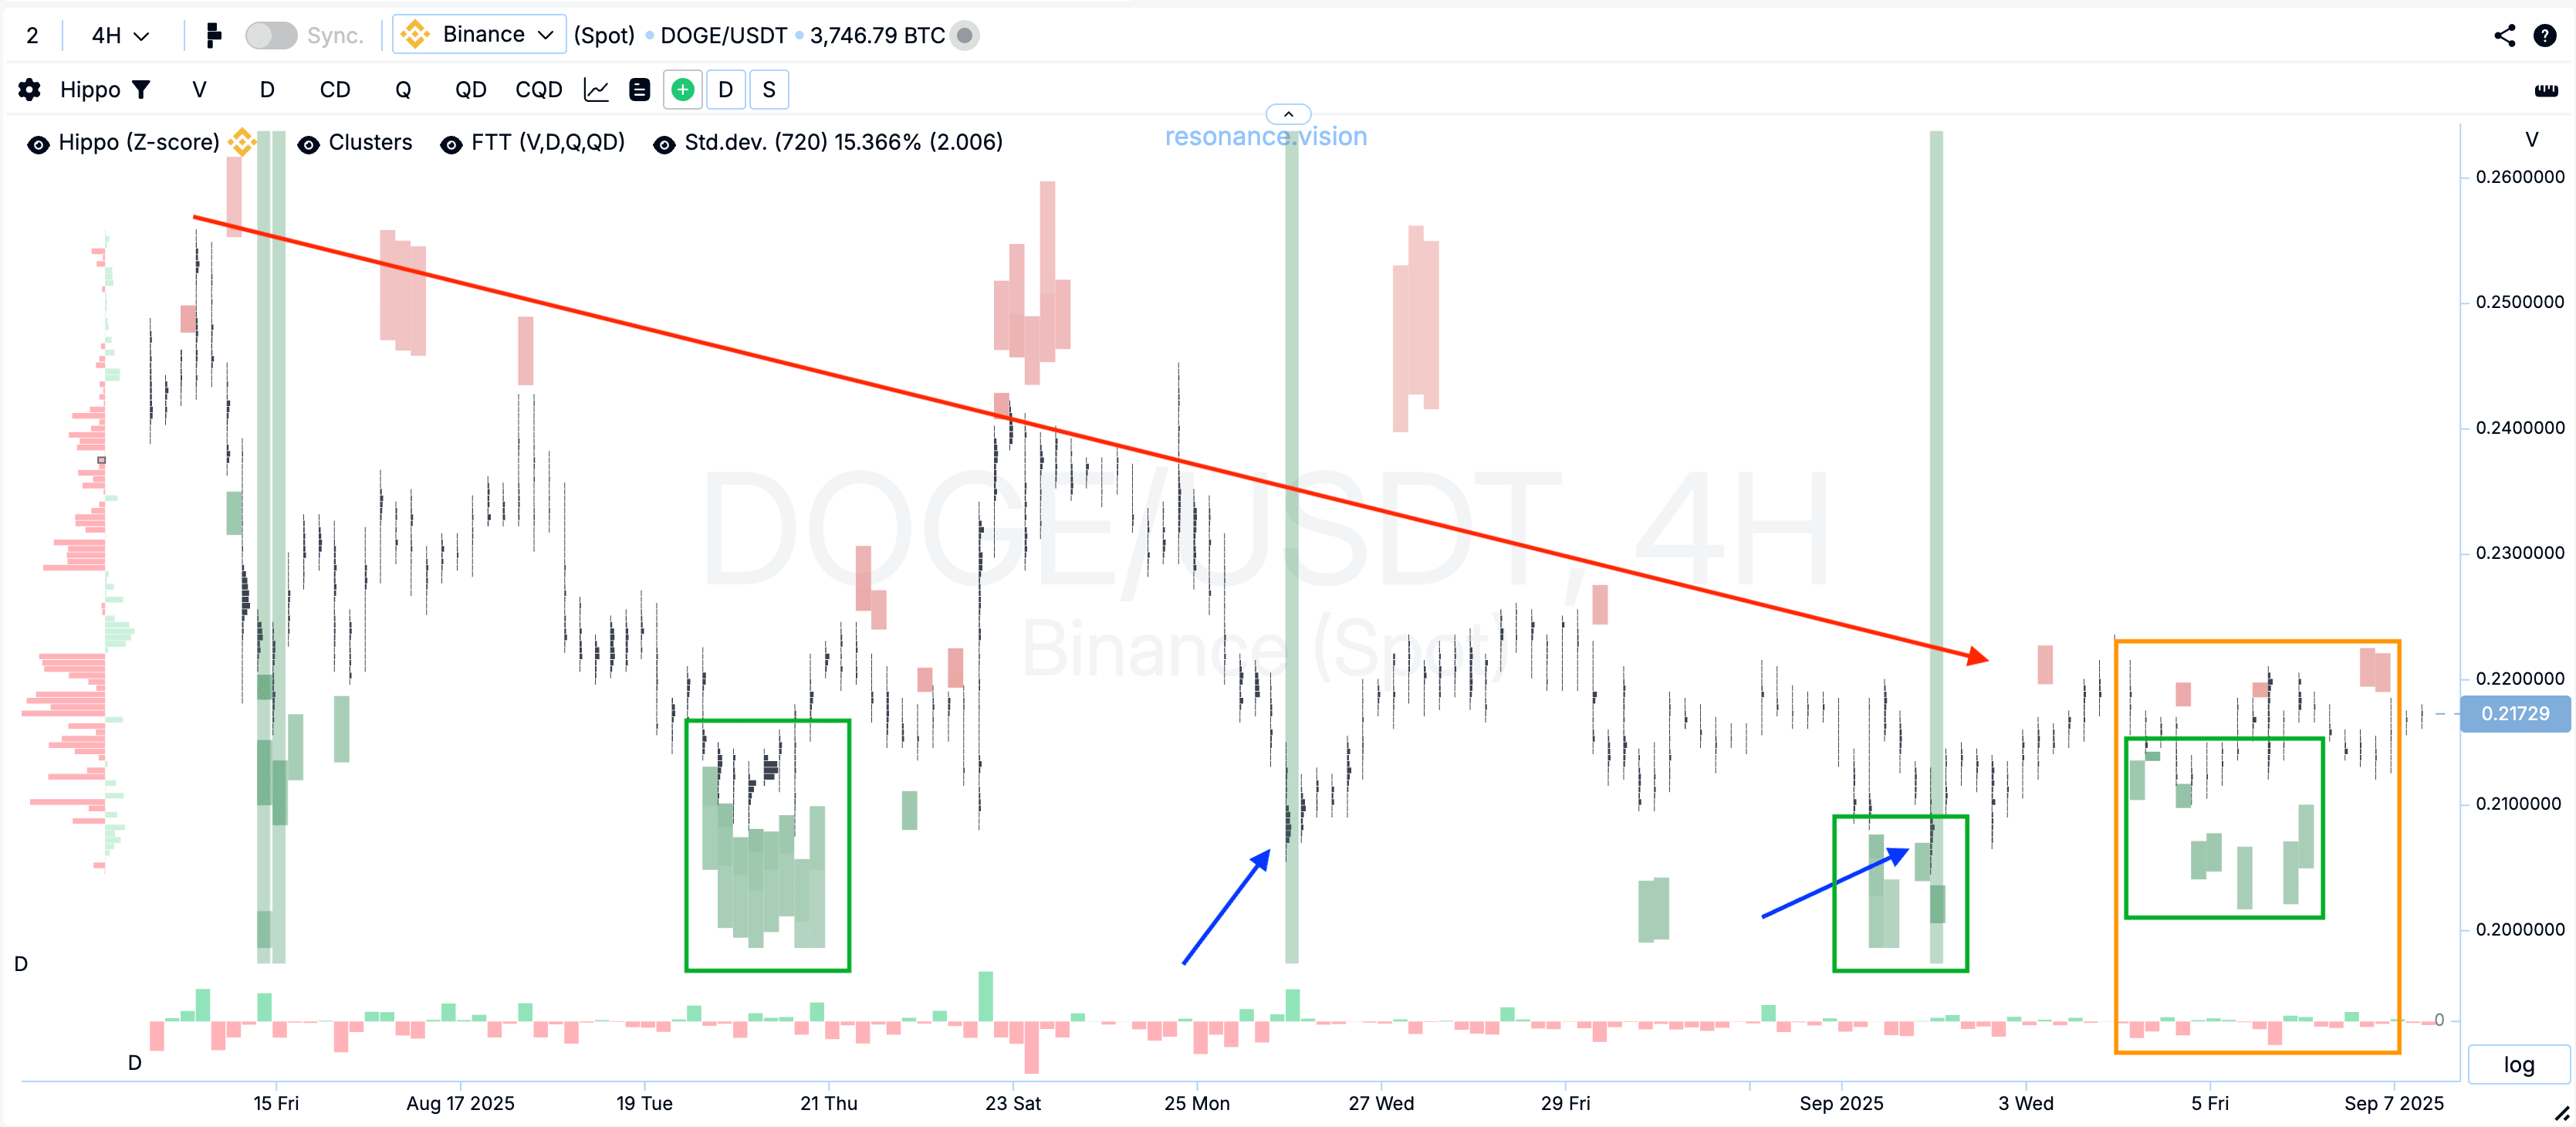
Cluster accumulations. At the bottom of cluster bars, large traded volumes were recorded. This means that at low prices buyers were indeed accumulating assets. These clusters are clearly visible visually and indicate buyer interest in the asset (pink rectangles).
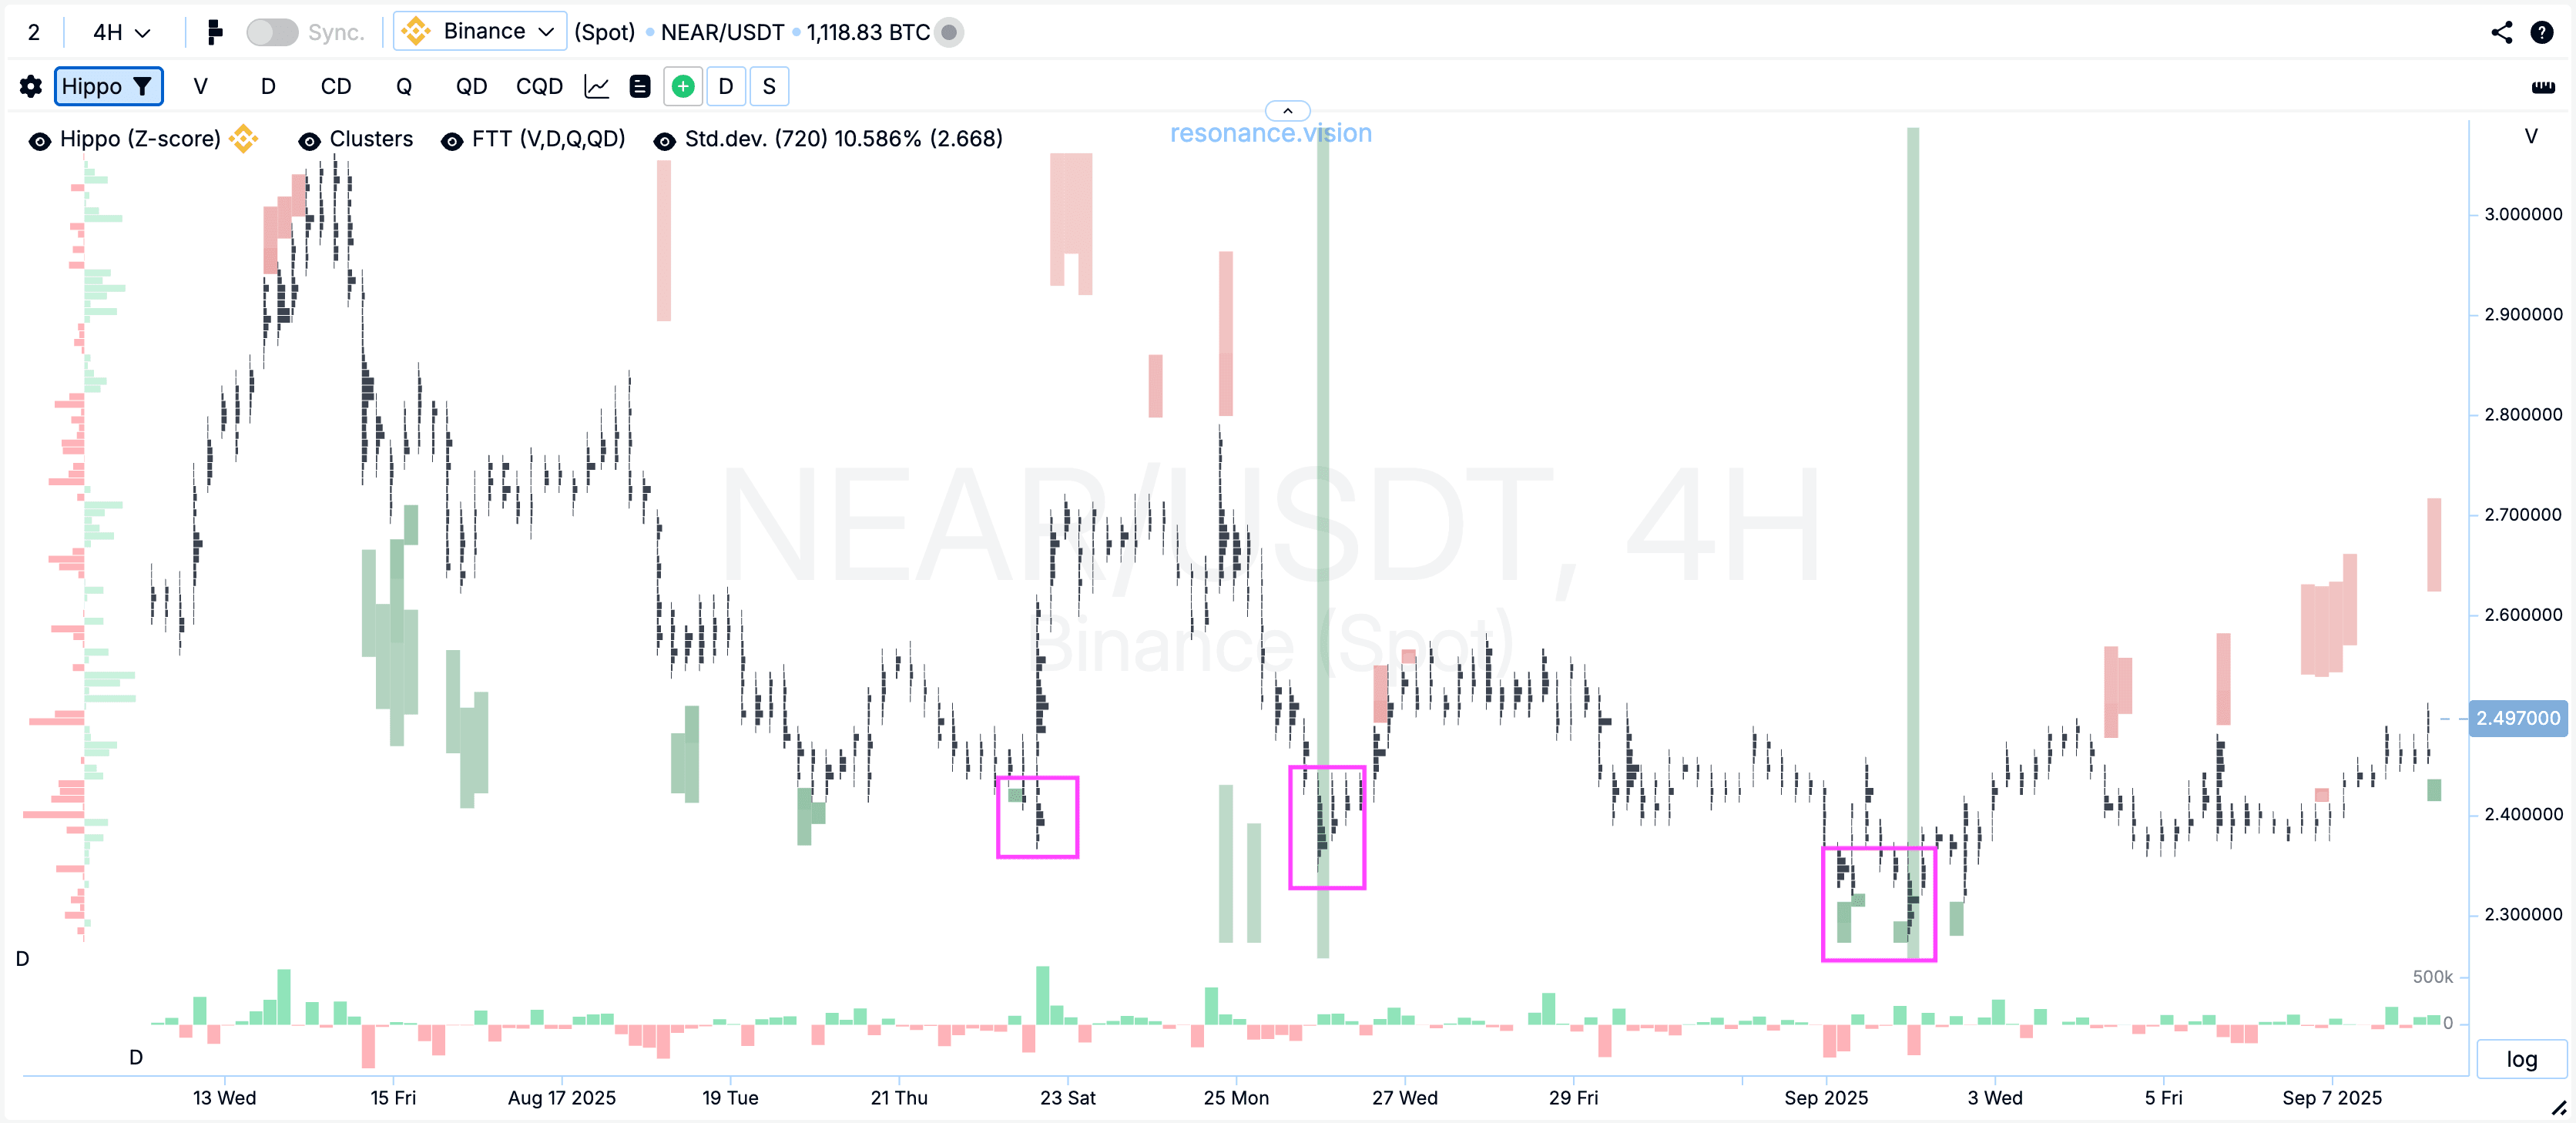
FTT search hints. FTT highlighted areas of market inefficiency with vertical green bars — places where large volumes went through but without significant effect on the price (purple rectangles).
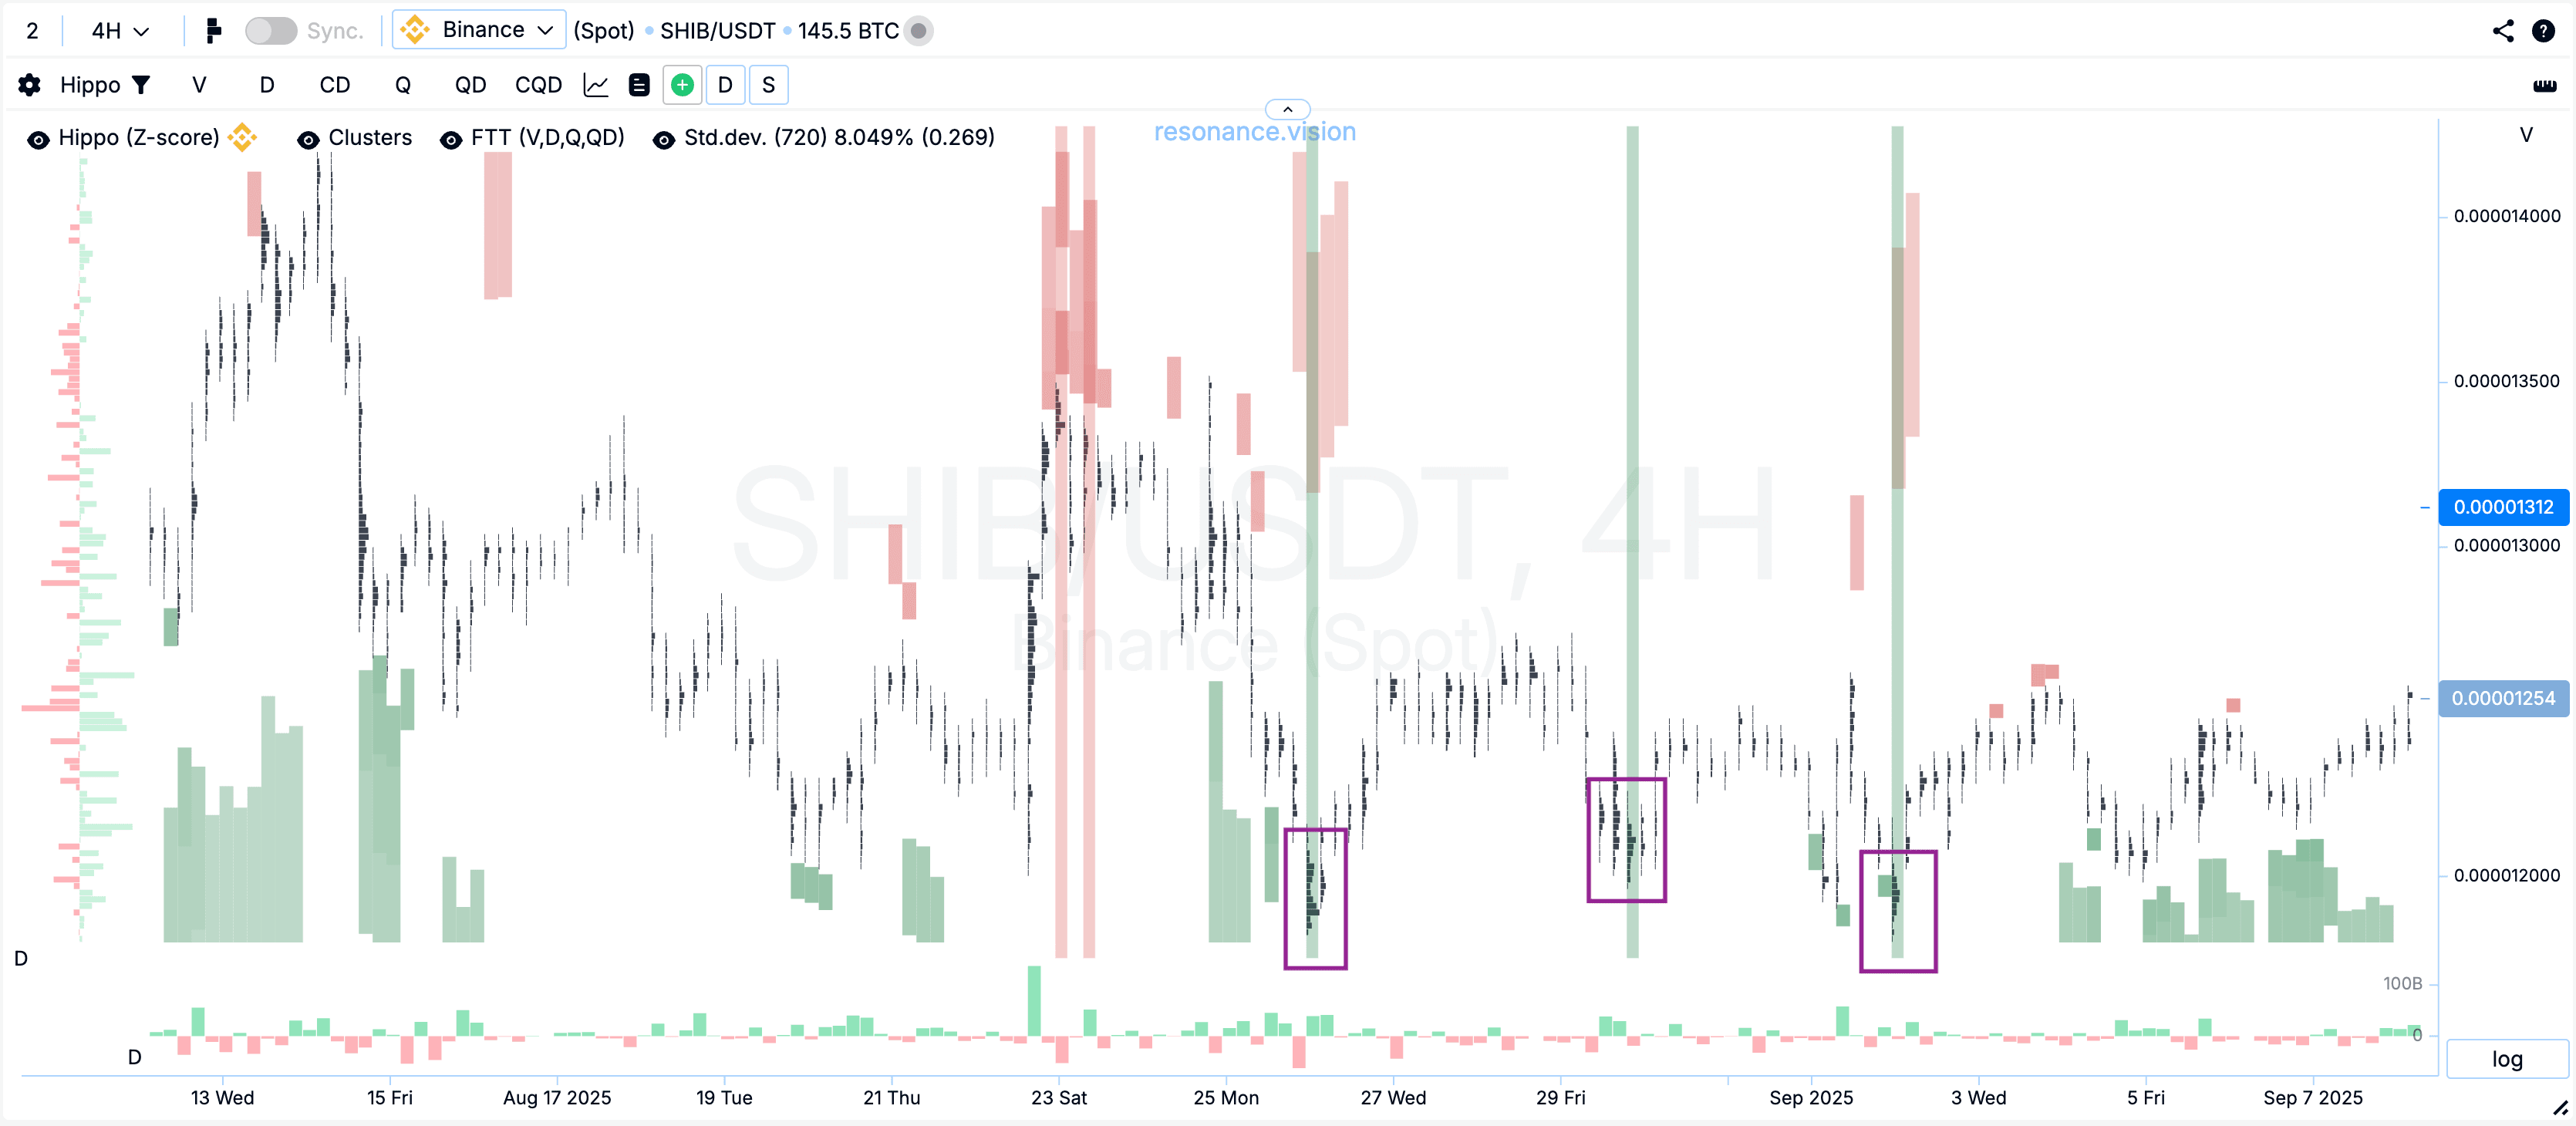
Key moment. The decline lasted until market sells stopped making new lows. This moment is the key confirmation of demand and deficit formation.
Conclusion: The cluster chart and heatmap show that the market was preparing for a reversal. Limit support and large accumulations from below confirmed the presence of buyers’ demand.
Efficiency of Volumes’ Influence on Price
Technical analysis was born and became popular at a time when traders had almost no access to detailed volume data. People tried to find patterns based only on what they had — the price chart. This is how technical analysis formations were invented: simplified models of price behavior, serving as hints when information was limited.
Today the situation has changed dramatically. We know: behind every price movement there is real money of real market participants. These are not just lines on a chart, but actual volumes of deals with which traders vote for growth or decline.
That is why one cannot limit oneself to drawing figures. It is important to assess the efficiency of volumes’ influence on price:
- how effectively sellers reduce the price with their orders;
- how effectively buyers push the price up with their volumes.
For this, the modern trader has the tool “Price change per unit of volume”, which clearly reflects the efficiency of participants’ efforts.
Price Change per Unit of Volume
This tool is especially illustrative as it shows the efficiency of both buyers’ and sellers’ efforts.
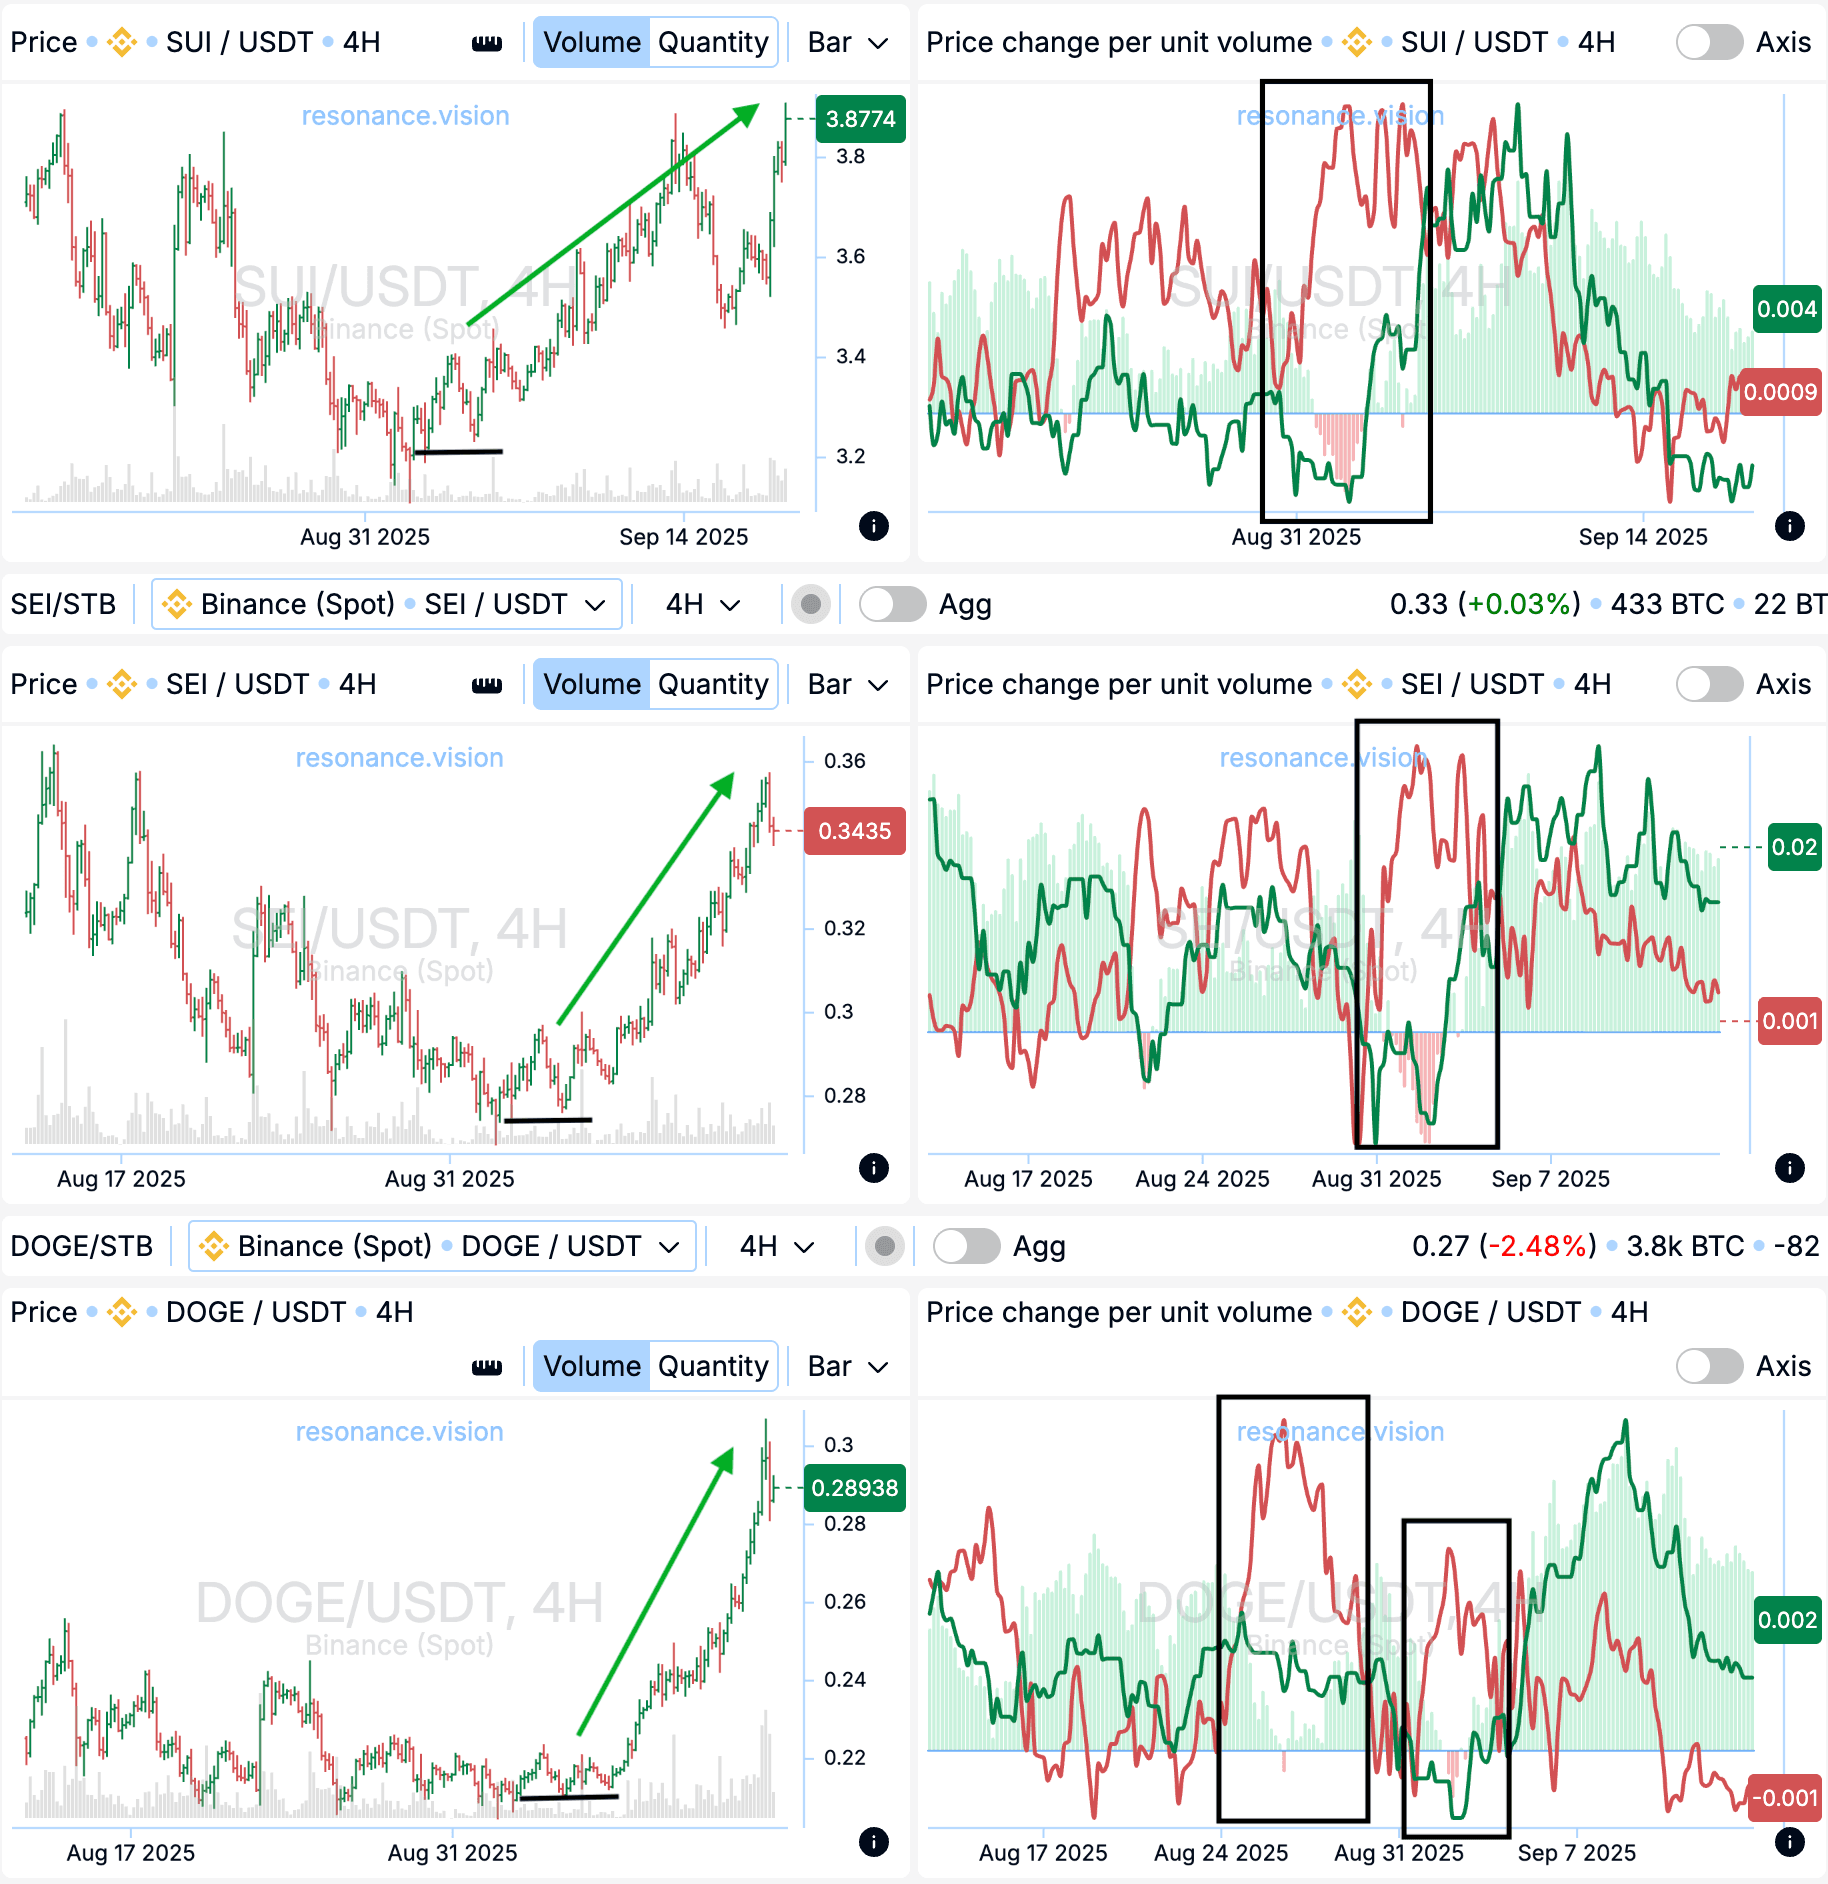
- The red line shows how effectively sellers, with their market orders, pushed the price down.
- The green line shows how effectively buyers, with their market orders, lifted the price up.
In all examples, the same phenomenon was observed:
- The red line gradually decreased, meaning the effectiveness of sellers’ pressure was falling.
- The green line began to grow, meaning buyers’ initiative was strengthening.
- At the divergence of these lines, a so-called “window of opportunity” appeared — a clear indicator of a trend reversal (black rectangles).
Conclusion: The reduction in sellers’ efficiency and the growth of buyers’ impact signal that the market is ready for reversal. It is important to understand:
- sellers’ pressure does not disappear completely;
- but their efforts become less effective;
- buyers take the initiative and push the price upward.
Confirmation of Reversal
To validate the trading falling wedge pattern, it is important to look not at the geometry of the formation, but at volumes and their influence on price.
Here is a checklist of key signs:
- Market sells cannot push the price below the previous low.
- Before the reversal, buyers’ interest increases — large limit orders form passive demand.
- At the bottom of cluster bars, anomalous accumulations are visible.
- The FTT search tool shows market inefficiency at extremes.
- The “Price change per unit of volume” tool shows a clear divergence indicating initiative shift:
– the red line (sellers’ efficiency) starts falling;
– the green line (buyers’ efficiency) starts growing.
Result: Validation of the falling wedge formation through volumes confirms the market’s readiness for growth.
Conclusion
The trading falling wedge pattern cannot be perceived as a “ready” long reversal formation. Its strength is revealed only when a deficit is actually formed in the market.
Volumes are the real money of market participants. They are the way traders vote for the rise or fall of an asset. That is why any technical analysis pattern, even if you trade it, must be validated through volume analysis.
Today, in the 21st century, there are enough tools not to limit yourself to geometry. On the Resonance platform, professional solutions are available for traders and investors:
- cluster chart;
- heatmap;
- delta balance by volume;
- price change per unit of volume;
- FTT reversal formations search tool.
By using these tools, a trader gets objective market information and can validate trading ideas with effective analytics before opening positions. Only in this way can crypto trading strategies become sustainably profitable, and technical indicators like the falling wedge turn into the best working tools on the market.
Follow new insights in our telegram channel.
No need to invent complex schemes and look for the "grail". Use the Resonance platform tools.
Register via the link — get a bonus and start earning:
OKX | BingX | KuCoin.
Promo code TOPBLOG gives you a 10% discount on any Resonance tariff plan.
Recommended articles


