ATOM +14.7% (Resonance Directional Strategy)

Trade analysis based on cluster analysis 📊 Market sell-offs dominate without breaking the minimum, forming a local deficit and confirming through cumulative and limit deltas. Profit-taking occurs after a statistically significant move and signs of a surplus.
Table of contents

Asset: ATOM/USDT
Risk: medium
Level of understanding: beginner
Entry reasons
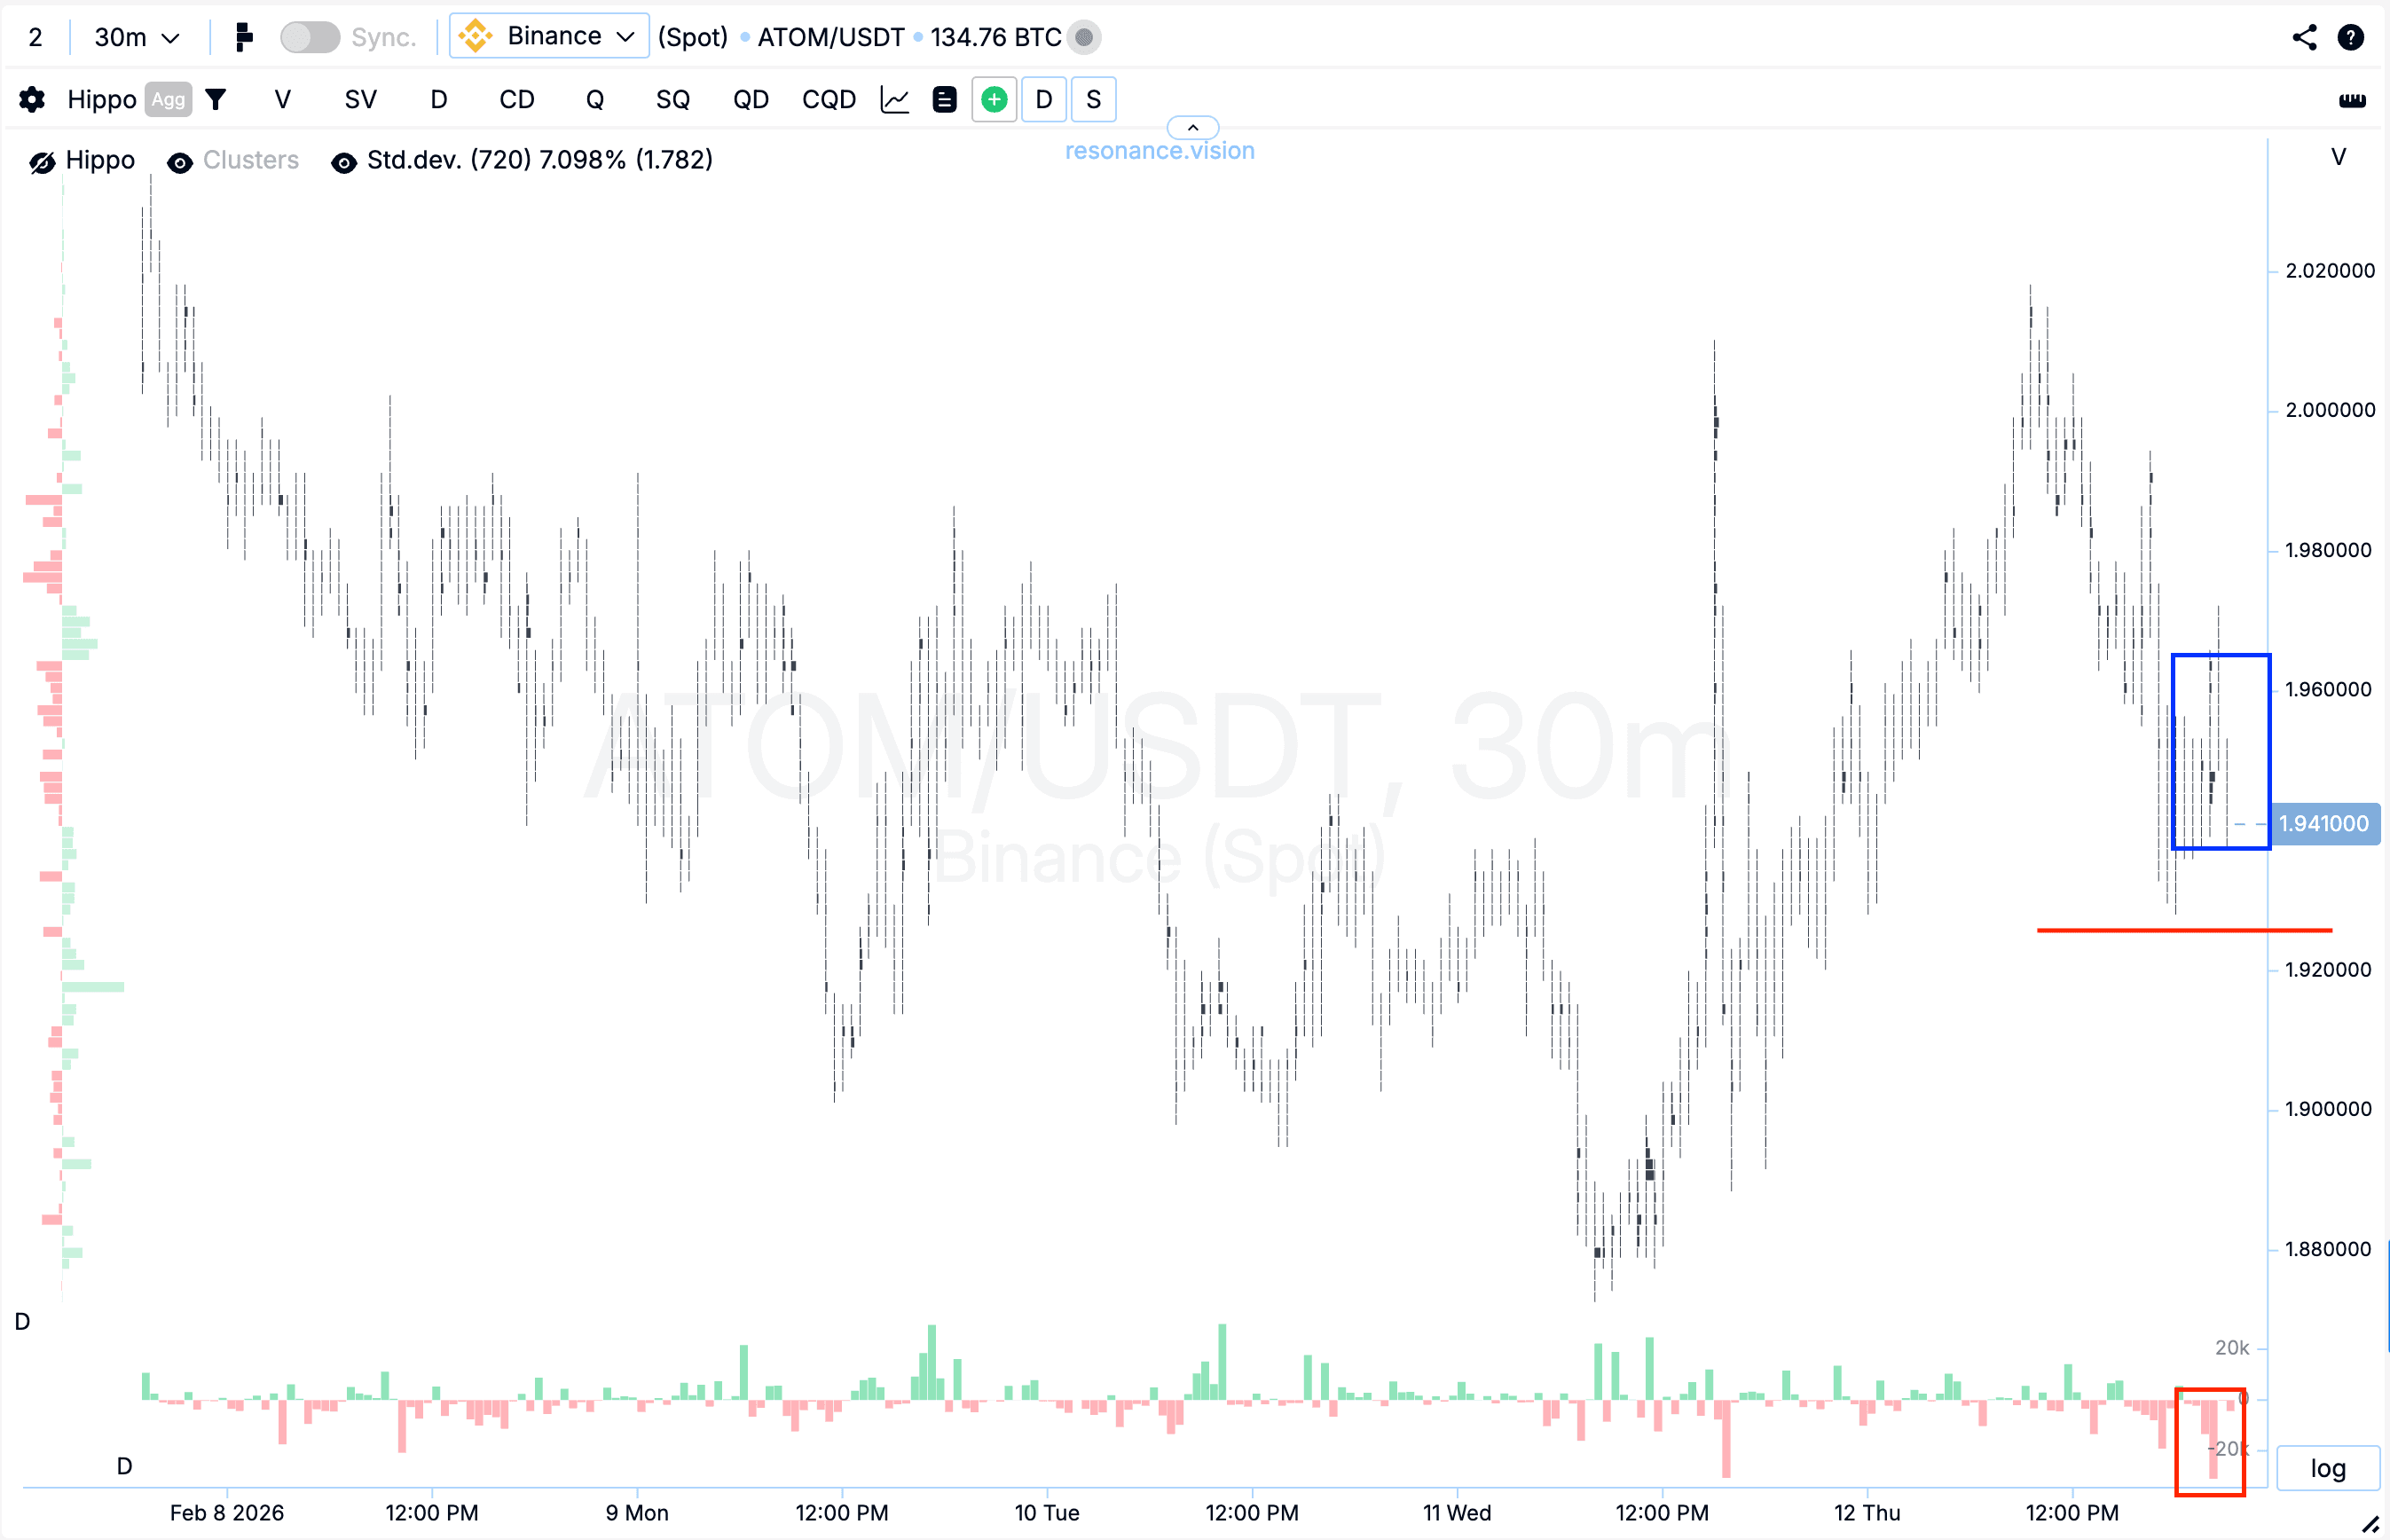
Cluster chart: locally during the pullback, relatively large volume clusters were formed (blue rectangle), within which a noticeable dominance of market sell orders was observed. However, these sales no longer demonstrated their previous effectiveness and did not lead to an update of the local minimum (red rectangle and line).
Such market behavior indicates growing demand and the formation of signs of a local deficit: sellers continue to actively expend volume, but their impact on price becomes increasingly ineffective. Such inefficiency of pressure often precedes a shift in initiative.
In the Dashboard
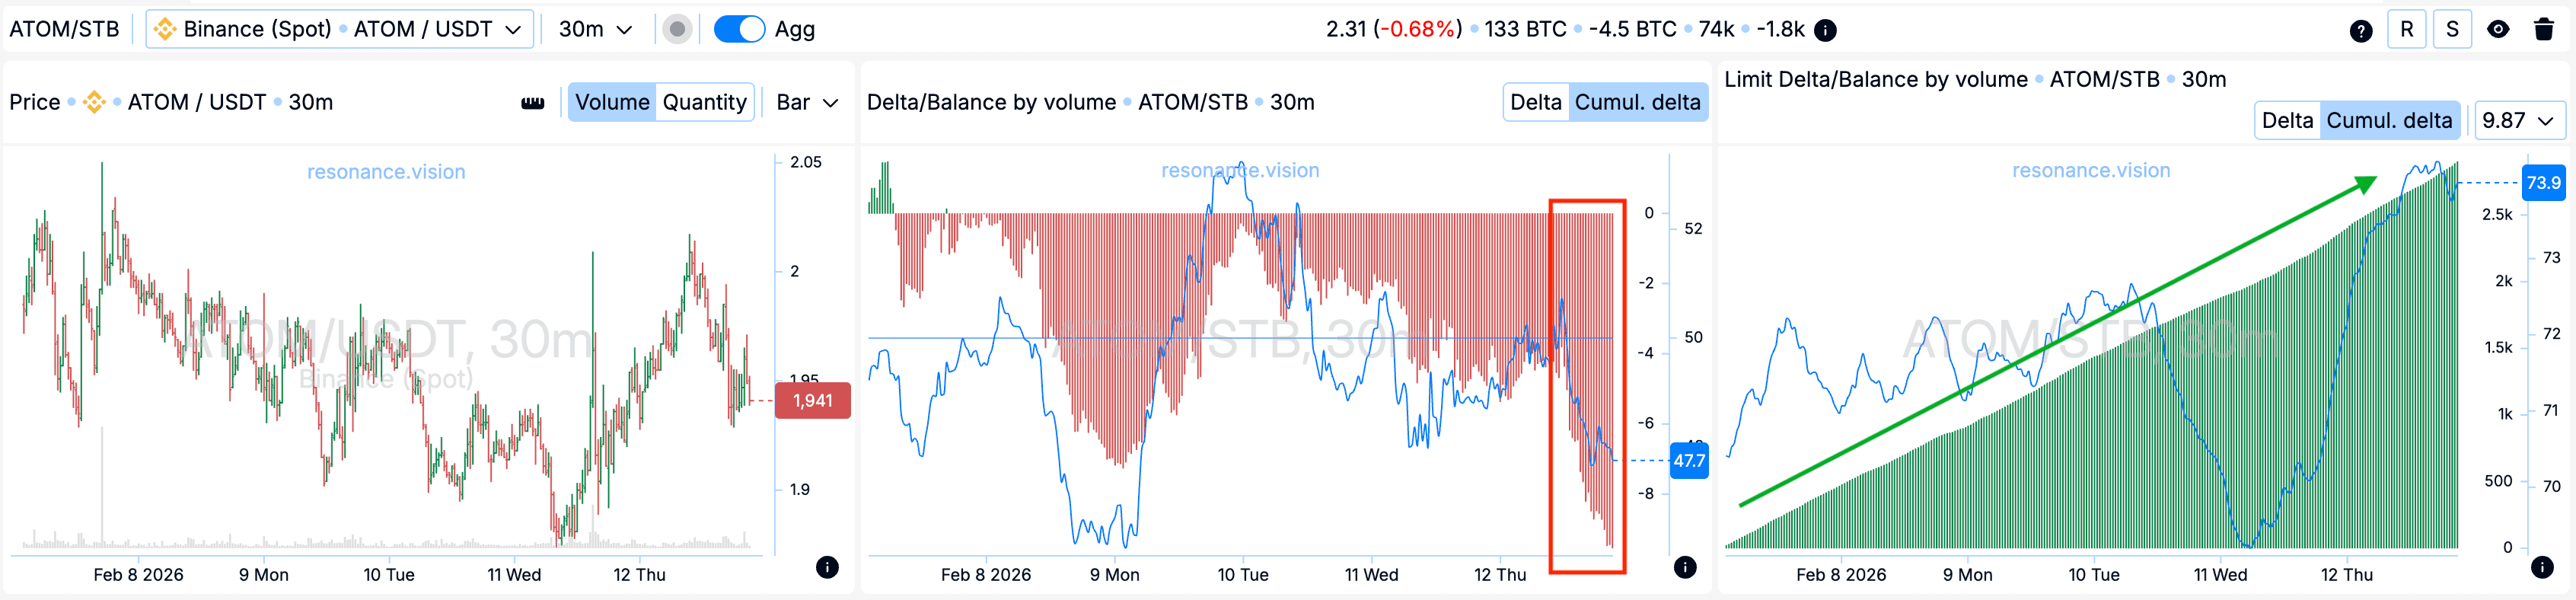
Delta / Volume balance and limit delta: aggregated data across all pairs and exchanges confirms the observations from the cluster chart. During the analyzed period, the market was under pronounced cumulative pressure from market sell orders, which is clearly visible on the cumulative delta histogram (red rectangle).
At the same time, the limit delta shows a sustained cumulative increase in limit buy orders (green arrow). Such a combination indicates active absorption of incoming market sell volume by limit buyers. As a result, local support is formed within the current price range, further confirming signs of supply deficit.
Exit reasons
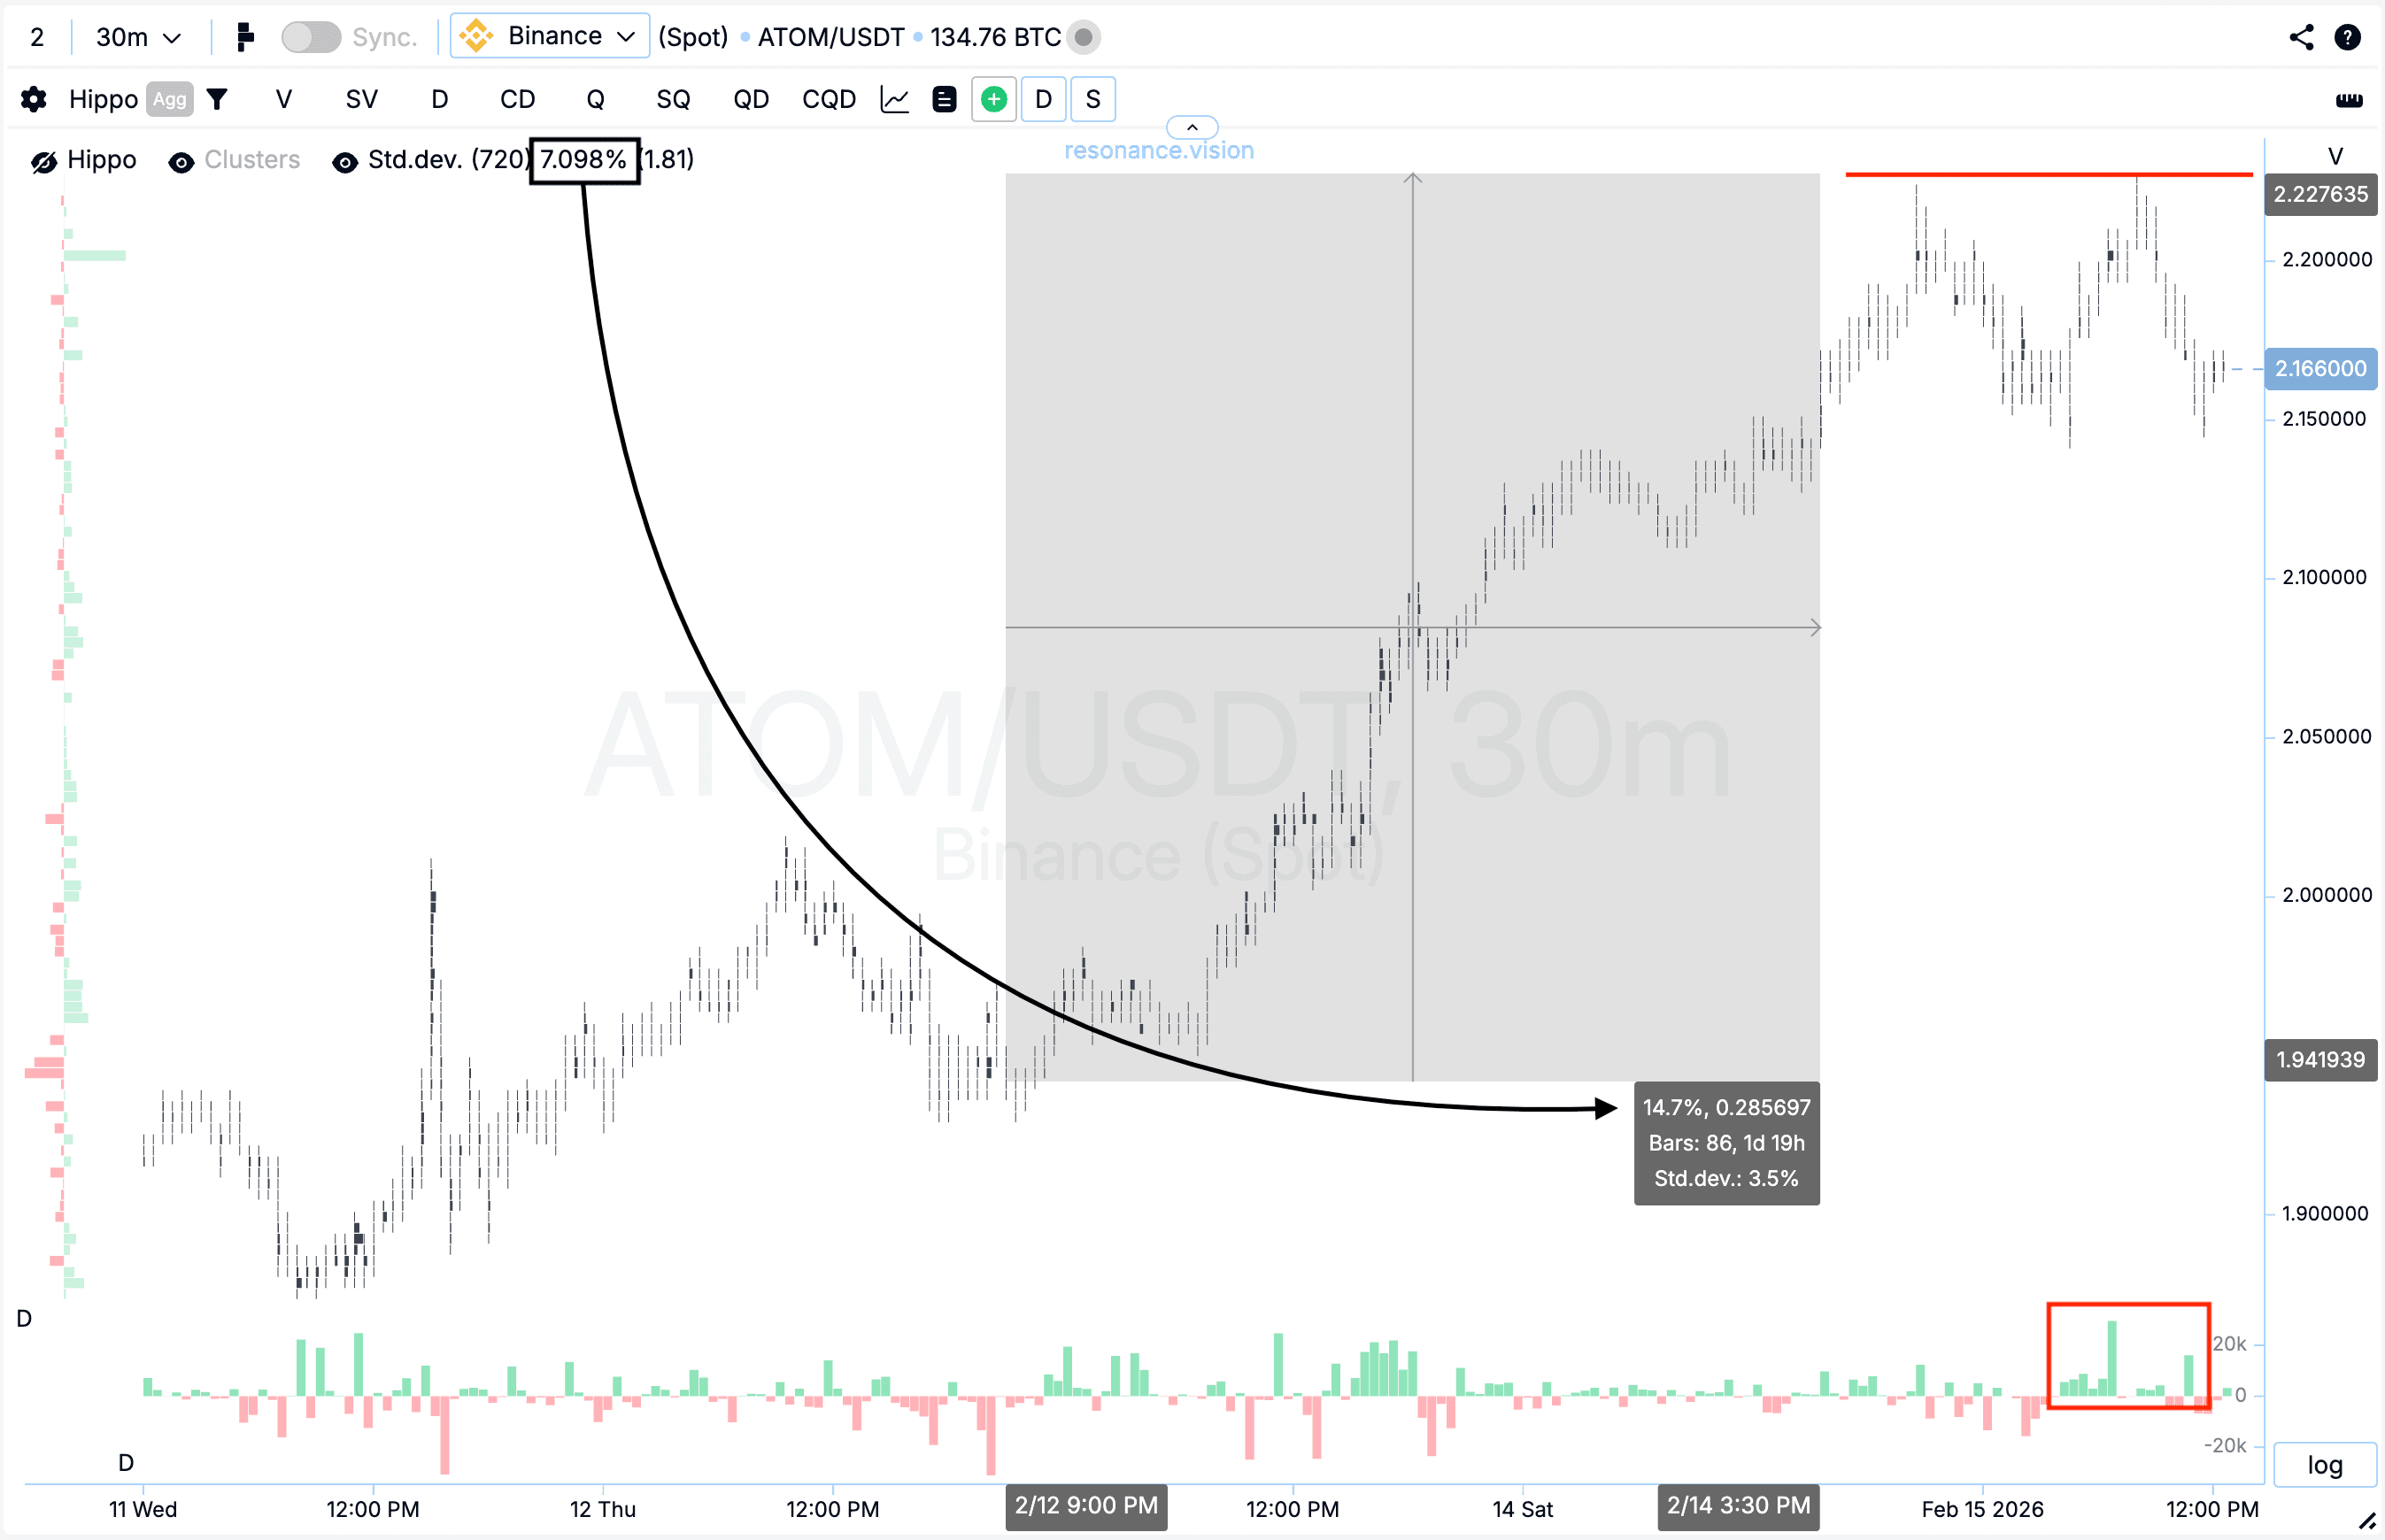
Cluster chart: after the entry point, the price moved approximately 15%, which represents a strong price movement and corresponds to more than two standard deviations, meaning it carries a statistically anomalous character (black rectangle and arrow).
Against the background of this movement, an M-shaped formation developed, within which subsequent volumes of market buys no longer led to an update of the local maximum (red rectangle and line). This indicates a decrease in buyer effectiveness and the appearance of signs of a local surplus.
Under such conditions, further position holding is accompanied by increased risk, therefore profit-taking appears to be the most rational and balanced decision.
Conclusion
In this analysis, the key factor once again was not the magnitude of volume itself, but its effectiveness. Despite pronounced pressure from market sell orders, the price stopped updating lows, indicating the formation of a local deficit and a gradual shift in initiative toward buyers.
Confirmation through aggregated data and the growth of limit demand strengthened the validity of the entry, as the market structure demonstrated active absorption of supply.
The exit from the position was driven by a statistically significant movement and the appearance of signs of surplus — when subsequent market buys stopped being effective.
Such an approach allows for systematic work with states of deficit and surplus, evaluating not merely volume, but its impact on price, which significantly improves the quality of trading decisions over the long term.
Follow new insights in our telegram channel.
No need to invent complex schemes and look for the "grail". Use the Resonance platform tools.
Register via the link — get a bonus and start earning:
OKX | BingX | KuCoin.
Promo code TOPBLOG gives you a 10% discount on any Resonance tariff plan.
Recommended articles


