CHZ +30.7% (Направленная стратегия Резонанс)

Объёмный разбор актива с акцентом на кластеры, дельту и баланс спроса/предложения. Вход от локального дефицита, выход - при ослаблении инициативы покупателей и росте встречного давления.
Содержание

Монета: CHZ/USDT
Риск: средний
Уровень понимания: новичок
Причины входа
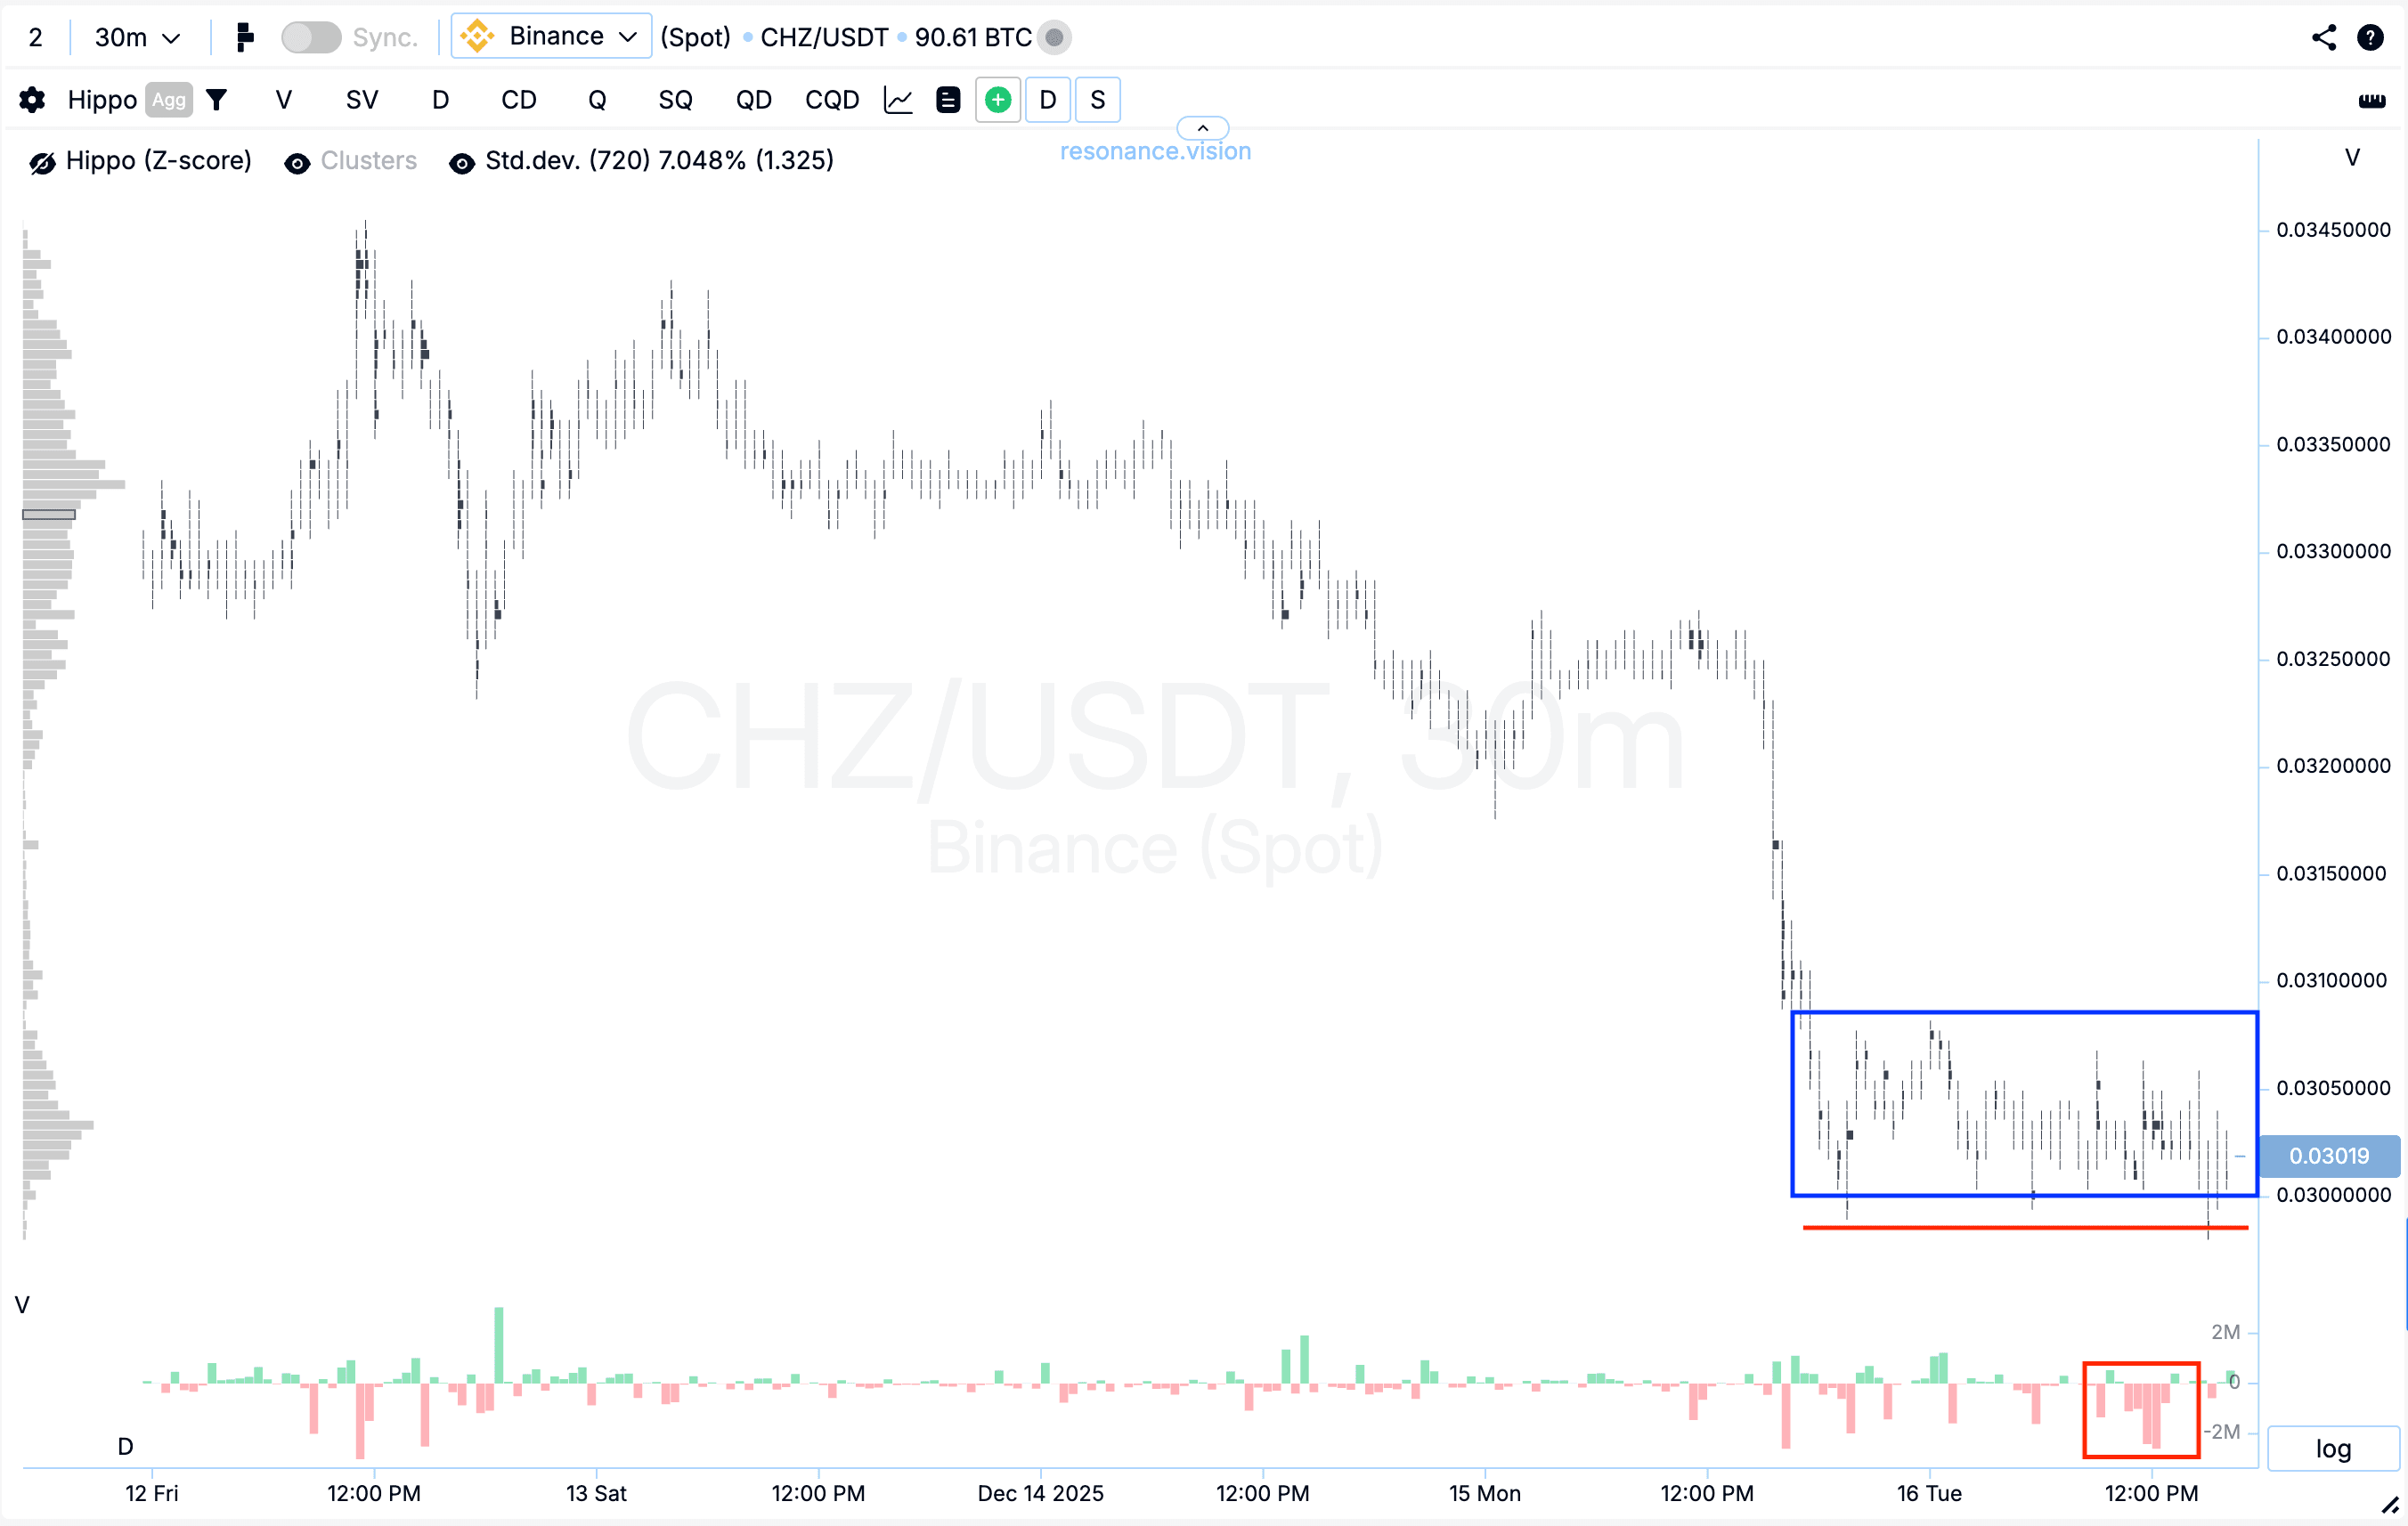
Кластерный график: на снижении начали формироваться крупные объёмные кластеры (синий прямоугольник), внутри которых проходили значительные объёмы продаж. Однако, несмотря на это давление, цена перестала реагировать на продажи и не обновляла локальный минимум (красный прямоугольник и линия). Такая реакция рынка указывает на появление признаков локального дефицита и постепенное ослабление давления со стороны продавцов.
В Дешборде
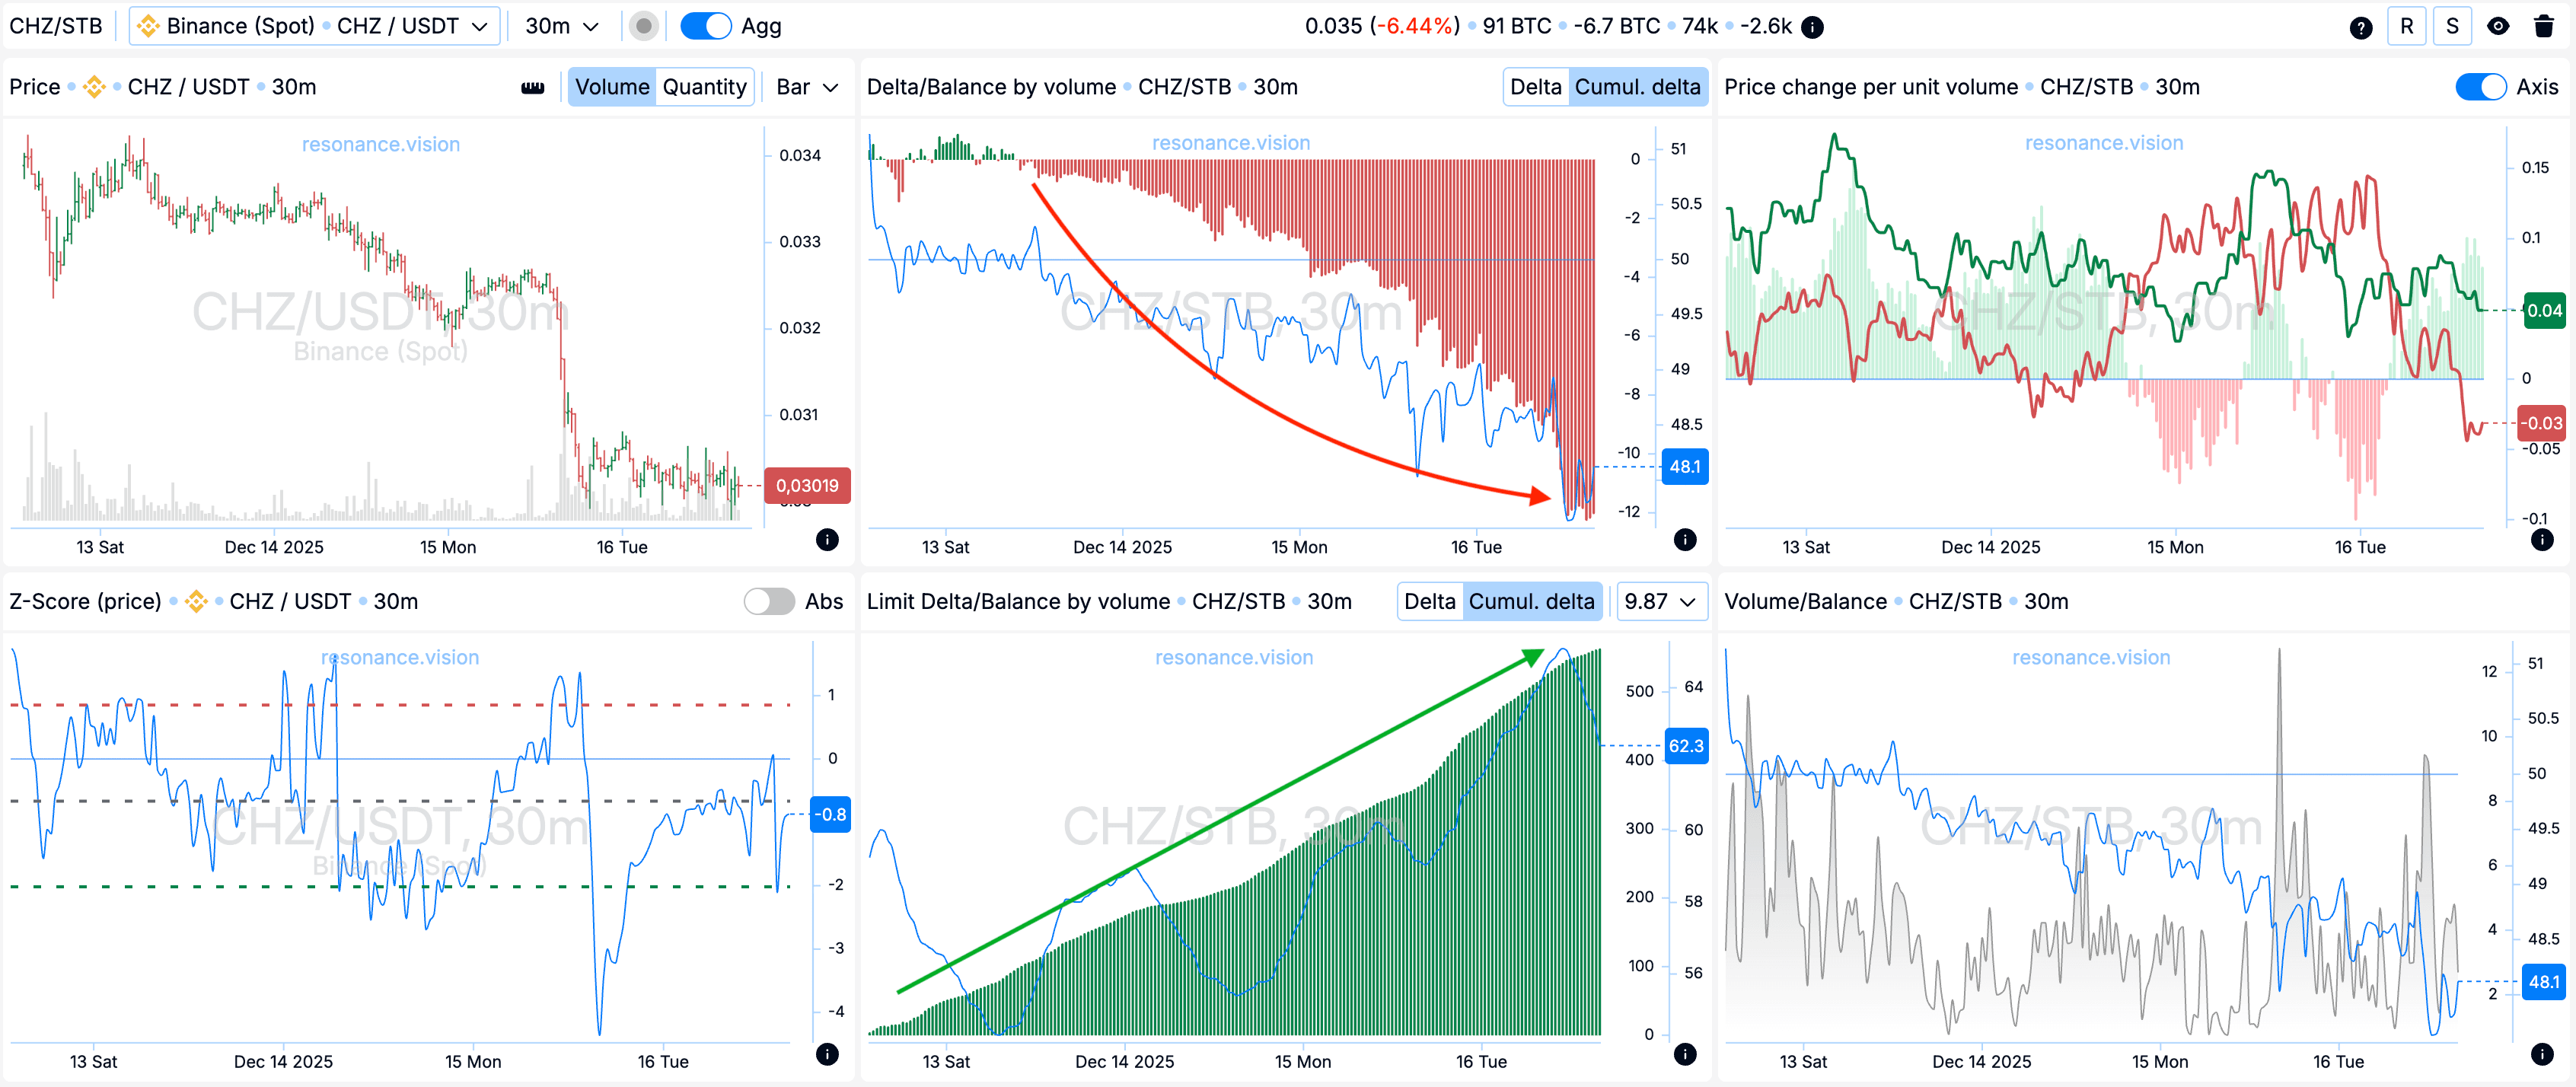
Дельта / Баланс по объёму и лимитная дельта: при анализе агрегированных данных по всем парам и биржам наблюдается подтверждение картины, отмеченной на кластерном графике. В рассматриваемый период по рынку доминировали увеличивающиеся объёмы маркет-продаж, что отчётливо видно по гистограмме кумулятивной дельты (красная стрелка).
При этом по лимитным заявкам наблюдался рост активности покупателей - количество лимитных ордеров на покупку увеличивалось, что отражено на гистограмме лимитной дельты (зелёная стрелка). Такая структура указывает на готовность участников лимитно поглощать входящий маркет-объём на продажу, формируя локальную поддержку, о которой упоминалось выше.
Причины выхода
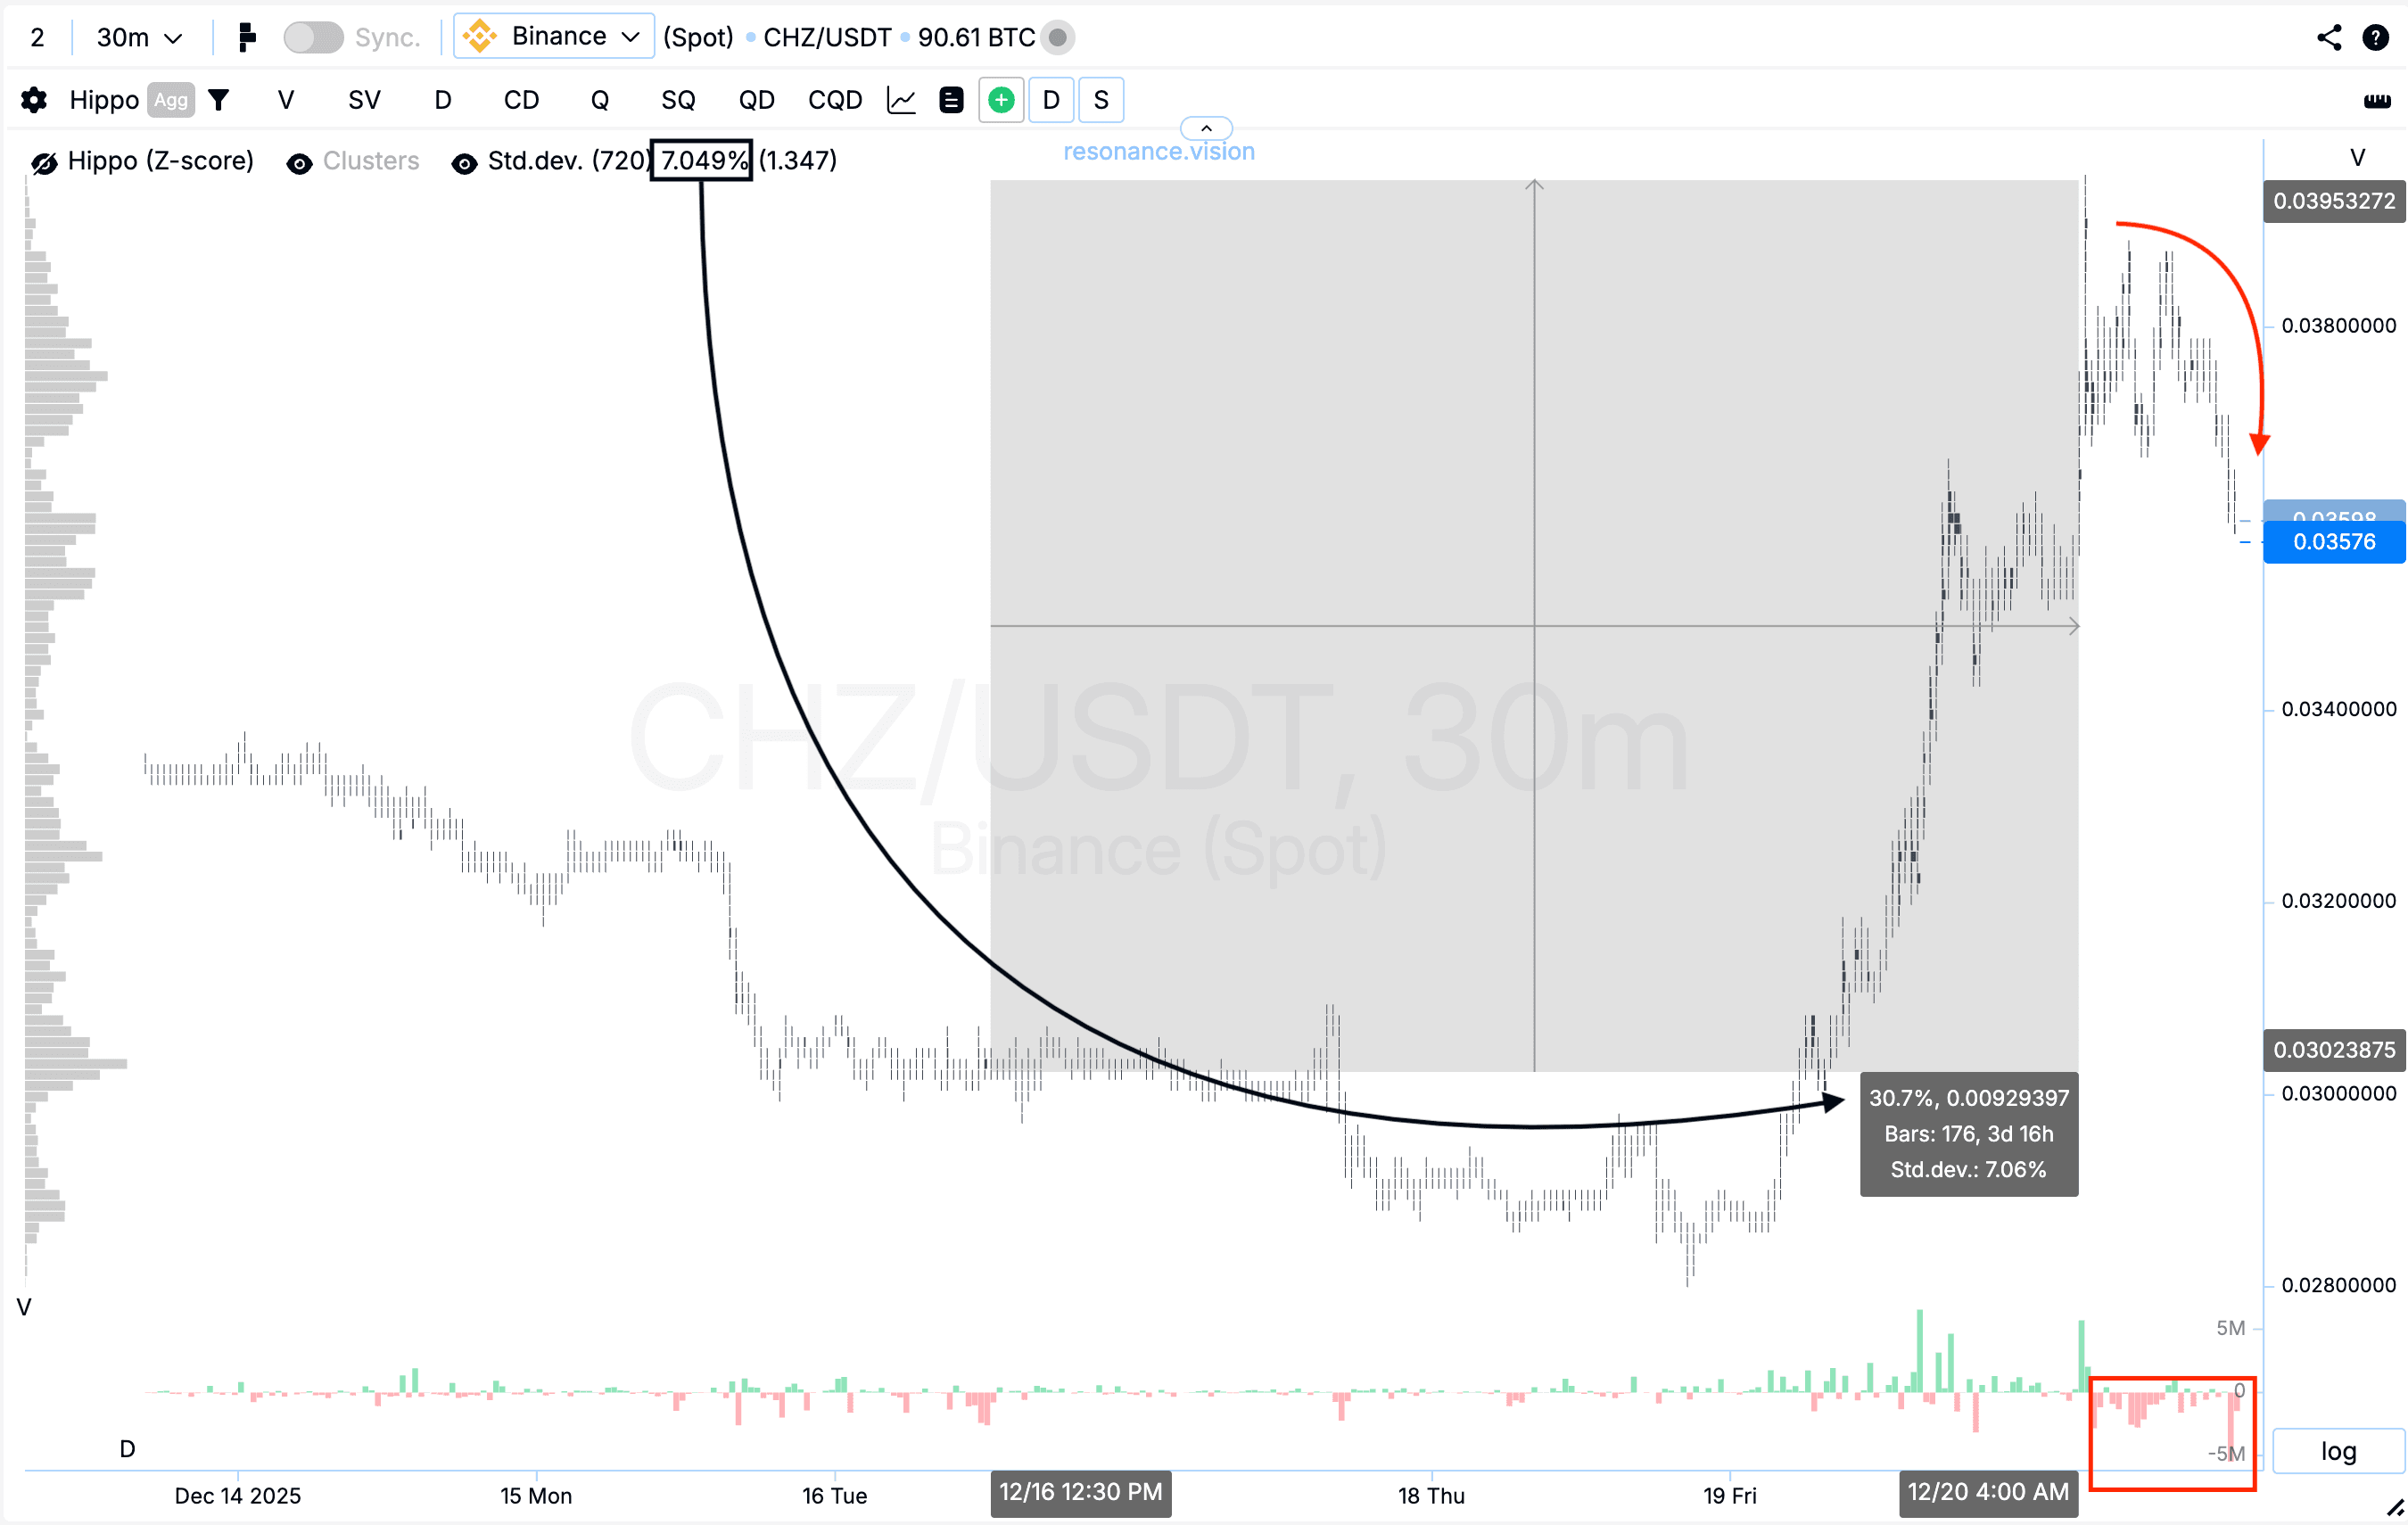
Кластерный график: от точки входа цена выросла на 30,7%, что соответствует более чем четырём стандартным движениям для данного актива. После этого сформировался заметный откат, внутри которого начали преобладать рыночные продажи (прямоугольник и стрелка). Такая динамика указывает на возможное смещение инициативы в сторону продавцов. В условиях появления встречного давления дальнейшее удержание позиции увеличивало бы риск, поэтому фиксация прибыли в этот момент выглядела наиболее рациональным и взвешенным решением.
Заключение
Данный сетап наглядно показывает, как сочетание кластерного анализа и агрегированных объёмных показателей позволяет своевременно выявлять смену баланса спроса и предложения.
На этапе входа рынок демонстрировал признаки локального дефицита: продавцы продолжали давить маркет-объёмом, но цена перестала реагировать снижением, что указывало на присутствие локального дефицита.
В дальнейшем движение было успешно реализовано, однако появление отката на фоне усиления рыночных продаж стало первым сигналом ослабления инициативы покупателей. В таких условиях фиксация позиции позволила сохранить уже полученное движение и избежать роста риска.
Разбор подчёркивает важность оценки не только объёмов, но и их эффективности относительно цены - именно это даёт трейдеру объективное преимущество в принятии решений.
Следи за новыми статьями в нашем телеграм канале.
Не нужно выдумывать сложных схем и искать “грааль”. Используй инструменты платформы Resonance.
Регистрируйся по ссылке — получай бонус и начинай зарабатывать:
OKX | BingX | KuCoin.
Промокод TOPBLOG дает тебе 10% скидки на любой тарифный план Resonance.
Рекомендуемые статьи


