FET +113% (Resonance Directional Strategy)

This analysis examines a situation where, despite significant selling pressure, the price held thanks to limit support from buyers. Volume and cumulative delta analysis helped identify a balance shift and enter the position at the optimal point. A more than 100% increase confirmed the effectiveness of this approach, and profit-taking after the abnormal move avoided unnecessary risk.
Table of contents
Coin: FET/USDT
Risk: Medium
Experience Level: Beginner
Entry Reasons
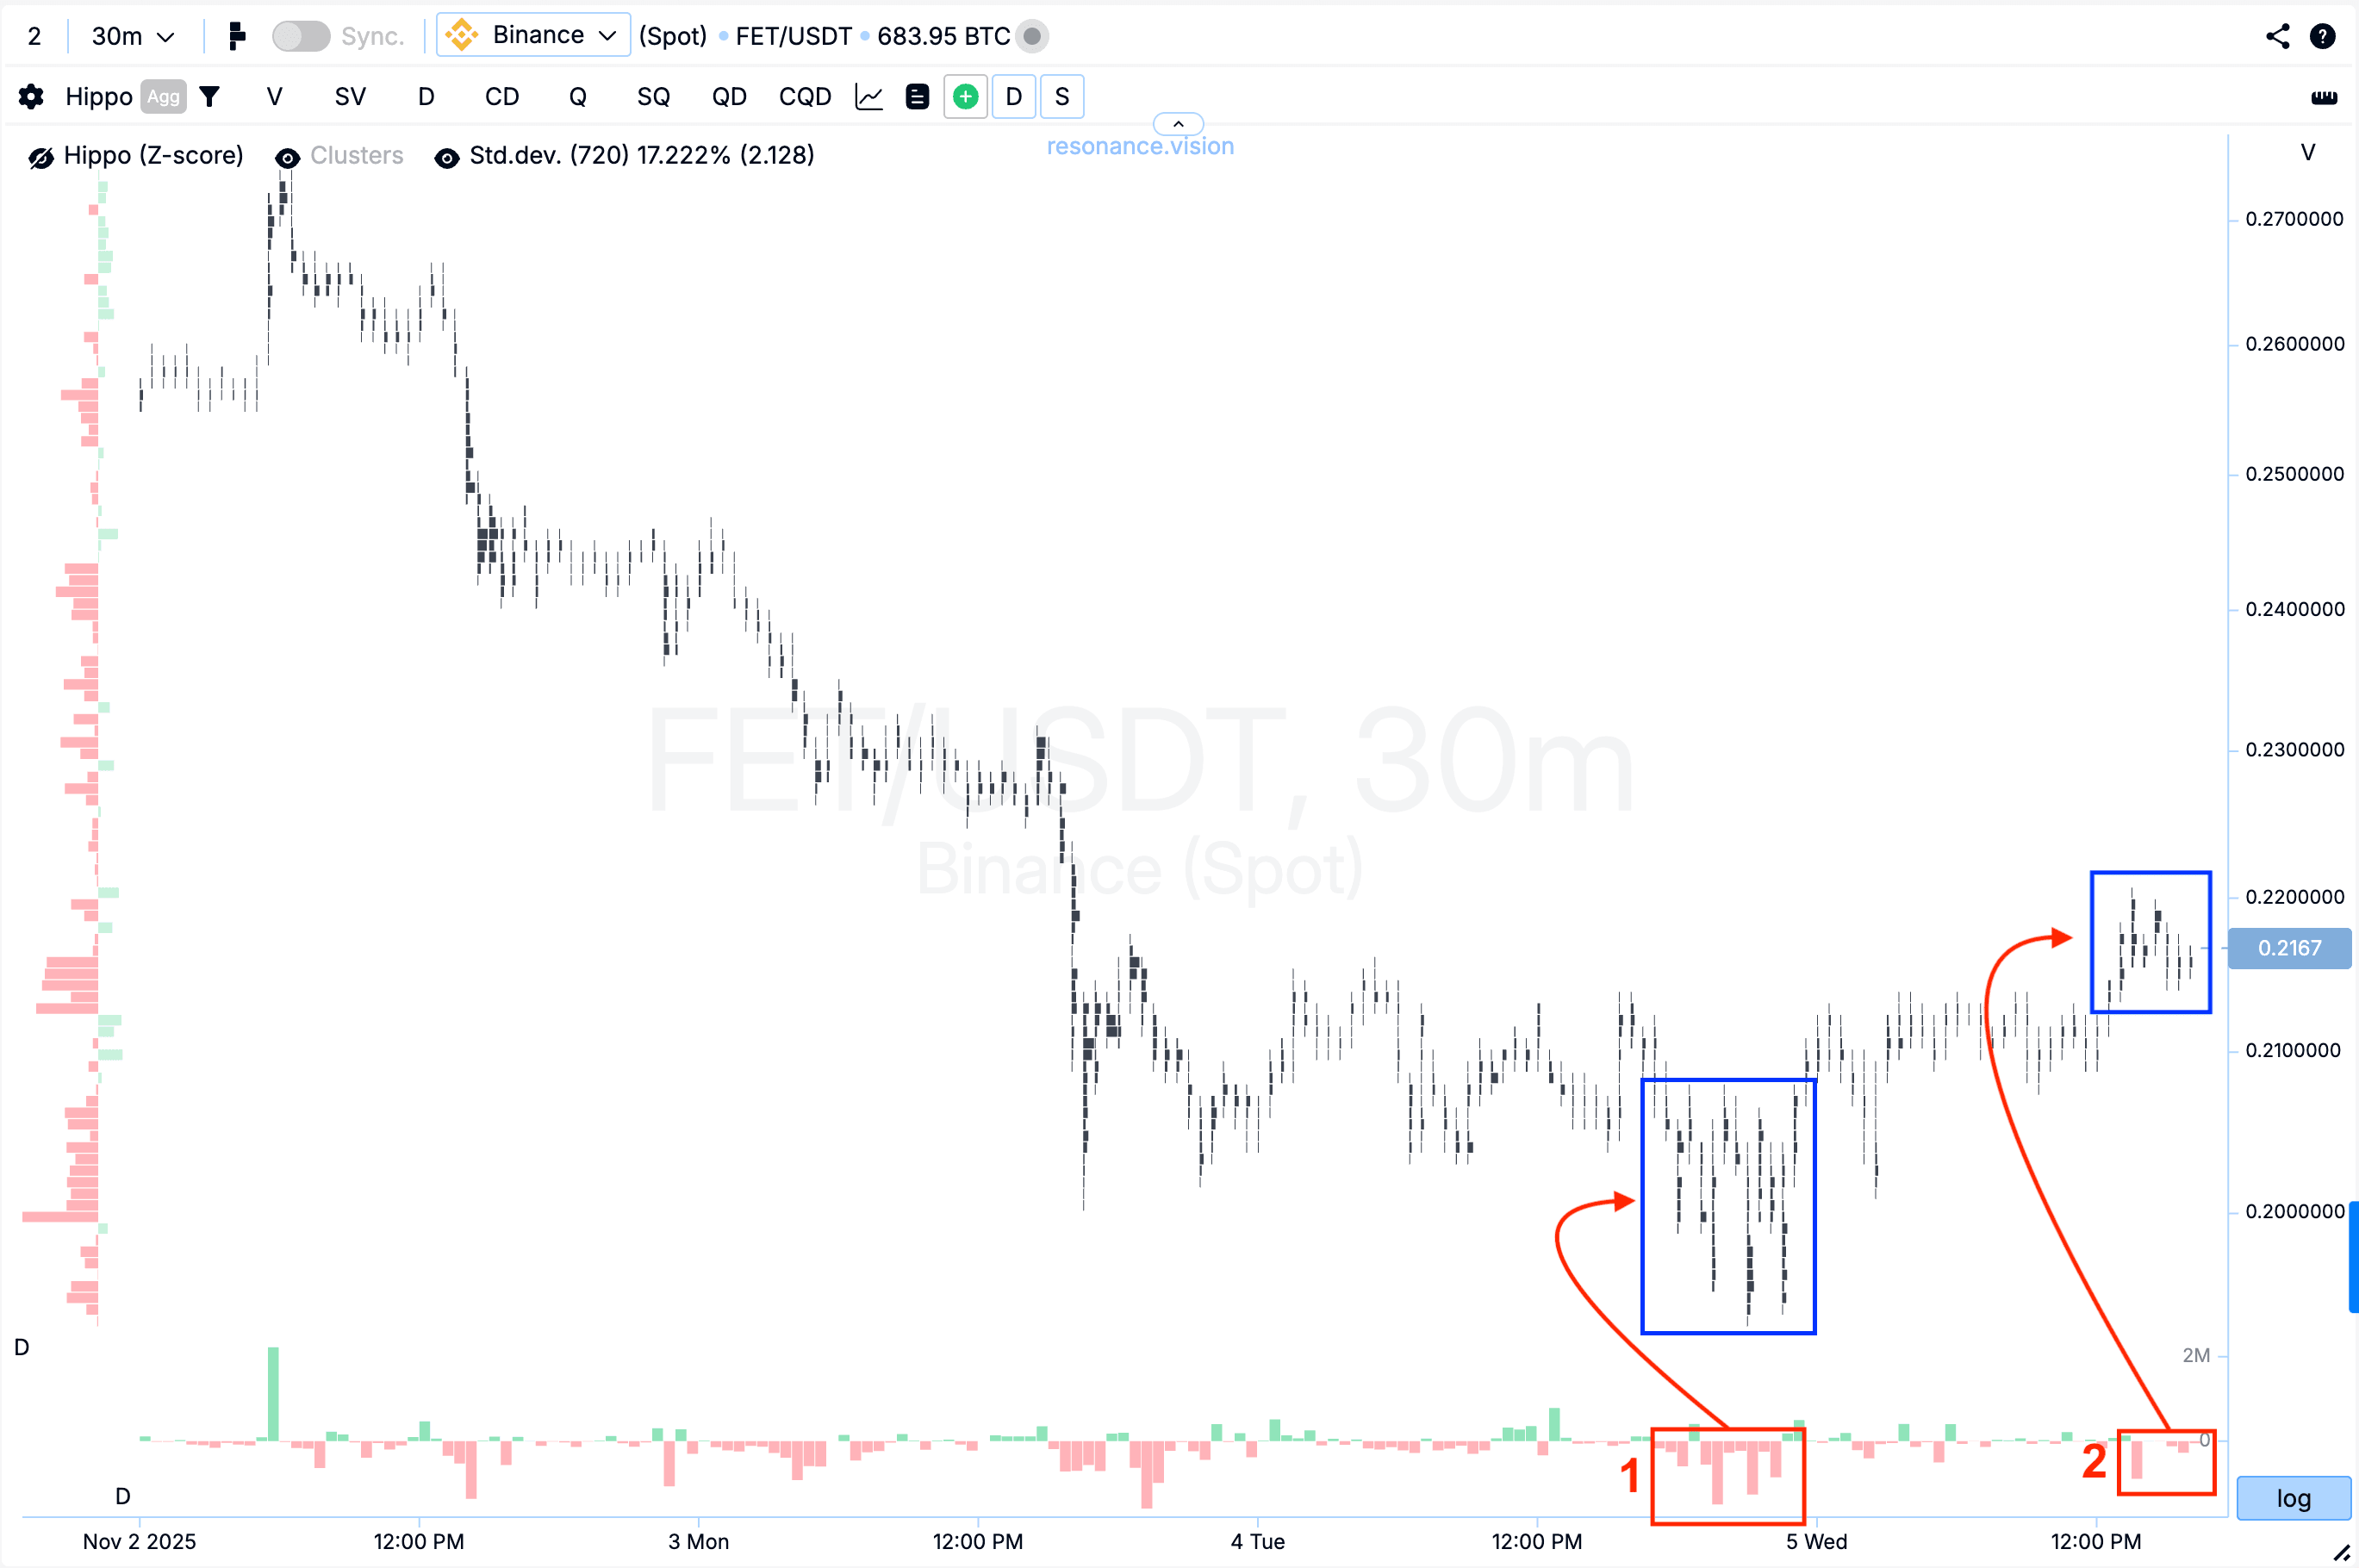
Cluster Chart: During the decline, large volume clusters began to form (blue rectangles) dominated by sell volume. However, despite these sales, the price failed to make a new local low (red rectangle #1). Later, on another wave of selling (red rectangle #2), the price started to rise instead. Such behavior indicates signs of a local supply shortage.
Dashboard
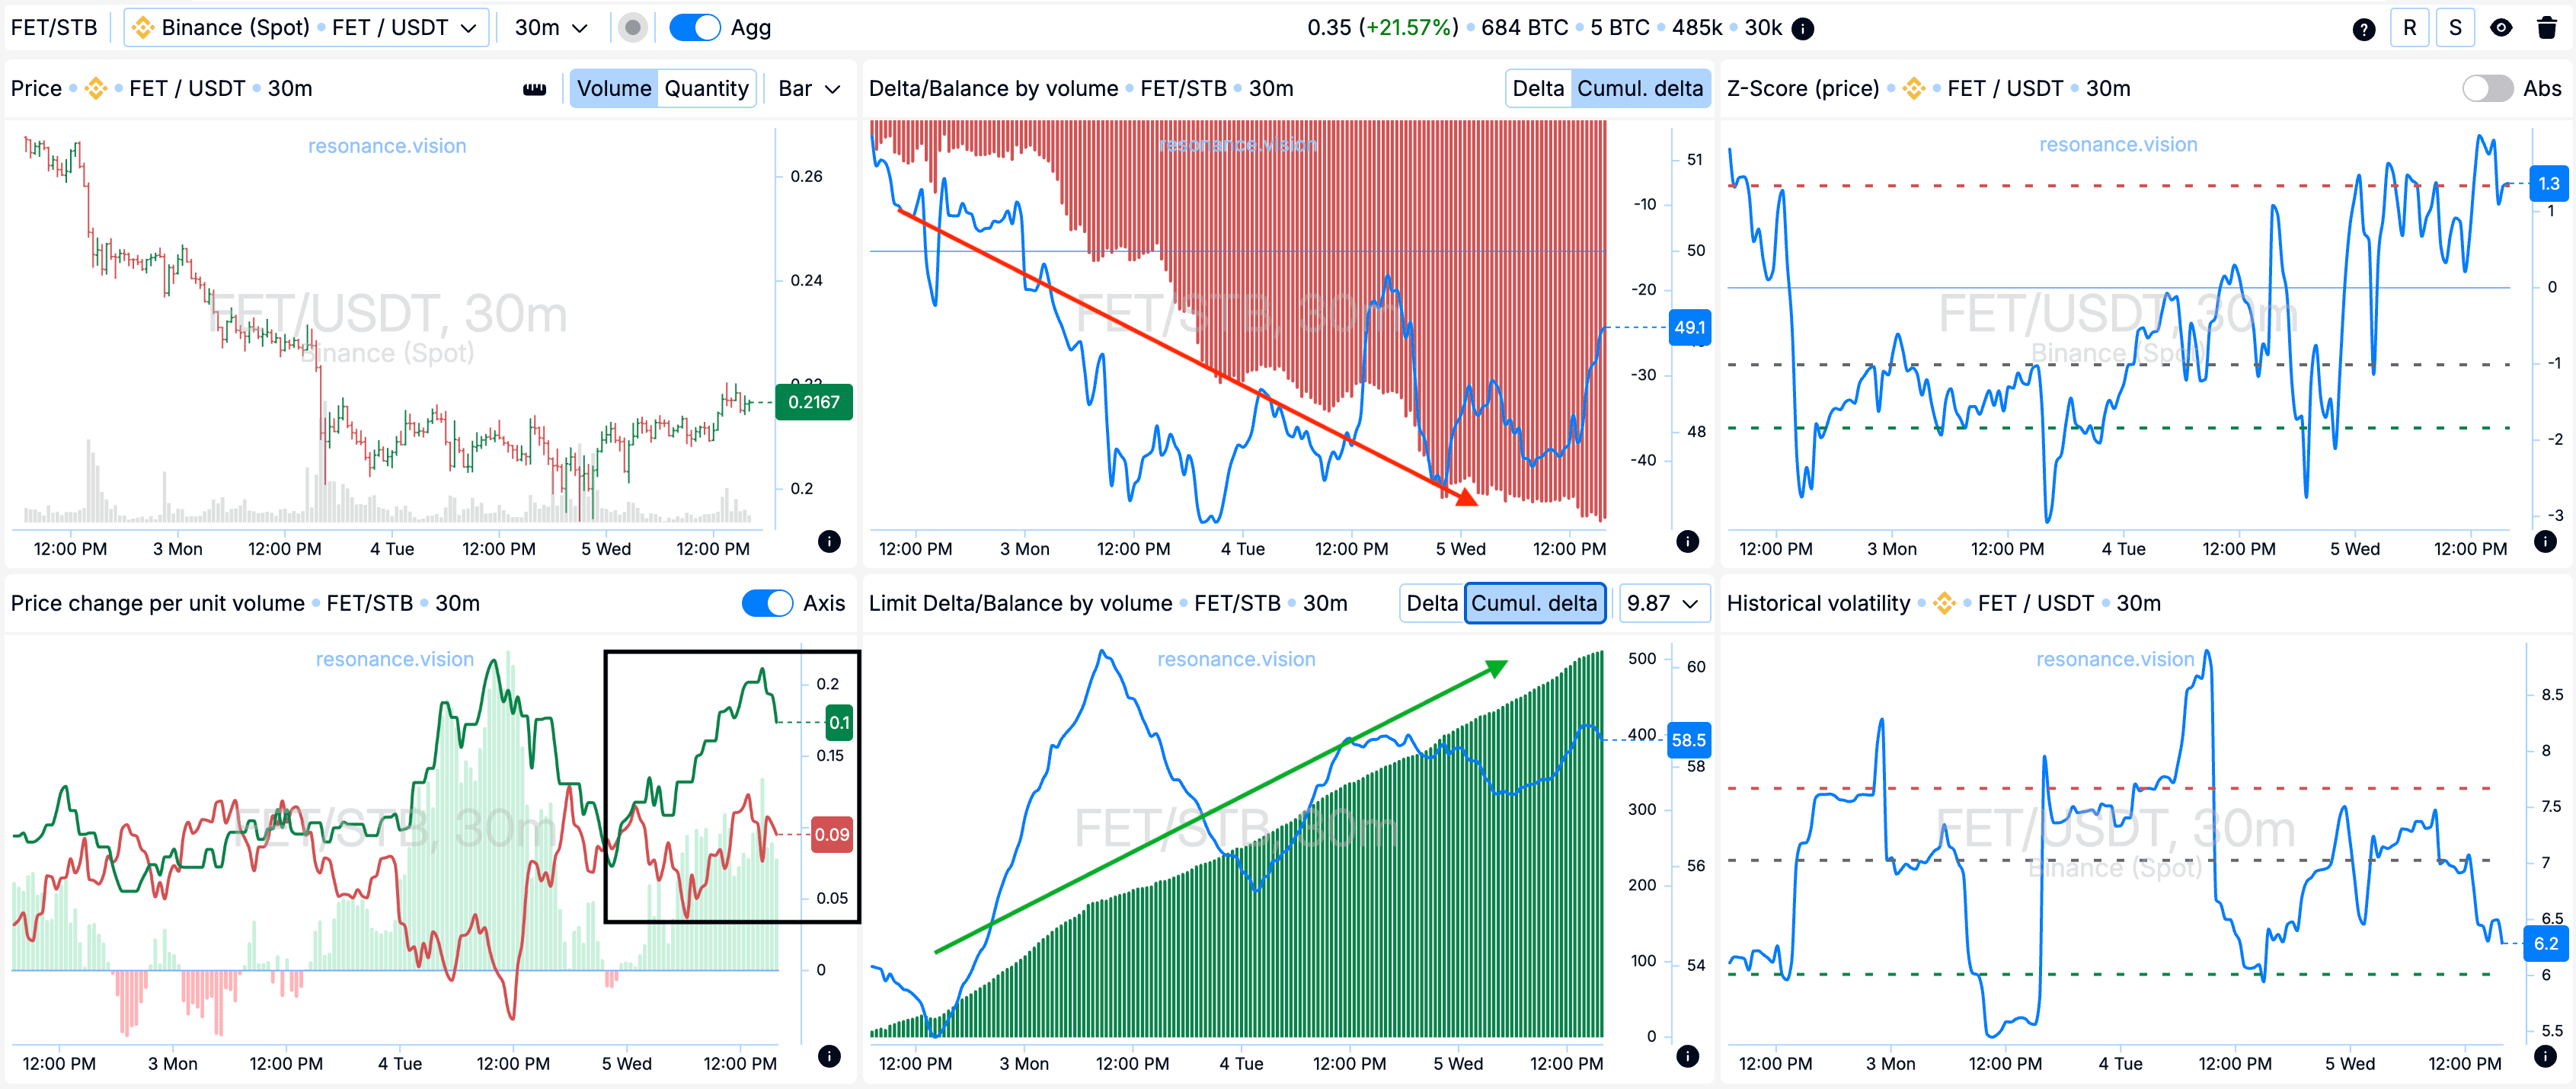
Delta / Volume Balance and Limit Delta: Aggregated data show a noticeable increase in sell volume across all pairs and exchanges, clearly visible on the cumulative delta histogram (red arrow). However, despite this strong selling pressure, the price does not continue to decline — consistent with the picture seen on the cluster chart.
At the same time, limit order data reveal active placement of buy orders (green arrow on the cumulative delta histogram). Market participants are likely absorbing the entire market sell volume through limit bids, forming support and preventing further downside.
Price Change per Volume Unit: It can also be seen that the efficiency of market order impact on price has shifted in favor of buyers (black rectangle), indicating increased buying efficiency.
Exit Reasons
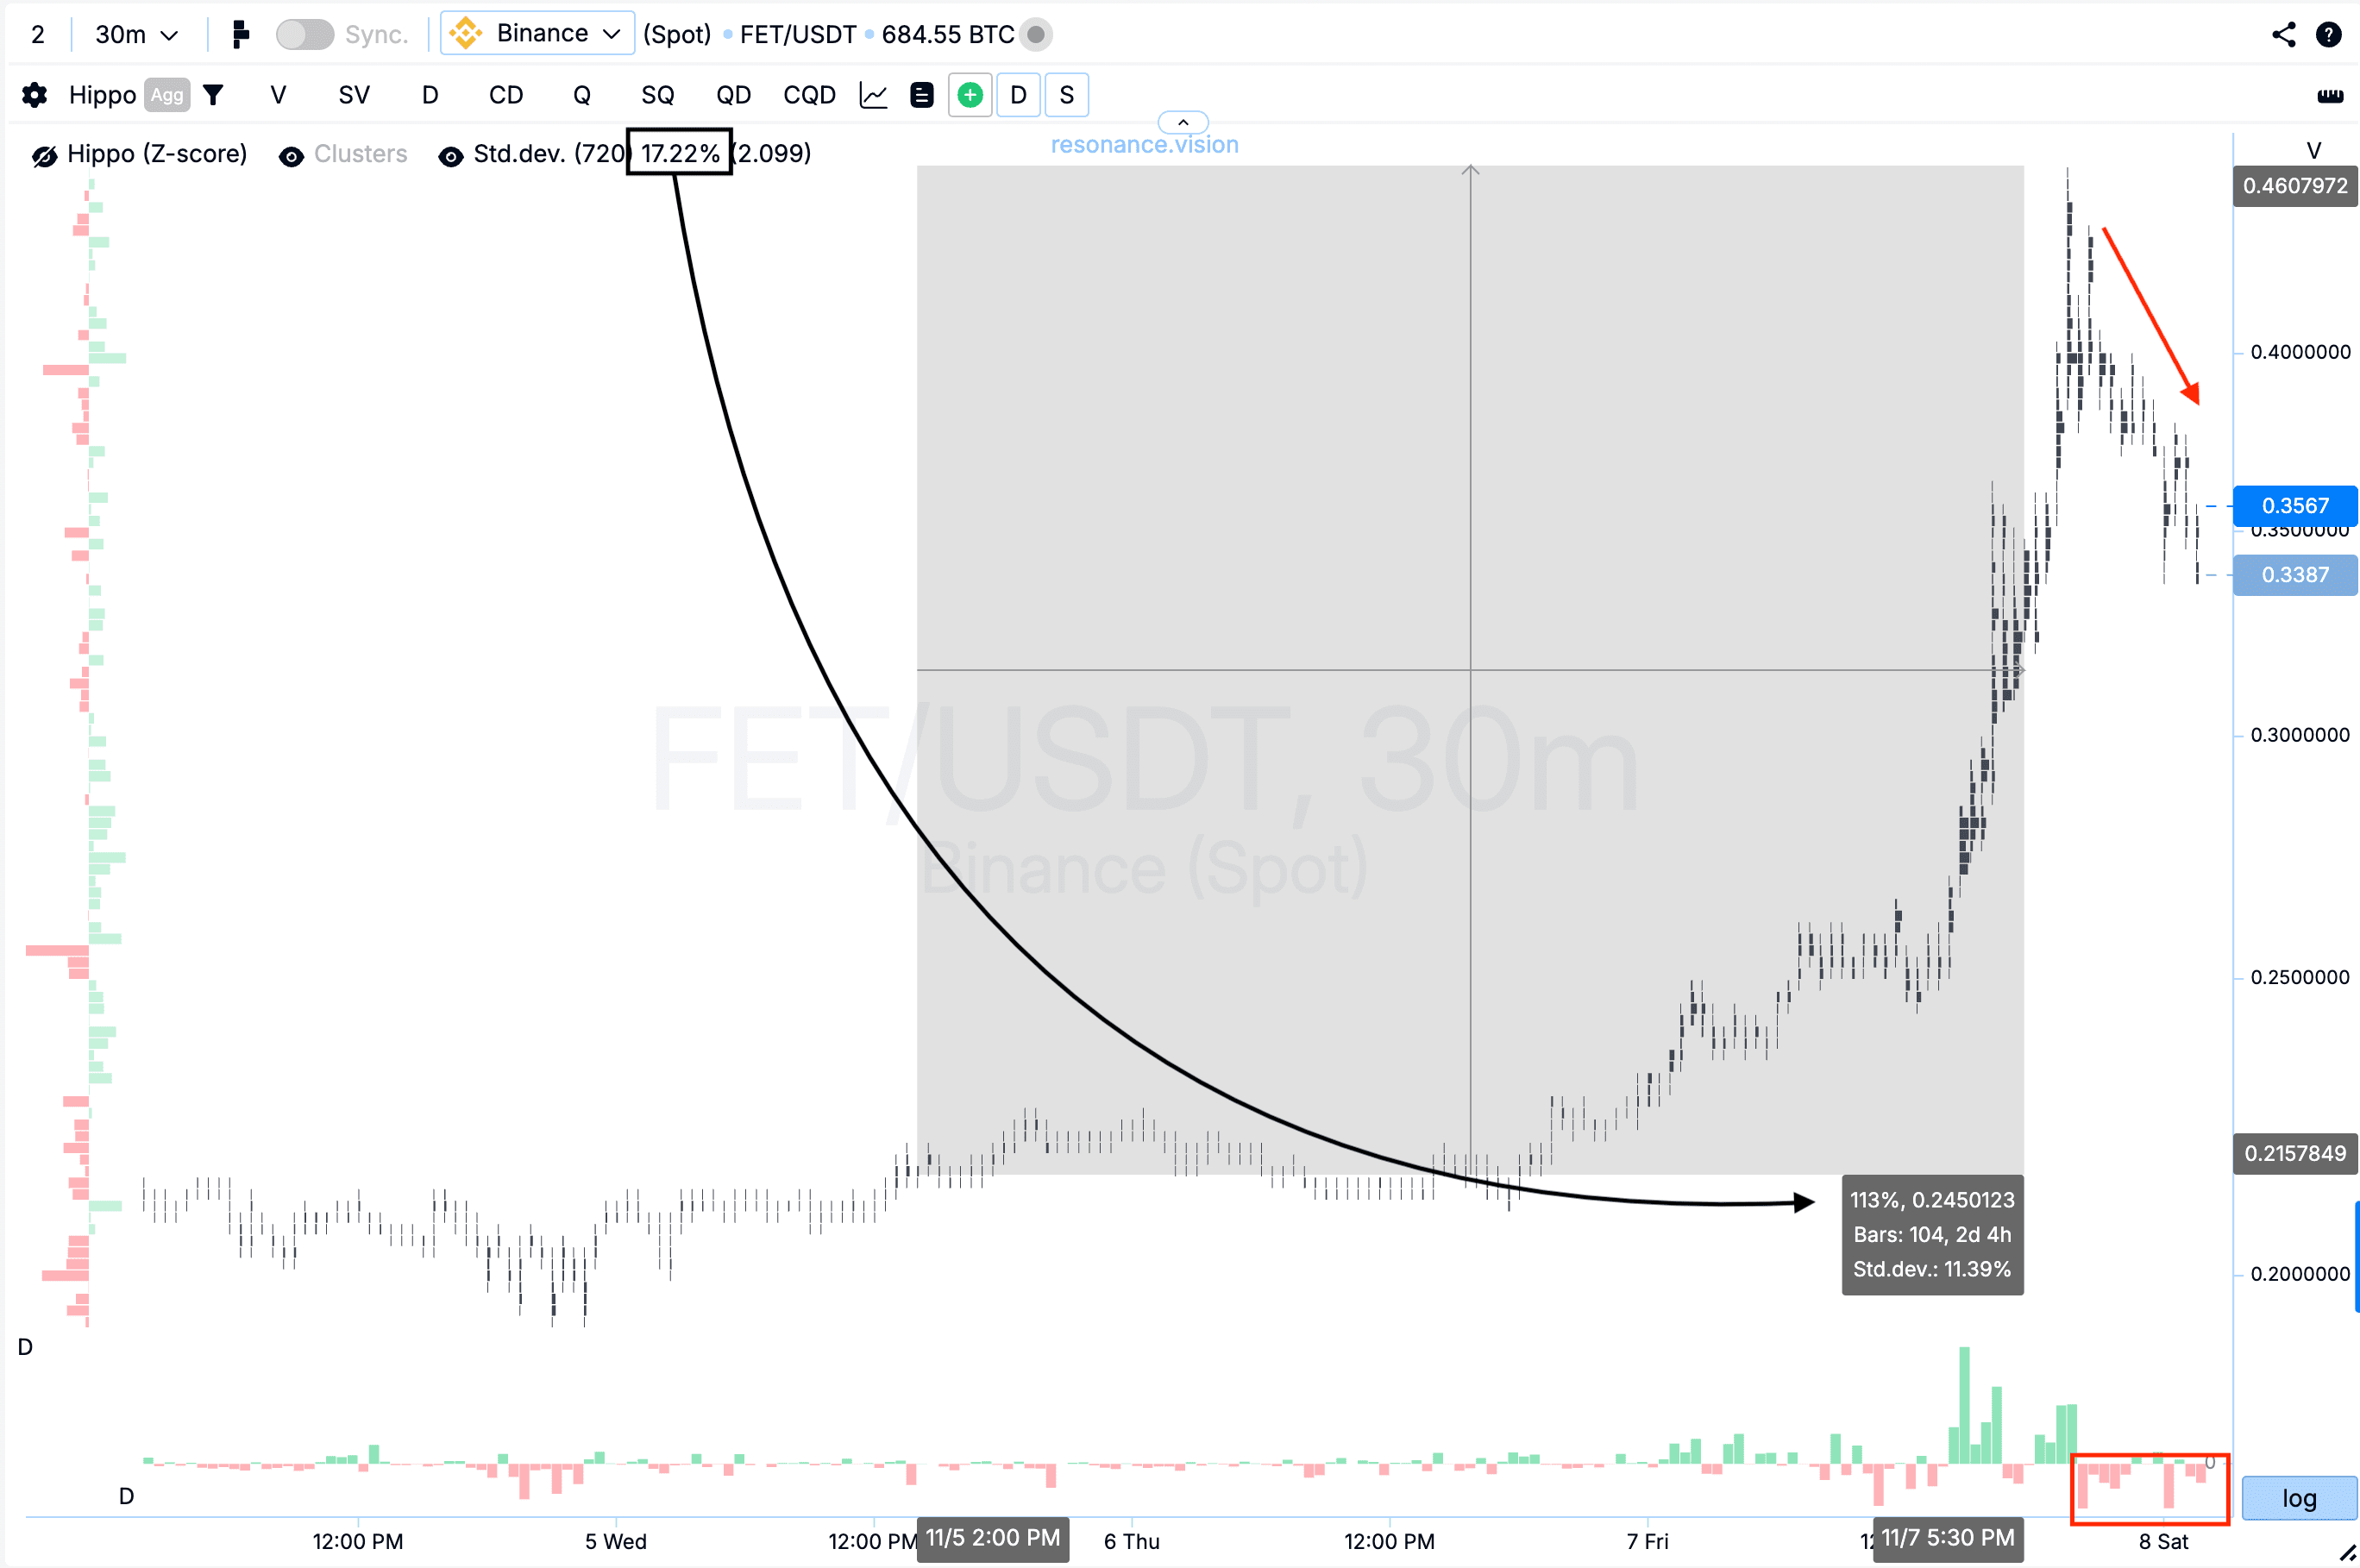
Cluster Chart: From the entry point, the price increased by another 113%, after which a pullback formed, accompanied by significant market selling (red rectangle and arrow). It’s also worth noting that the price movement exceeded six standard deviations, while for this asset one standard move equals 17.22% (black rectangle and arrow). As a reminder, any move exceeding two standard deviations is already considered abnormal. In such conditions, continuing to hold the position would carry increased risk, making profit-taking the most rational choice.
Conclusion
This case clearly illustrates how crucial it is to evaluate volume and its impact on price — the core principle on which the market operates. Despite dominant selling activity, the price failed to make new lows and then began to rise, showing that limit buy orders were actively absorbing the entire market sell volume and providing strong support. This is a classic example of demand beginning to outweigh supply.
Taking profit after a 100%+ increase and reaching an abnormal move (more than six standard deviations) was a fully justified decision. It’s important to remember that it’s not the absolute amount of volume that drives price, but how that volume affects it. Proper evaluation of the interaction between volume and price reaction allows traders to make informed decisions and preserve results consistently over the long run.
Follow new insights in our telegram channel.
No need to invent complex schemes and look for the "grail". Use the Resonance platform tools.
Register via the link — get a bonus and start earning:
OKX | BingX | KuCoin.
Promo code TOPBLOG gives you a 10% discount on any Resonance tariff plan.
Recommended articles


