HIGH +40.5% (Resonance Directional Strategy)

This analysis demonstrates how a combination of cluster charts, heat maps, and aggregated data allows you to identify localized signs of shortfall and make informed entry and exit decisions. We’ll explore why buyers outperformed sellers on the decline, what triggered the position, and how to determine when momentum has run out.
Table of contents

Coin: HIGH/USDT
Risk: Medium
Understanding level: Beginner
Entry Reasons
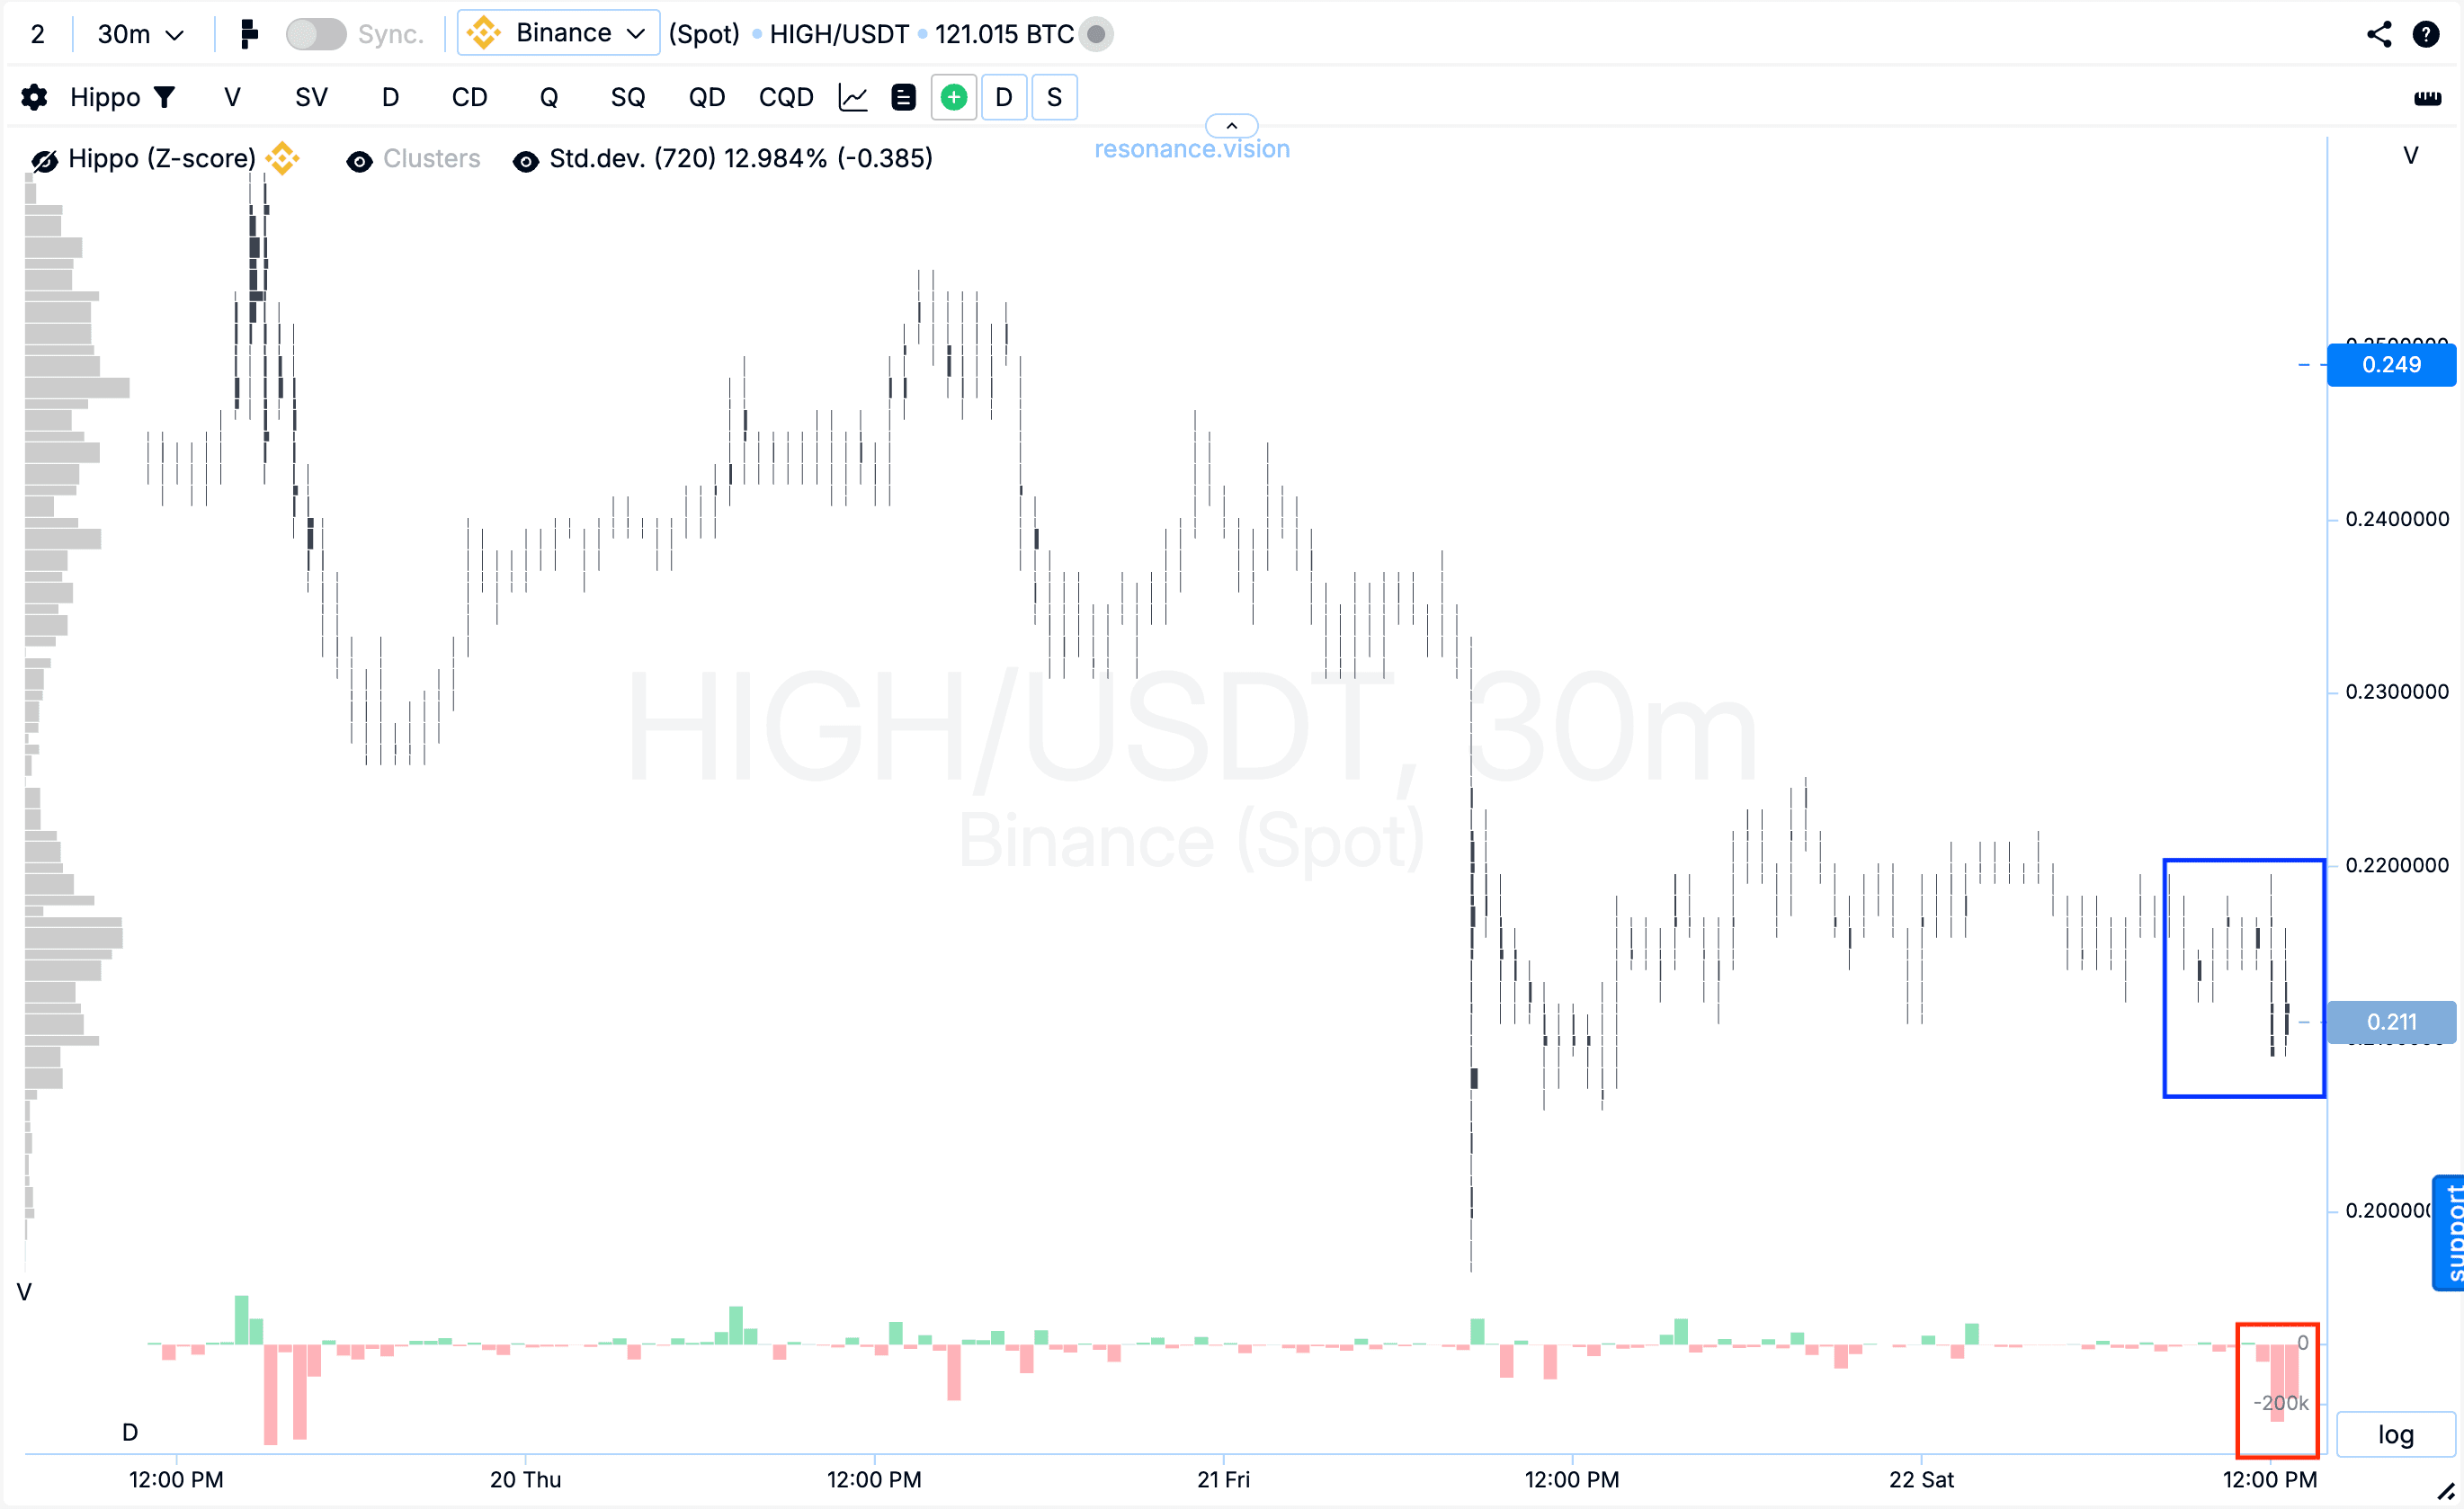
Cluster chart: during the decline, large clusters began to appear (blue rectangle) with noticeable volumes of market selling inside them (red rectangle). However, despite the pressure, the price failed to update the local low — this signals increasing demand and local deficit signs, where sellers are spending volume but the efficiency of pushing the price lower is no longer producing results.
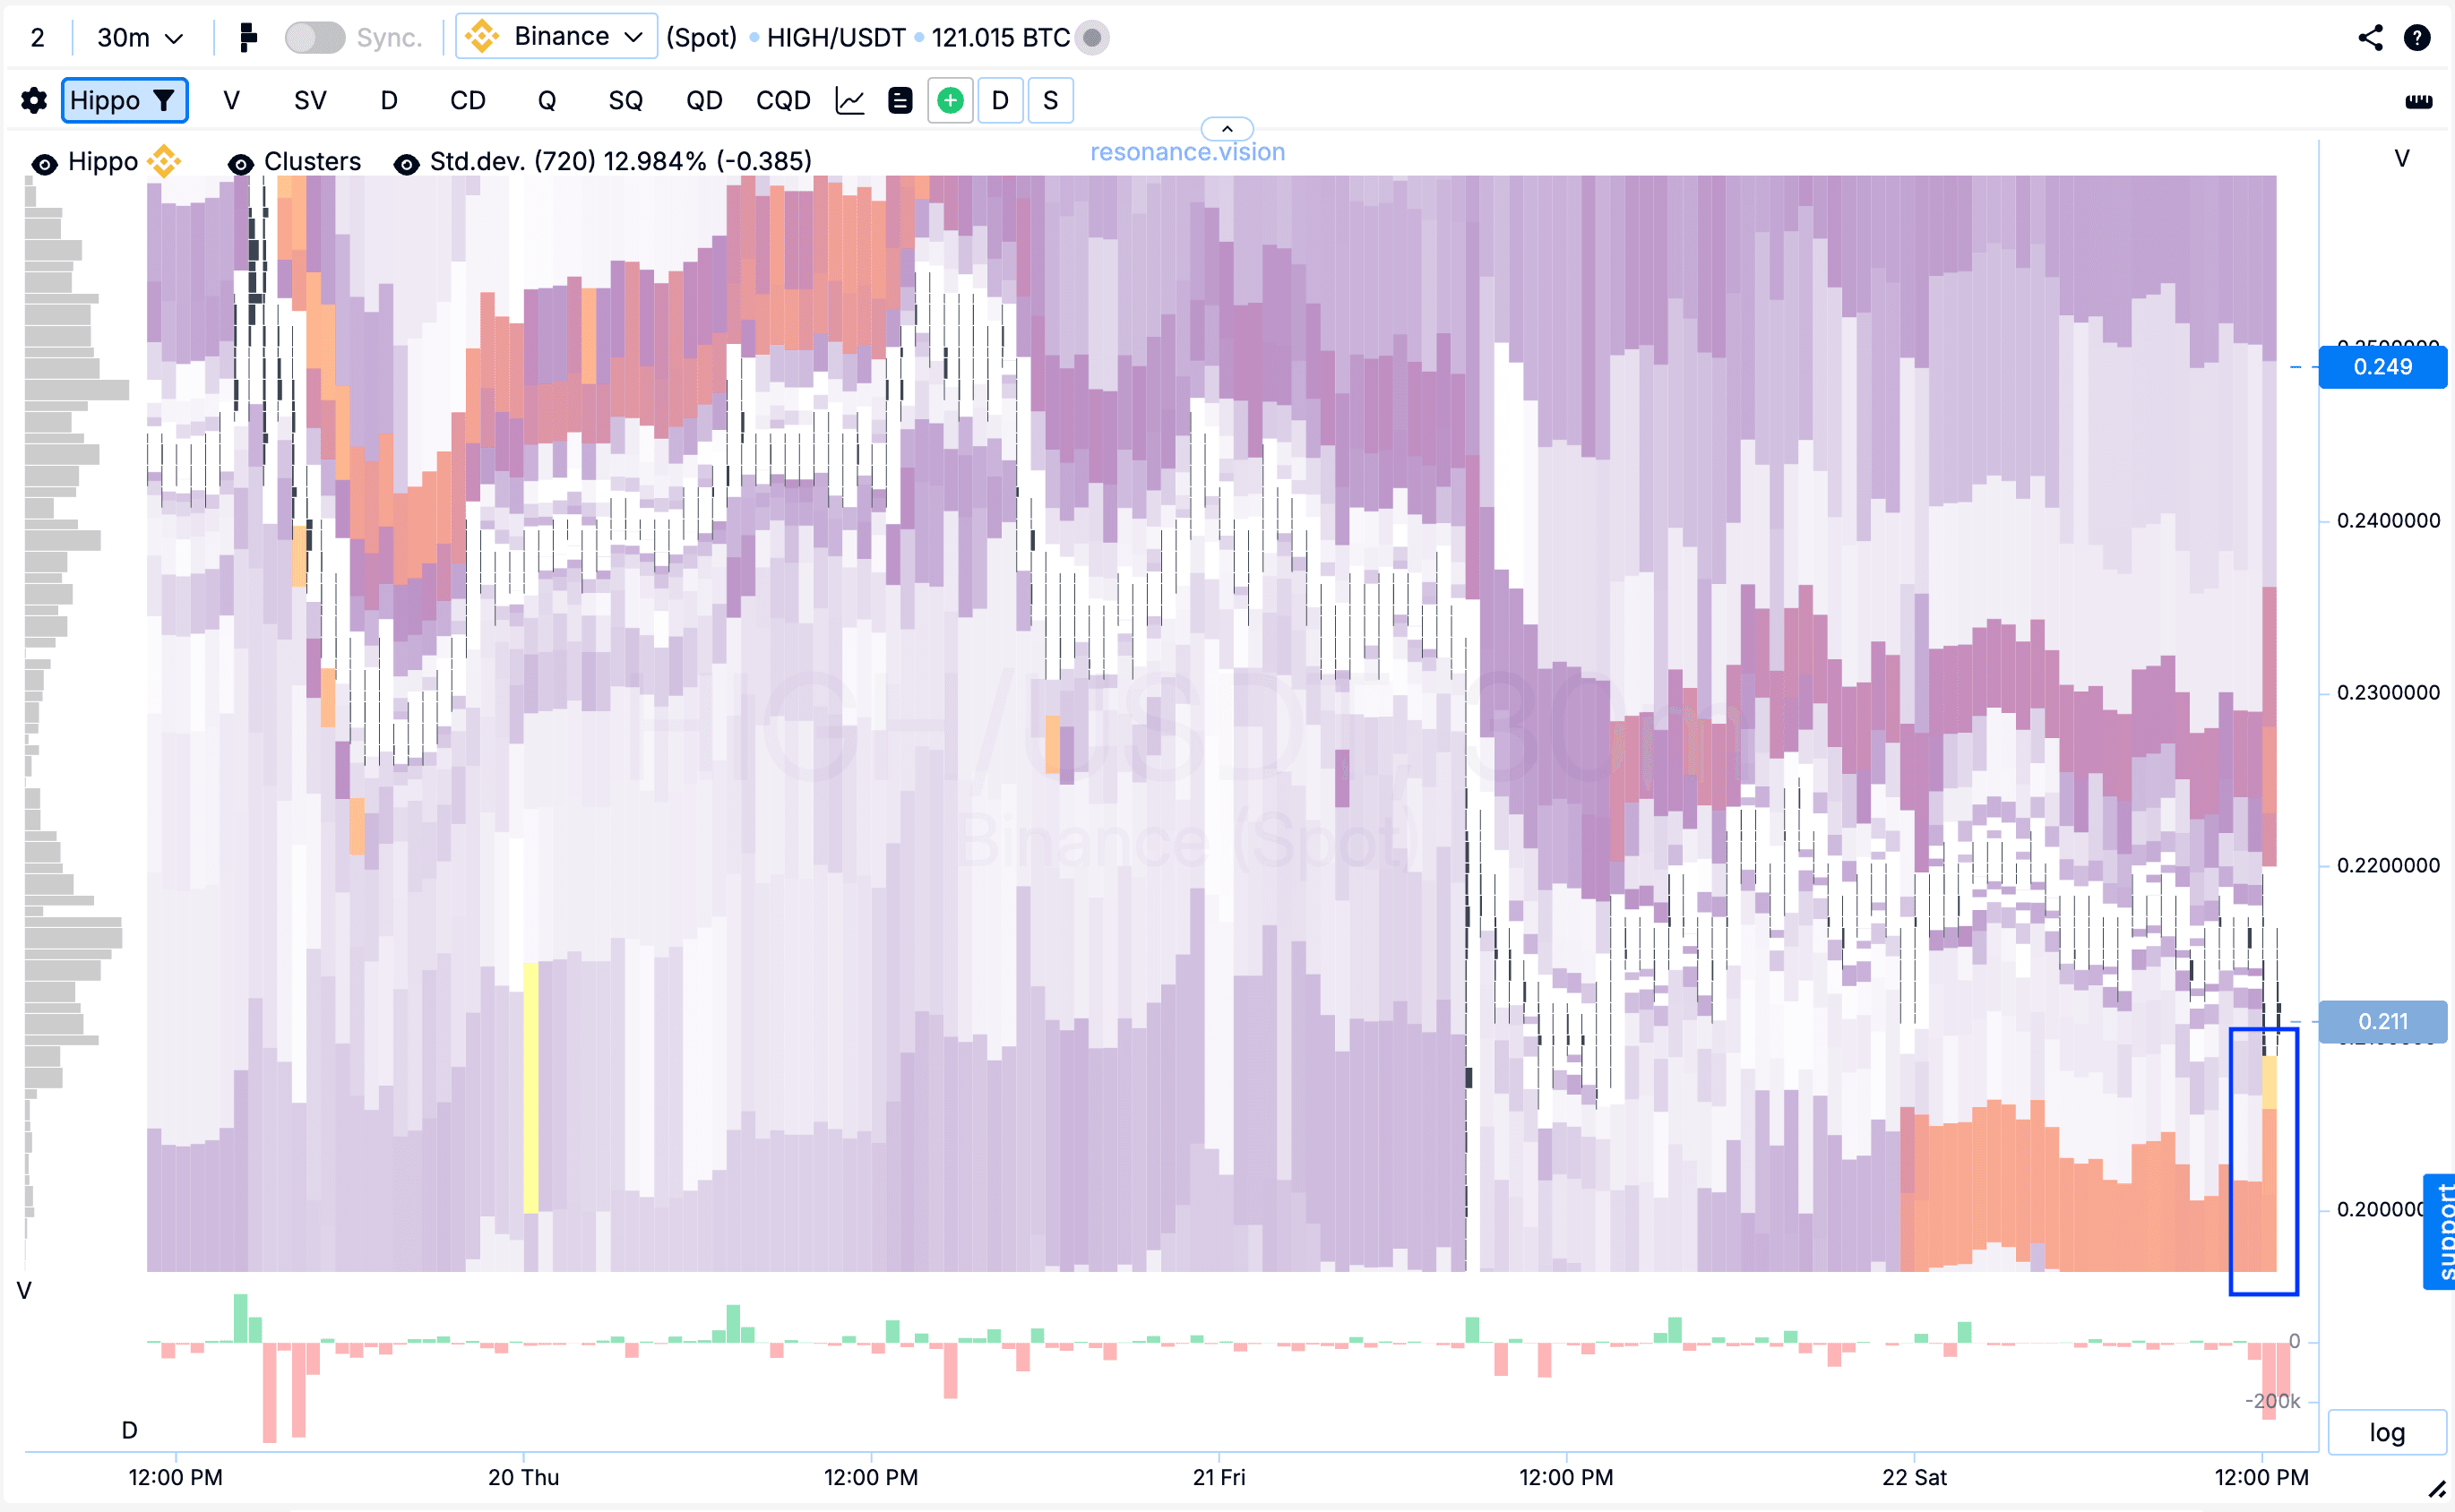
Heatmap (by volume): anomalous buy-side limit orders (blue rectangle) also appeared, absorbing the market selling volumes. This dynamic indicates persistent signs of a local deficit and the willingness of buyers to absorb all incoming market sell orders.
In the Dashboard
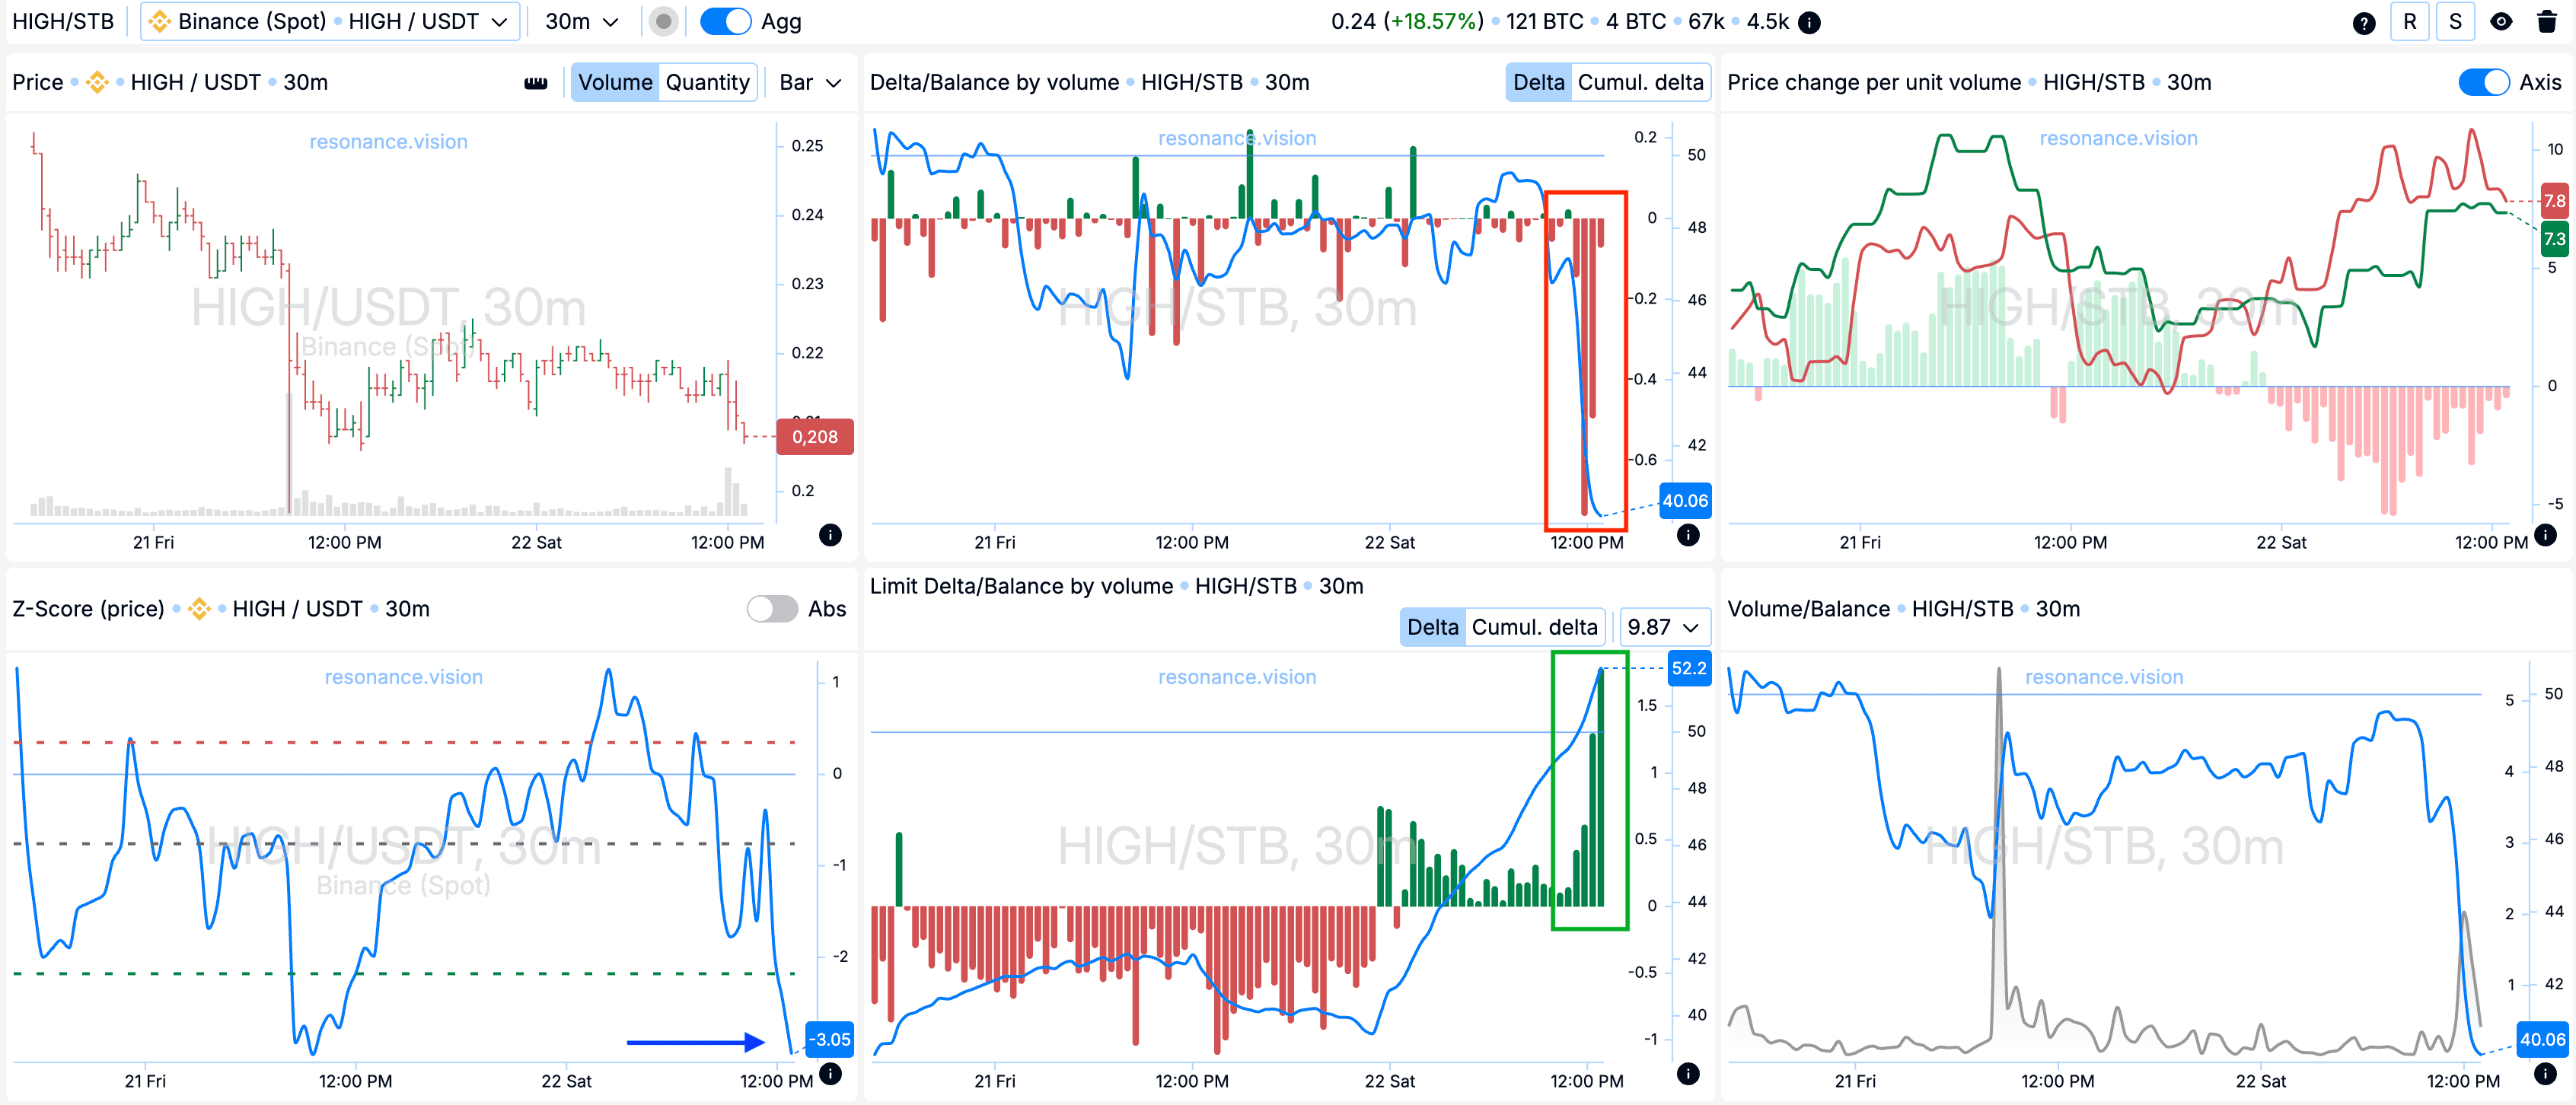
Delta / Volume Balance and Limit Delta: when evaluating aggregated data across all pairs and exchanges, we observe confirmation of the picture shown on the cluster chart. During this period, selling volumes dominated the market — this is clearly visible in the delta histogram (red rectangle). At the same time, limit order data shows a noticeable increase in buy limit orders, reflected in the delta histogram (green rectangle). This situation indicates that participants were willing to absorb all incoming market sell volume, forming local support, as mentioned above.
Z-Score (price): the price also deviated downward by more than three standard deviations (blue arrow). Such an anomaly often signals the possibility of a local reversal and subsequent upward movement.
Exit Reasons
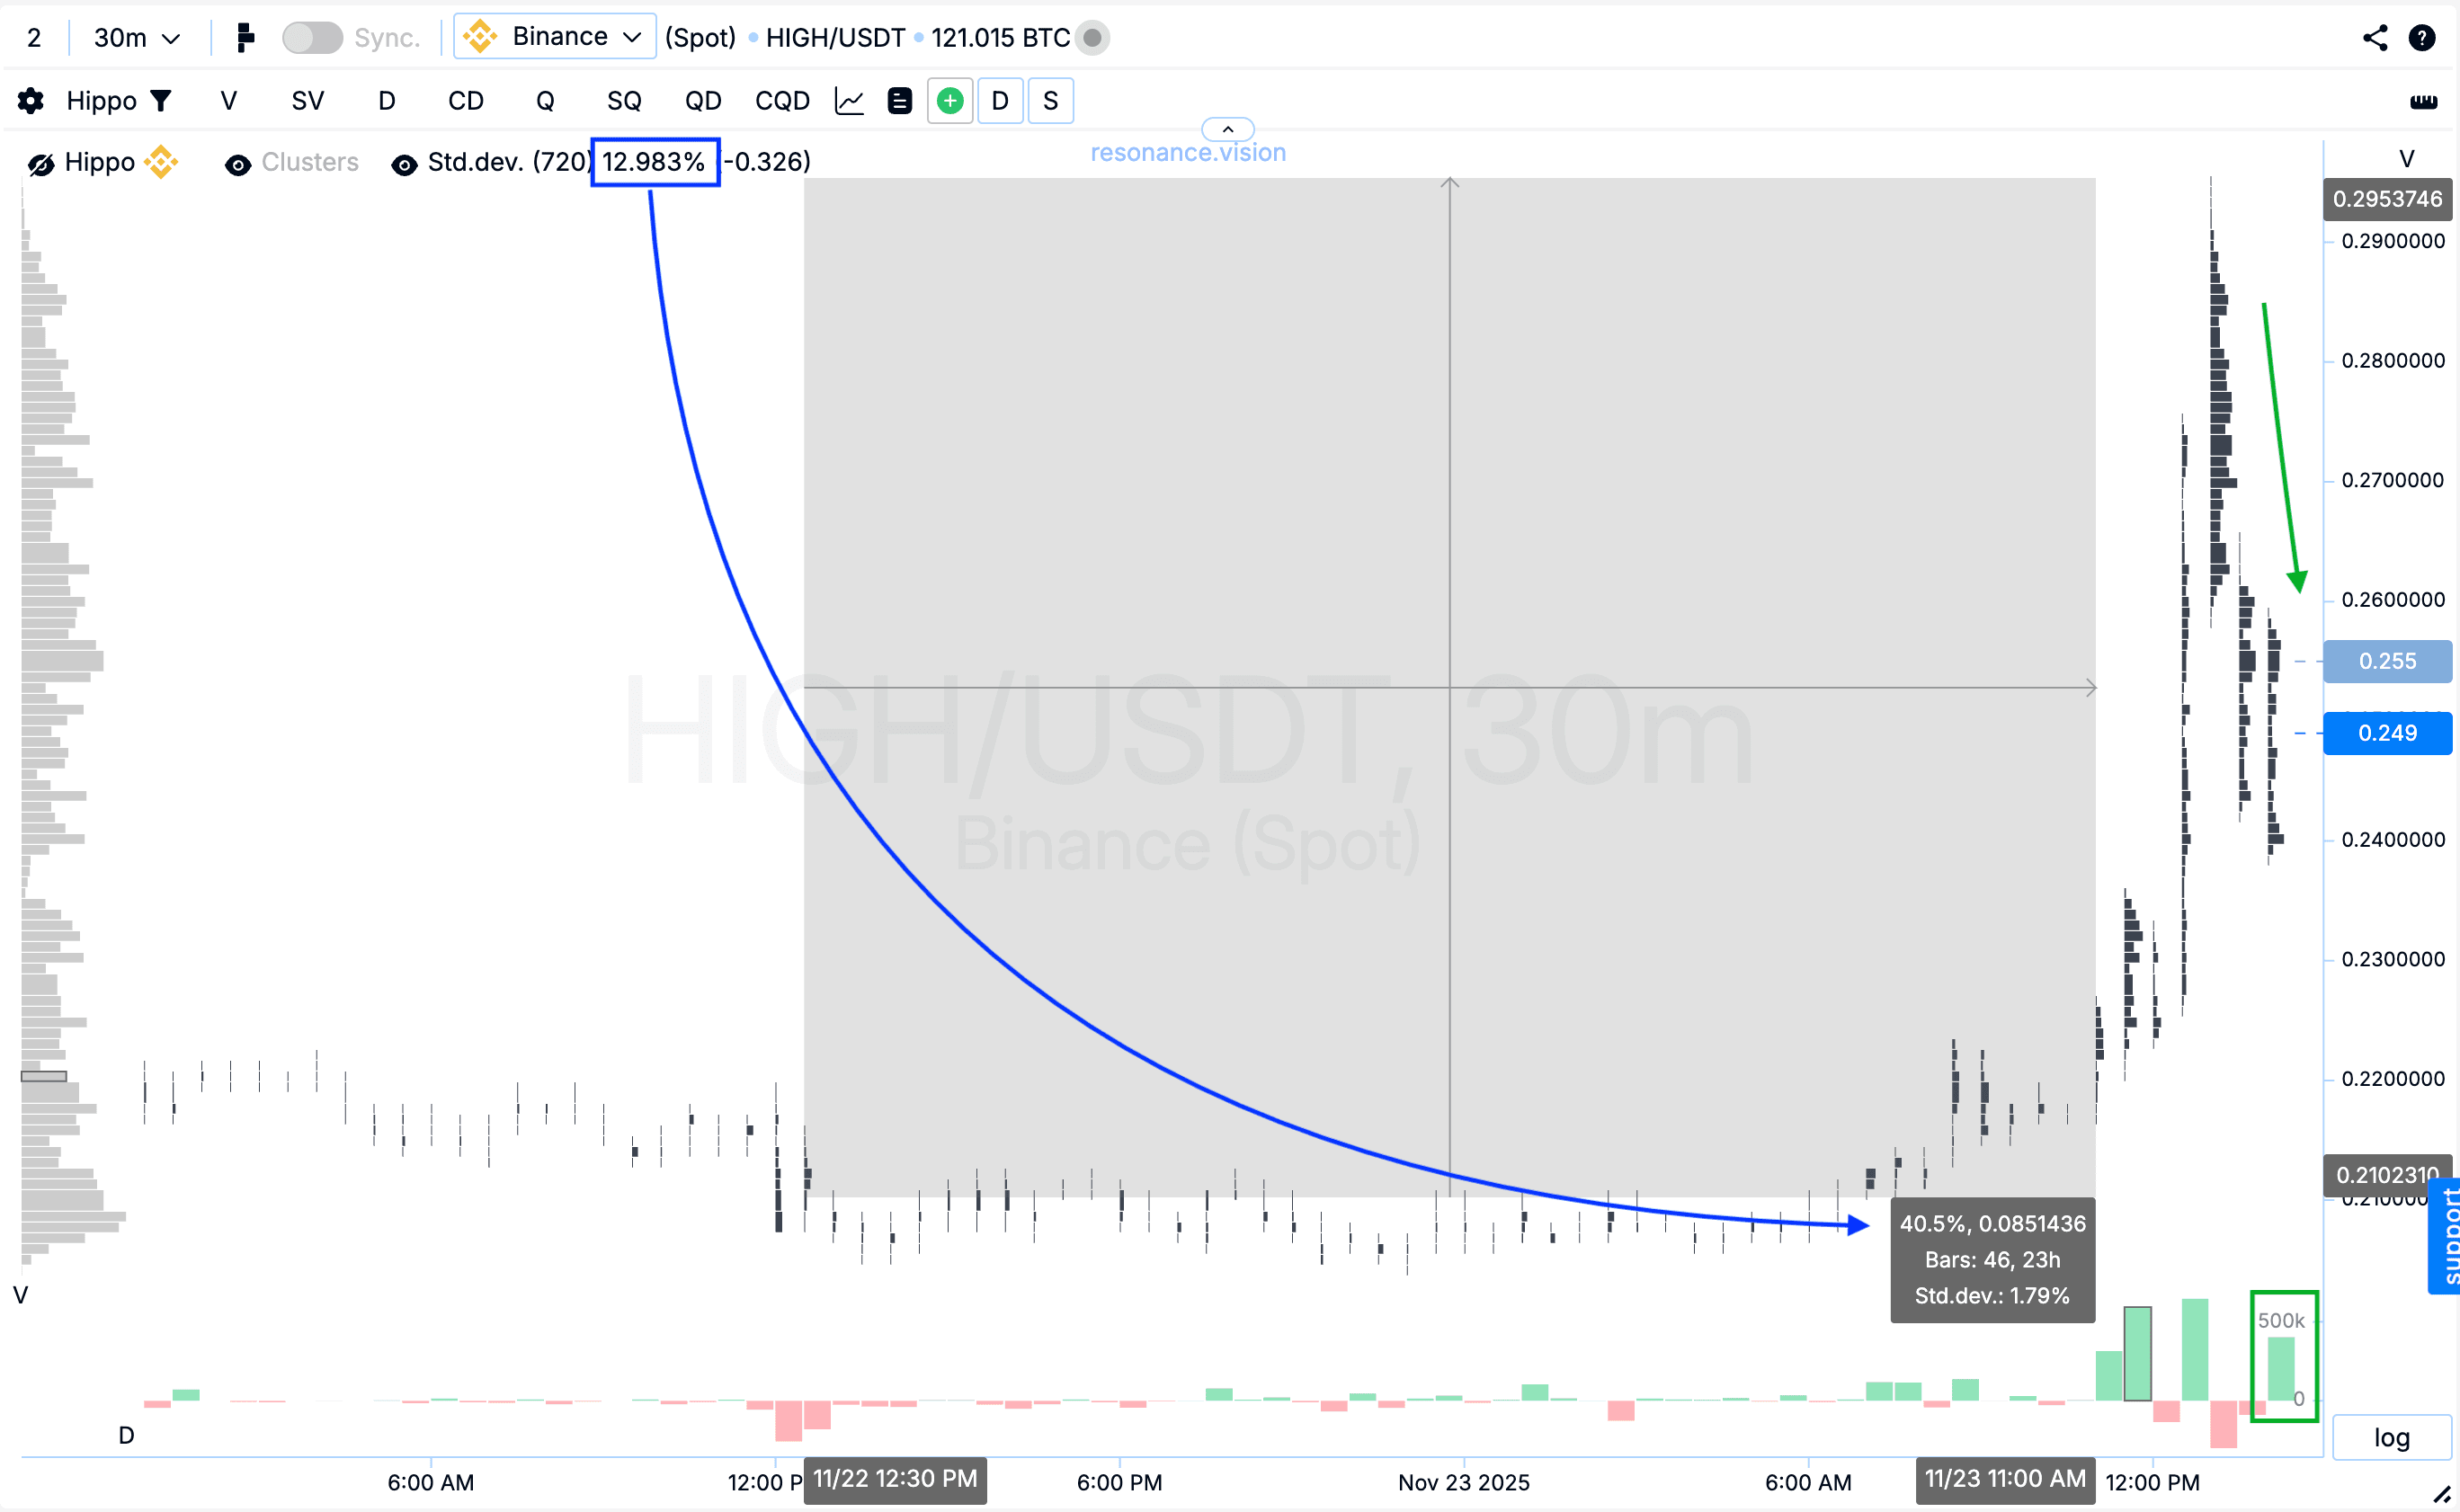
Cluster chart: after the entry point, the price moved more than 40%, which corresponds to over three standard movements. Market buying was still present, but against the backdrop of the emerging pullback, its influence on the price noticeably weakened. This market reaction indicates a loss of buyer initiative. In this situation, it is rational to close the position and secure the already realized impulse.
Conclusion
In this trade, we relied on a combination of strong factors: a local deficit during the decline, anomalous limit buy walls, the willingness of buyers to absorb all market sell volume, and confirmation of this picture through aggregated data. Additionally, the situation was strengthened by the fact that the price moved below three standard deviations — another argument for a potential reversal.
The entry was made based on facts, not expectations: sellers were spending volume without results, while buyers consistently held the price. This provided a solid opportunity to enter a long position.
The exit was also justified — after a move of more than 40%, buying efficiency began to weaken, and the price reaction became softer. At this stage, securing profits is essential rather than hoping for continuation.
This was a well-balanced trade: clear entry signals, controlled risk, and timely profit-taking. Such an approach builds consistency and discipline — the qualities that make a trader sustainable over the long term.
Follow new insights in our telegram channel.
No need to invent complex schemes and look for the "grail". Use the Resonance platform tools.
Register via the link — get a bonus and start earning:
OKX | BingX | KuCoin.
Promo code TOPBLOG gives you a 10% discount on any Resonance tariff plan.
Recommended articles


