LINK +65,4% (Направленная стратегия Resonance)

Практический разбор лонг-сделки через механику спроса и предложения. На примере кластерного графика и агрегированных метрик показано, как распознать неэффективность продаж, подтвердить участие лимитного покупателя и обосновать вход.
Содержание

Этот разбор для тех, кто учится искать торговые идеи через механику спроса и предложения. Основа - анализ кластерных графиков криптовалют с упором на проторгованные объёмы и лимитную активность: ровно то, что раскрывает анализ спроса и предложения.
Монета была отобрана через скринер криптовалют на таймфрейме 30 минут. Дальше логика была простая: рыночные продажи преобладают, но цена не обновляет минимумы и начинает восстанавливаться. Когда давление продавца есть, а результата нет - продажи теряют эффективность, и это часто означает, что спрос поглощает предложение. В таких условиях легко увидеть признаки локального дефицита и получить обоснование для входа.
И ещё: во время просмотра рынка похожая картина повторялась на большом количестве монет. Это подсказало, что речь идет о более широком состоянии рынка, что и усилило уверенность в решении открыть позицию в лонг.
Причины входа
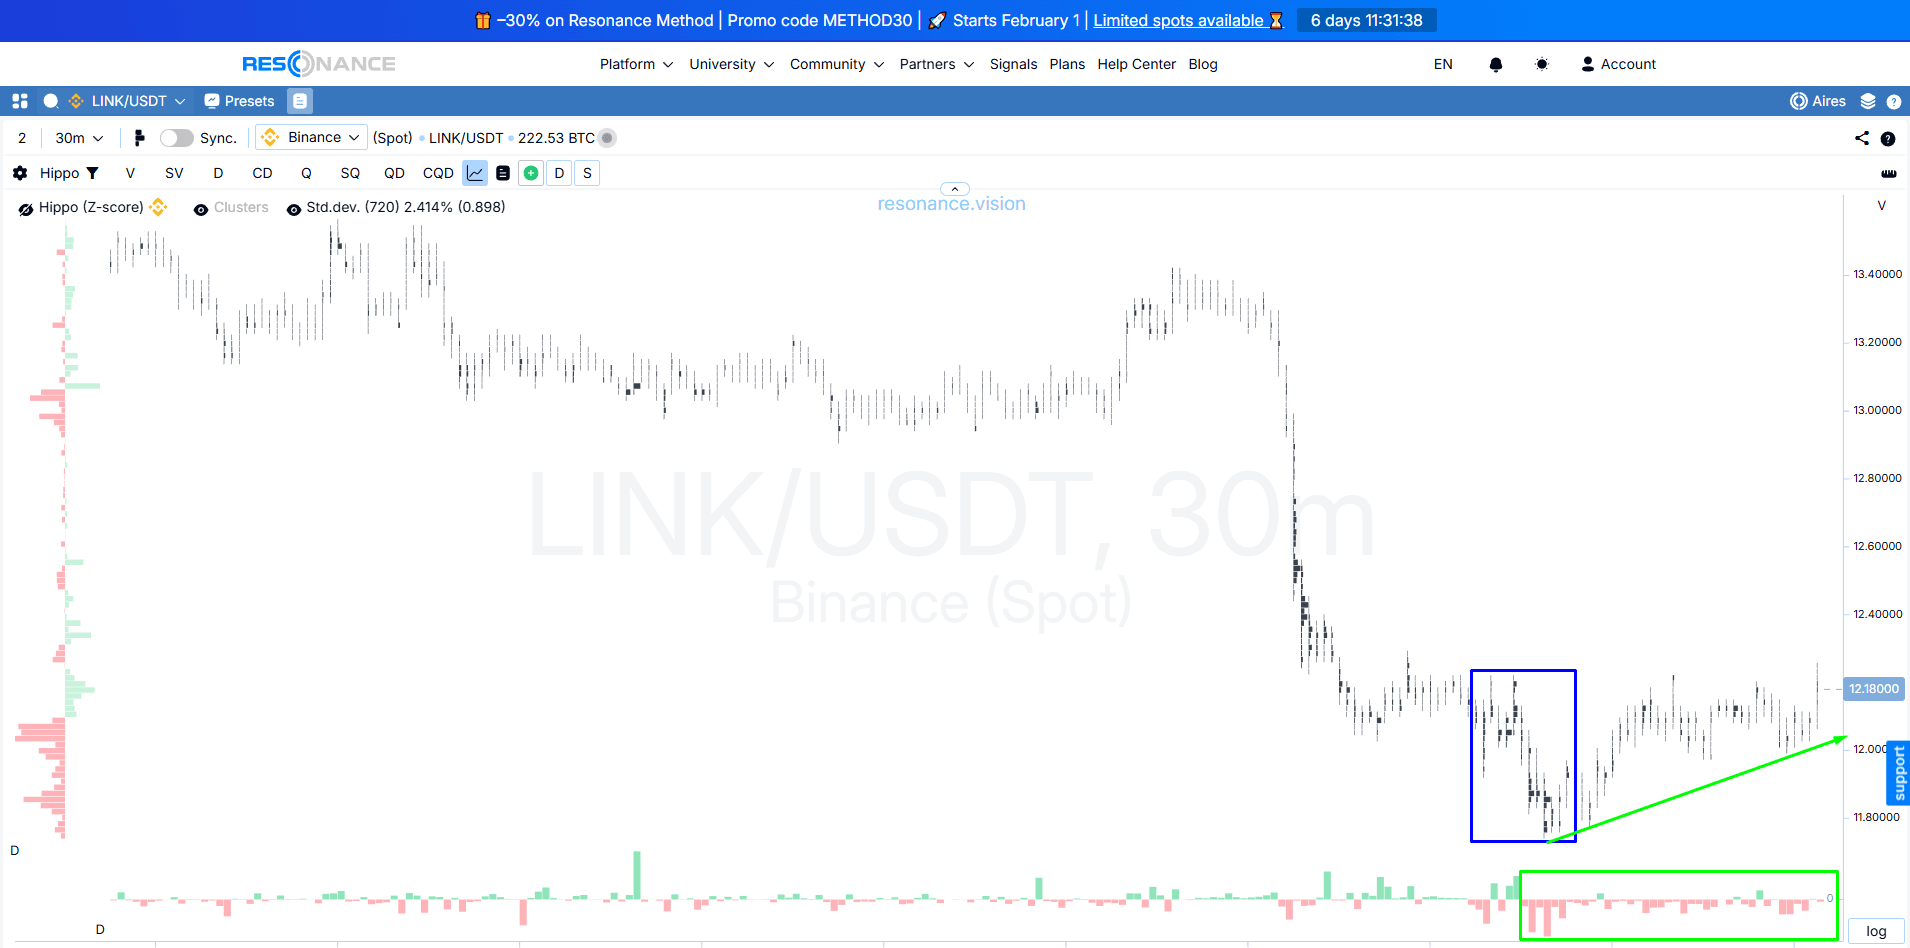
- Кластерный график:
В фазе поиска баланса стали образовываться заметные накопления по объёму внизу кластерных баров (синий прямоугольник).
Далее видим, что продажи отчетливо преобладали (зелёный прямоугольник), и несмотря на сильное давление, цена перестала снижаться. Напротив, она восстанавливалась: локальные минимумы не обновлялись (зелёная стрелка). Это свидетельствовало о том, что лимитный покупатель включился в работу и удерживал цену.
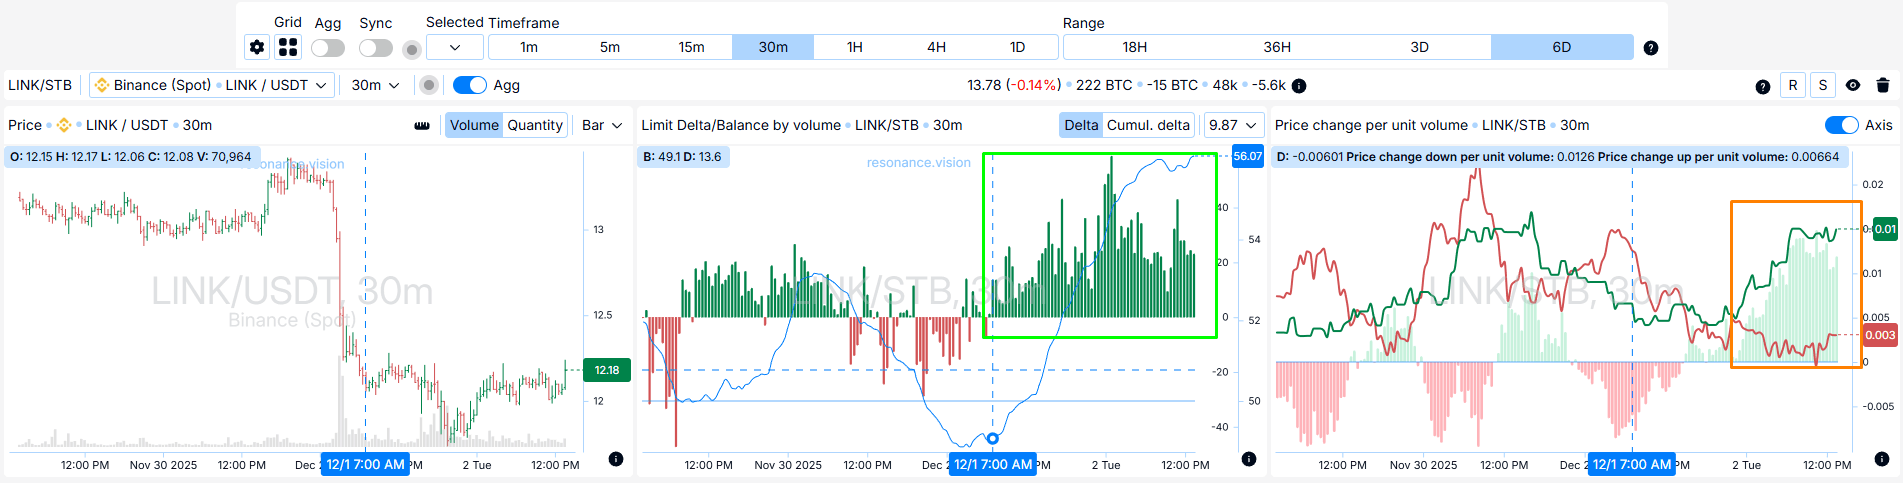
- Дешборд: подтверждение агрегированными метриками
Лимит Дельта/Баланс по объему:
Преобладание лимитных заявок на покупку (зеленый прямоугольник) по агрегированным данным со всех бирж указало на устойчивый пасивный интерес со стороны покупателей. Такая активность формирует сильную поддержку и повышает вероятность для дальнейшего роста цены.
Изменение цены на единицу объёма:
Графики эффективности воздействия рыночных ордеров покупателей и продавцов разошлись в пользу покупателей (оранжевый прямоугольник), это указывало на рост эффективности покупок.
Любая торговая идея должна реализовываться в рамках четкого плана управления рисками. Размер позиции рассчитывался исходя из допустимой потери на сделку - 1% от депозита, а стоп-лосс был выставлен сразу при входе, за зону неэффективных продаж.
Причины выхода
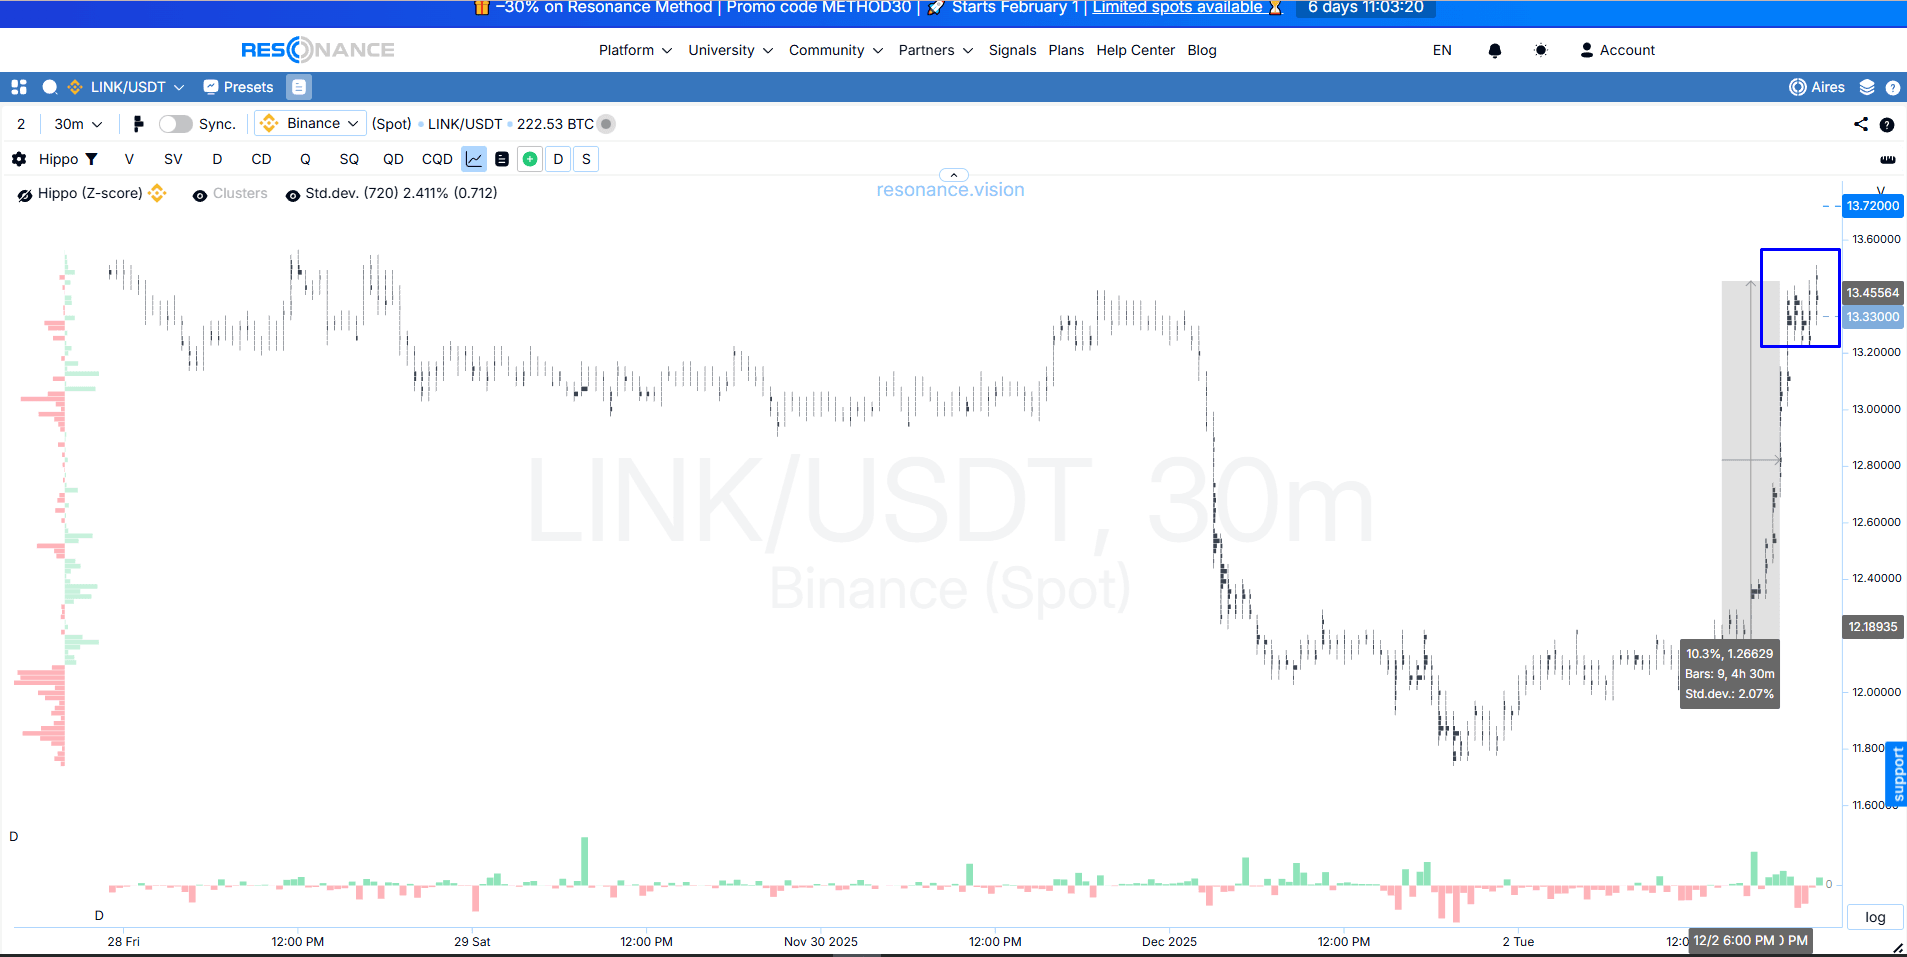
- Кластерный график: остановка ценового движения
Был сформирован дефицит и цена показала импульсный выход вверх. Цена От точки входа выросла более чем на 10% и в рамках дня это существенное ценовое движение. Также начали формироваться кластерные накопления по объему (синий прямоугольник). Это признак остановки ценового движения и возможного разворота
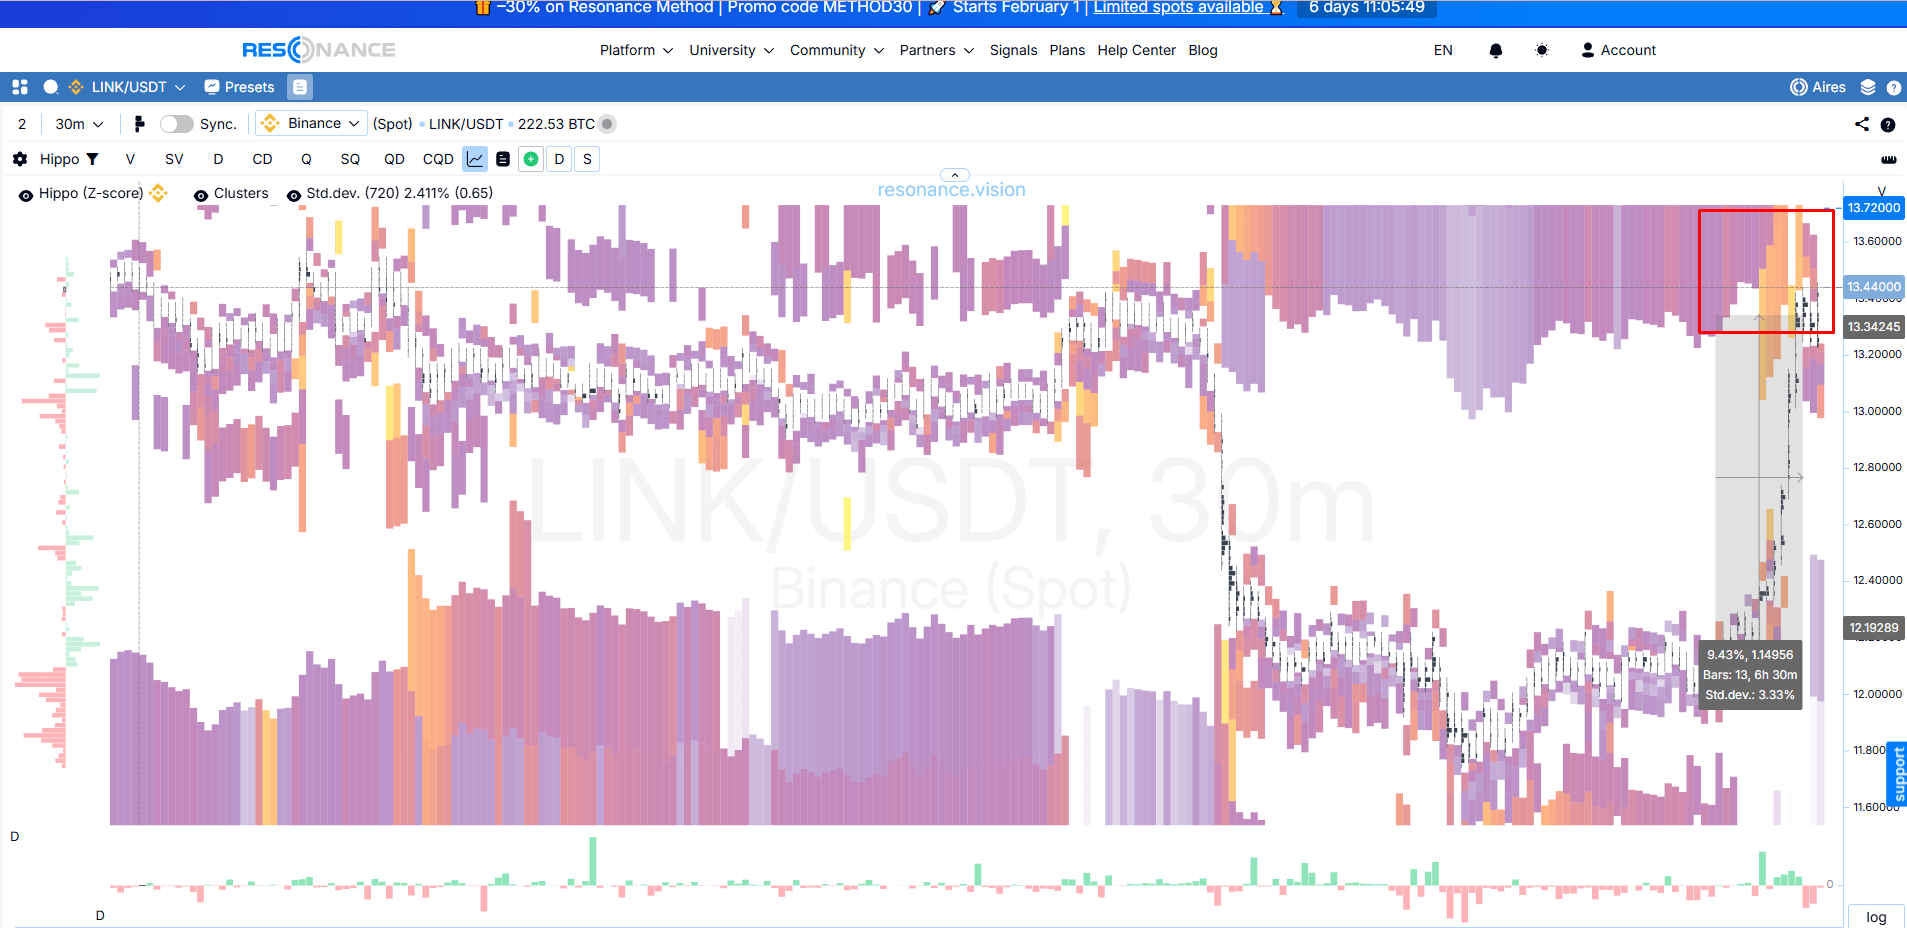
- Тепловая карта: лимитное сопротивление
На тепловой карте фиксируется большое преобладание лимитных ордеров на продажу (красный прямоугольник). Пока сложно понять, хватит ли сил покупателю пройти такое препятствие, поэтому закрытие позиции вполне логично
Выход был сделан немного поспешно и все равно удалось хорошо заработать.
Вывод по сделке:
Это еще один отличный пример позиции, открытой на основе анализа объемов. Позиция открывалась на основе признаков дефицита: маркет-продажи доминировали, но цена начала медленно подниматься, локальные минимумы не обновлялись. Все это сопровождалось хорошей лимитной активностью покупателя. Далее после роста цены было принято решение о закрытии позиции на признаках профицита: преобладание лимитов продавца и остановка движения.
Следи за новыми статьями в нашем телеграм канале.
Не нужно выдумывать сложных схем и искать “грааль”. Используй инструменты платформы Resonance.
Регистрируйся по ссылке — получай бонус и начинай зарабатывать:
OKX | BingX | KuCoin.
Промокод TOPBLOG дает тебе 10% скидки на любой тарифный план Resonance.
Рекомендуемые статьи


