SYN +22.3% (Направленная стратегия Резонанс)

Пример сделки, где при доминировании маркет-продаж цена перестала снижаться. Кластерный анализ, агрегированные данные и лимитное поглощение объёма позволили объективно определить точку входа и своевременно зафиксировать движение.
Содержание

Монета: SYN/USDT
Риск: средний
Уровень понимания: новичок
Причины входа
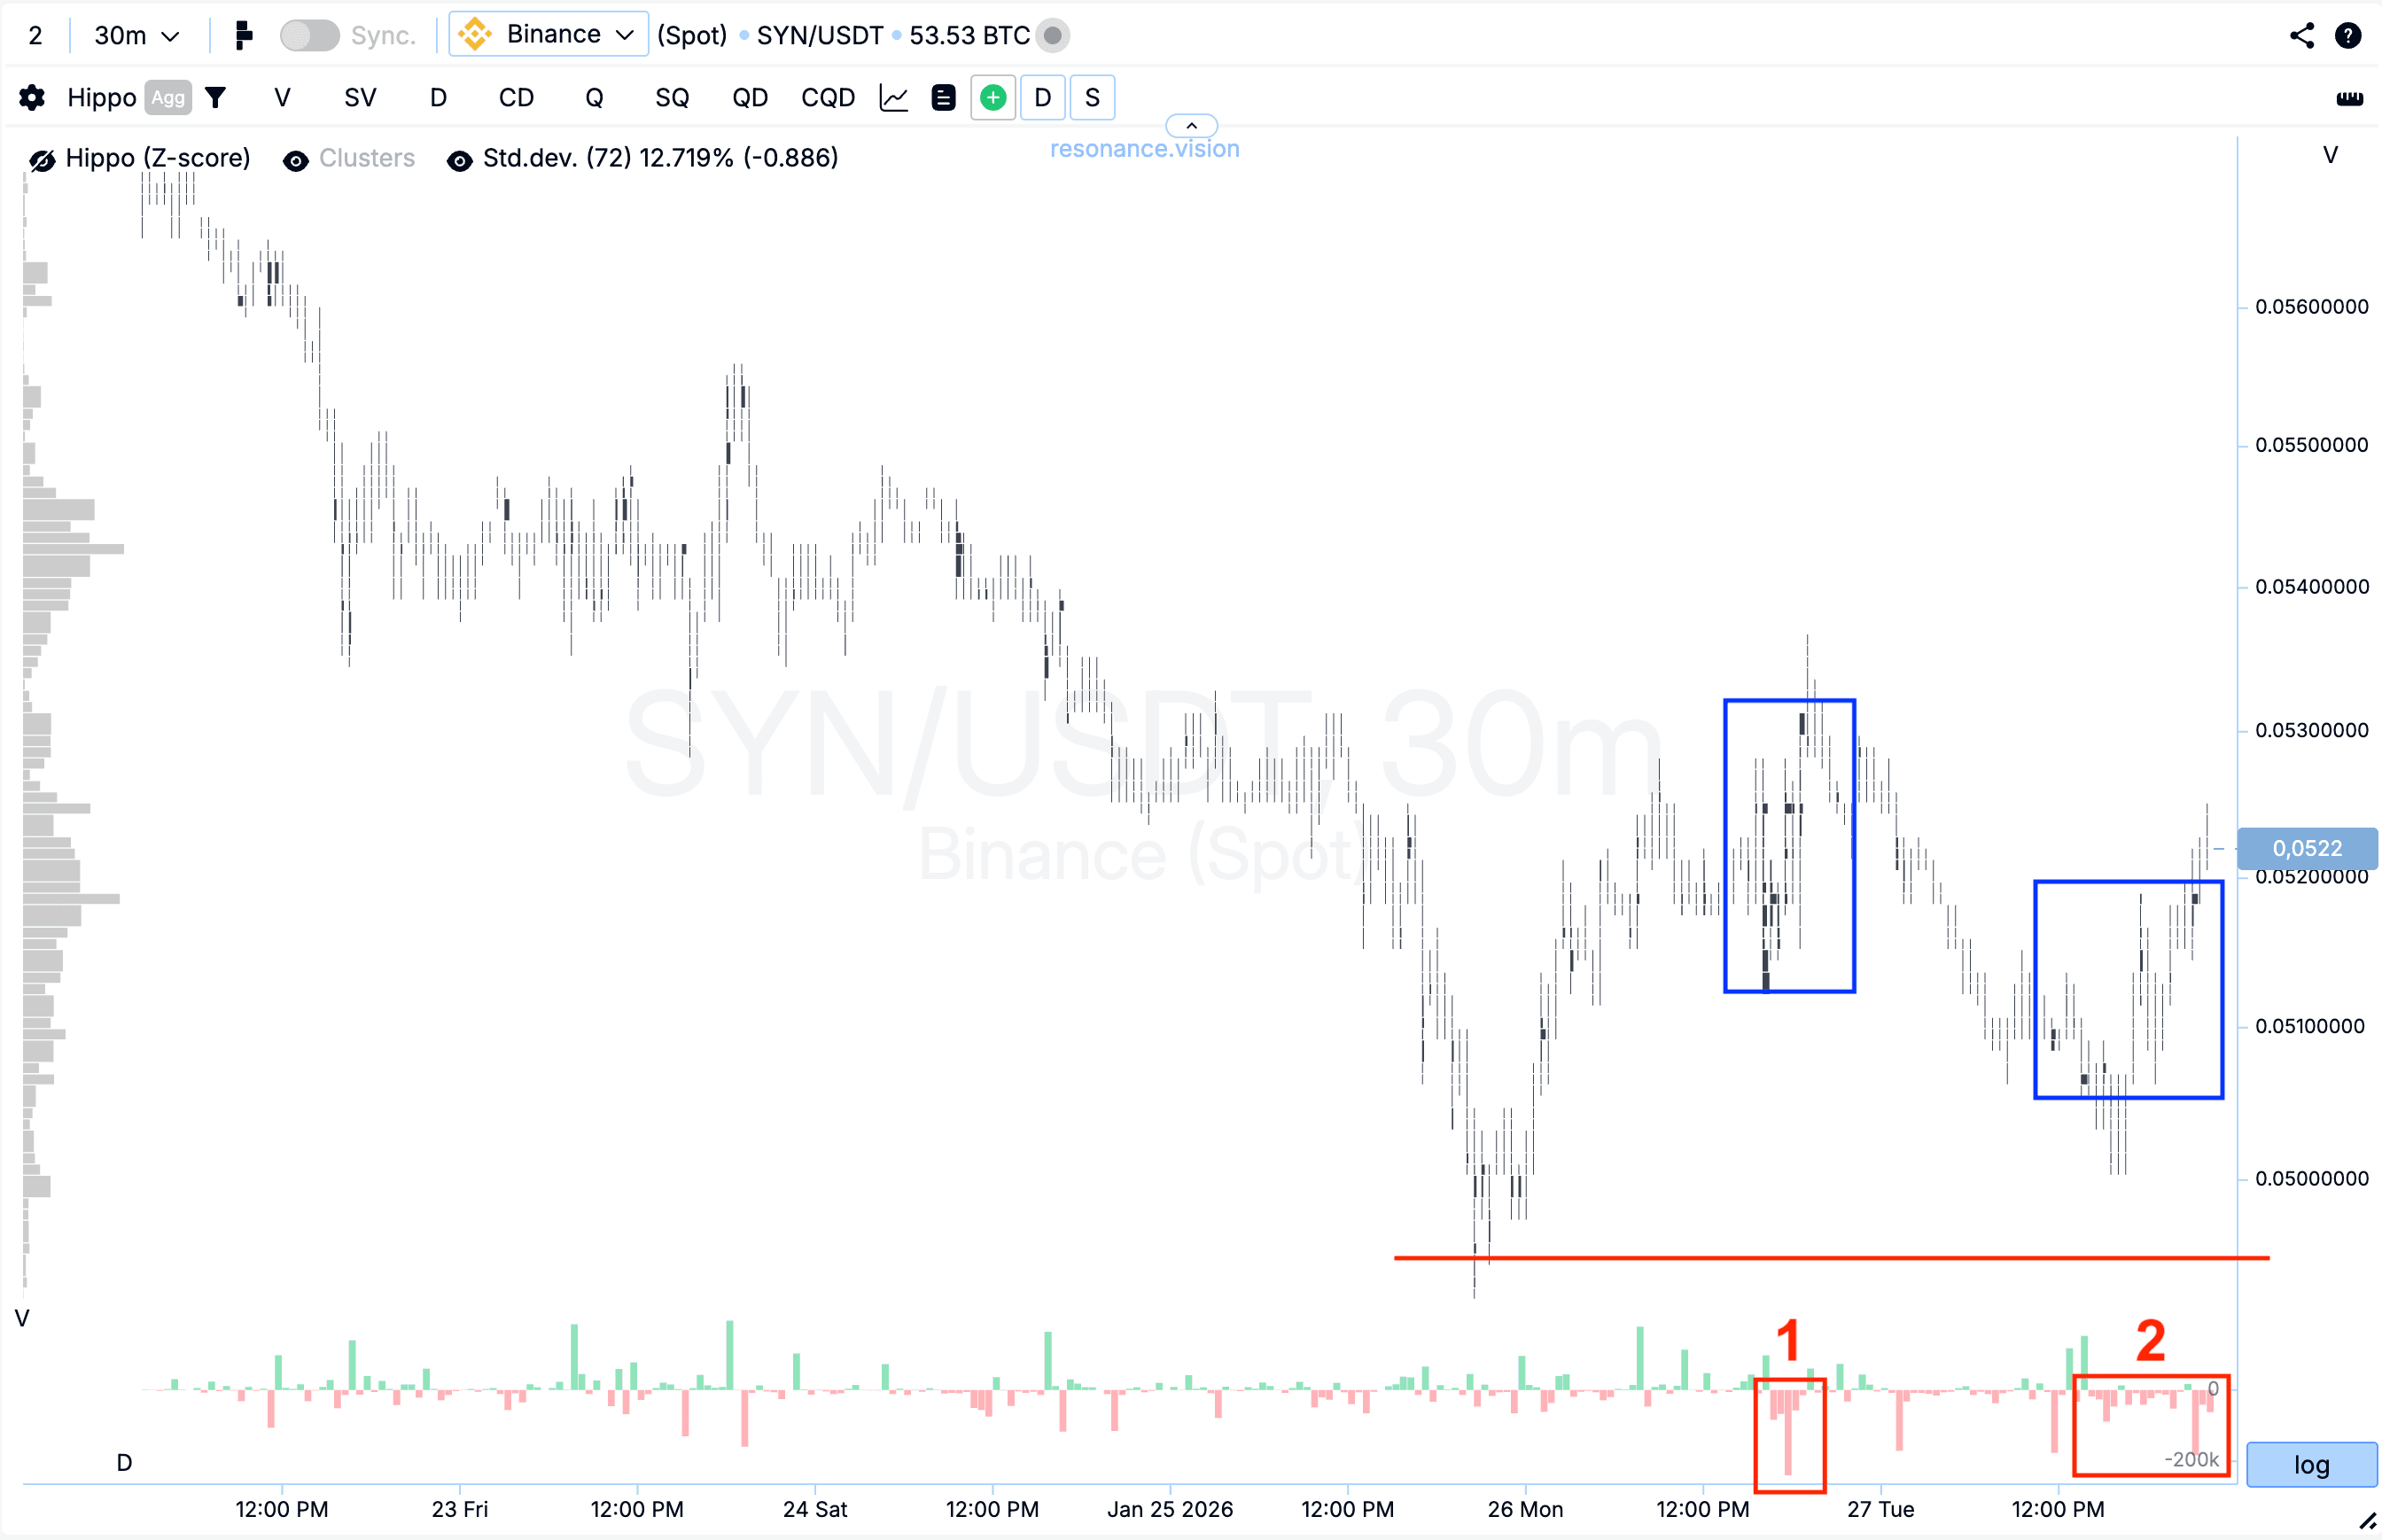
Кластерный график: в зоне локально боковой проторговки начали формироваться крупные кластера по объёму (синие прямоугольники). При первой попытке наблюдалось существенное преобладание маркет-продаж, однако цена практически не отреагировала на этот объём (красный прямоугольник №1).
После все же был незначительный откат, давление со стороны маркет-продавцов сохранялось, однако на последующих продажах цена начала постепенно расти (красный прямоугольник №2), при этом локальный минимум так и не был обновлён (красная линия).
Такая реакция цены на объёмы указывает на признаки локального дефицита и снижение эффективности продавцов: объём продолжает поступать, но его влияние на цену заметно ослабевает.
В Дешборде
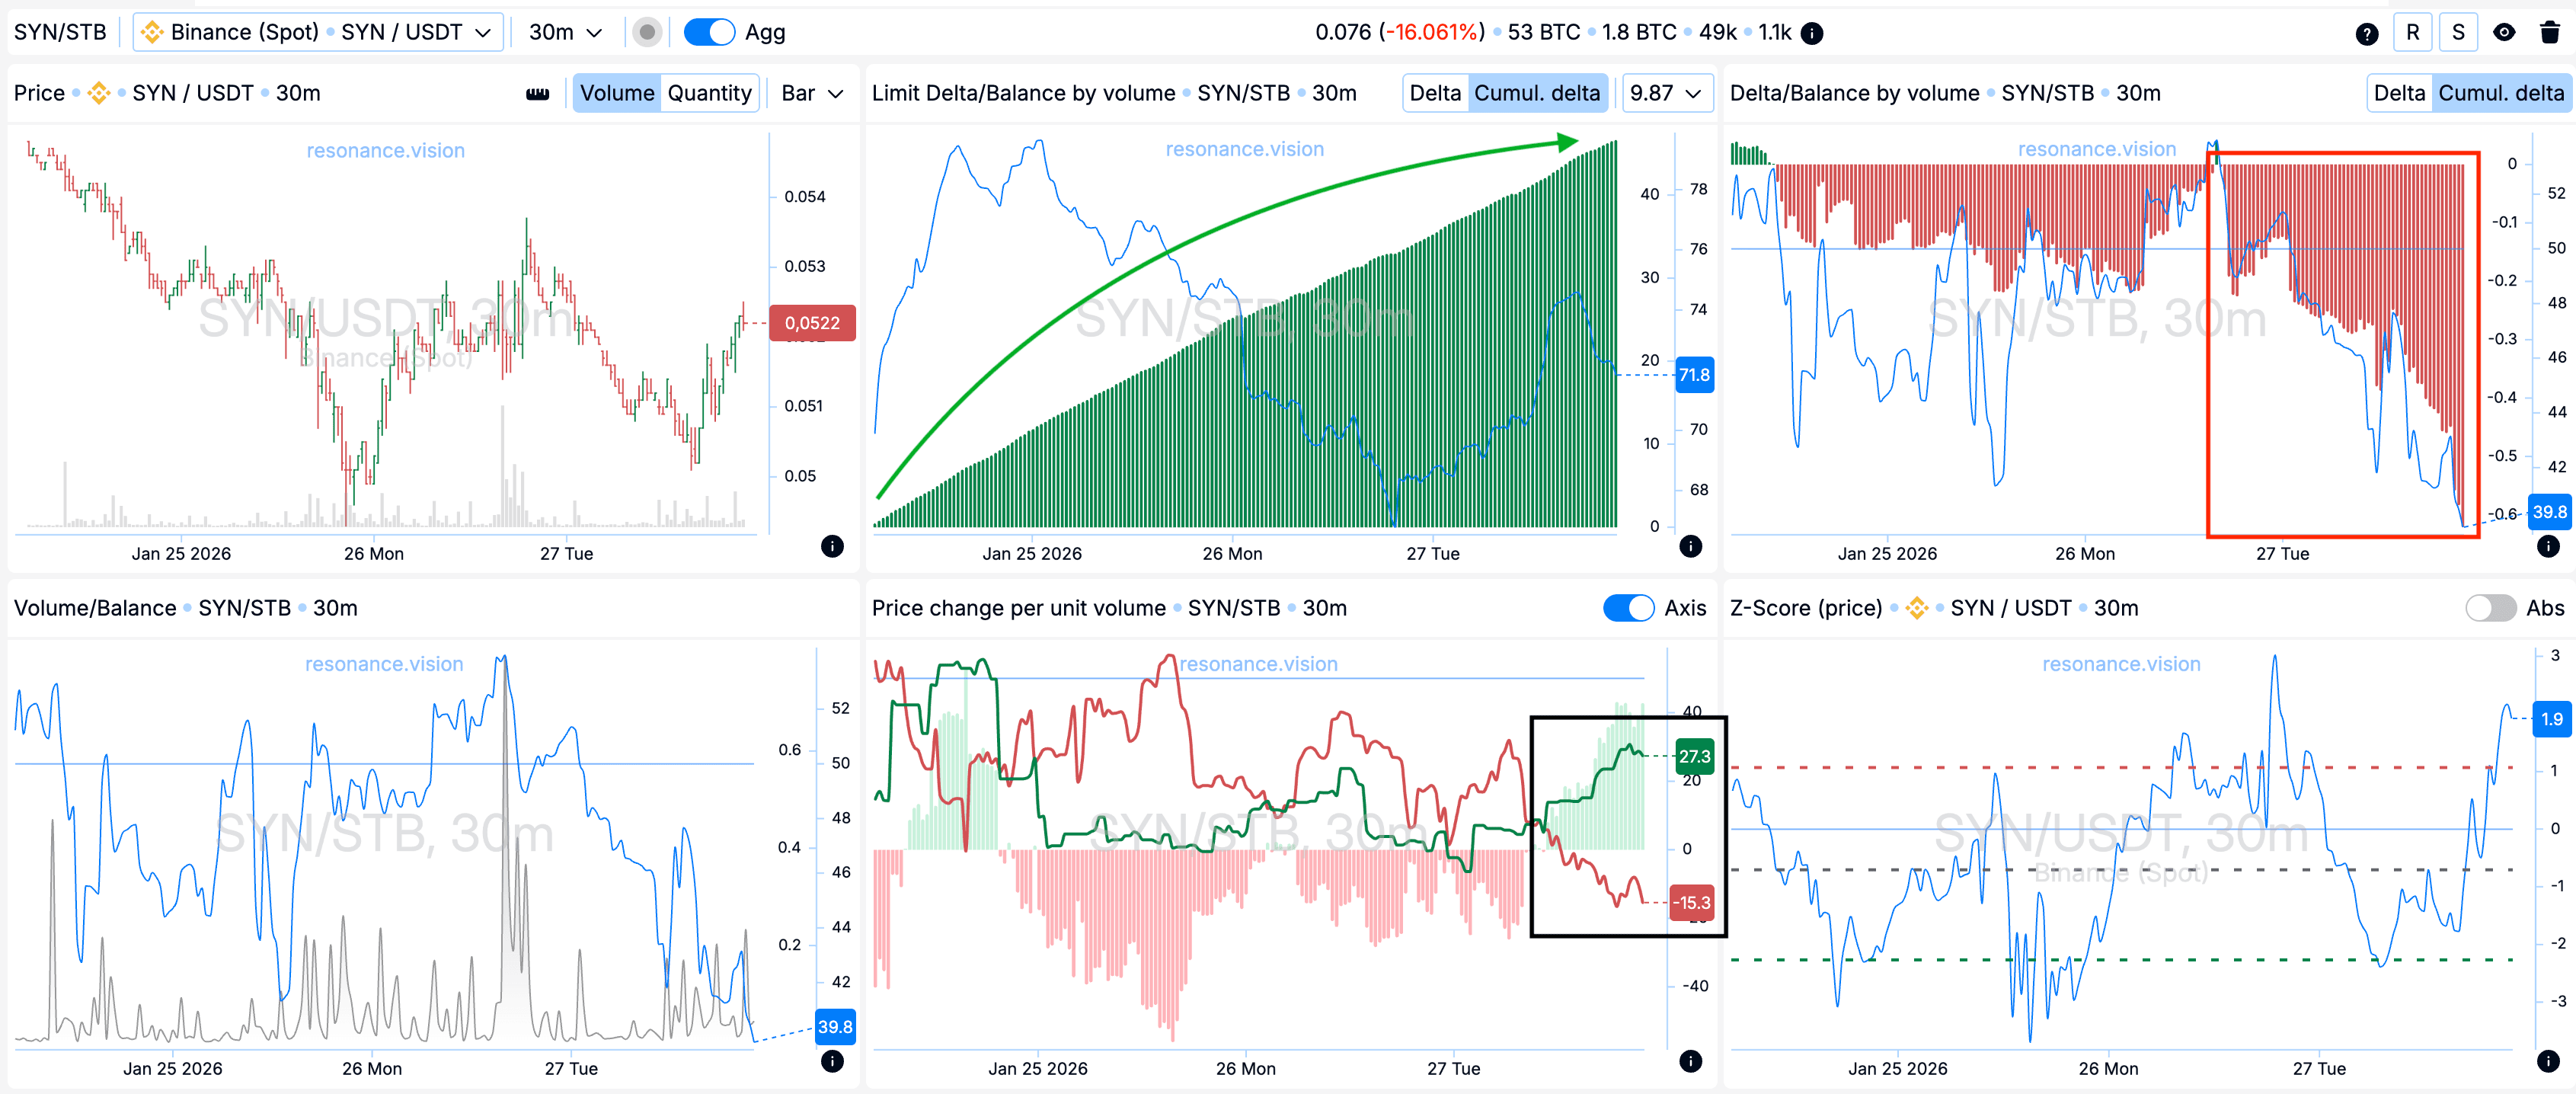
Дельта / Баланс по объёму и лимитная дельта: анализ агрегированных данных по всем парам и биржам полностью подтверждает наблюдения с кластерного графика. В рассматриваемый период рынок находился под выраженным давлением маркет-продаж, что отчётливо видно по гистограмме кумулятивной дельты (красный прямоугольник).
Одновременно с этим лимитные заявки на покупку последовательно накапливались, что отражено ростом кумулятивной лимитной дельты (зелёная стрелка).
Несмотря на доминирование рыночных продаж, цена не демонстрировала дальнейшего снижения. Это указывает на наличие устойчивого лимитного спроса, который поглощал весь входящий рыночный объём на продажу и формировал локальную поддержку в данном диапазоне.
Изменение цены на единицу объёма: дополнительно видно, что эффективность воздействия рыночных ордеров разошлась в пользу покупателей (чёрный прямоугольник), что указывает на рост эффективности покупок.
Причины выхода
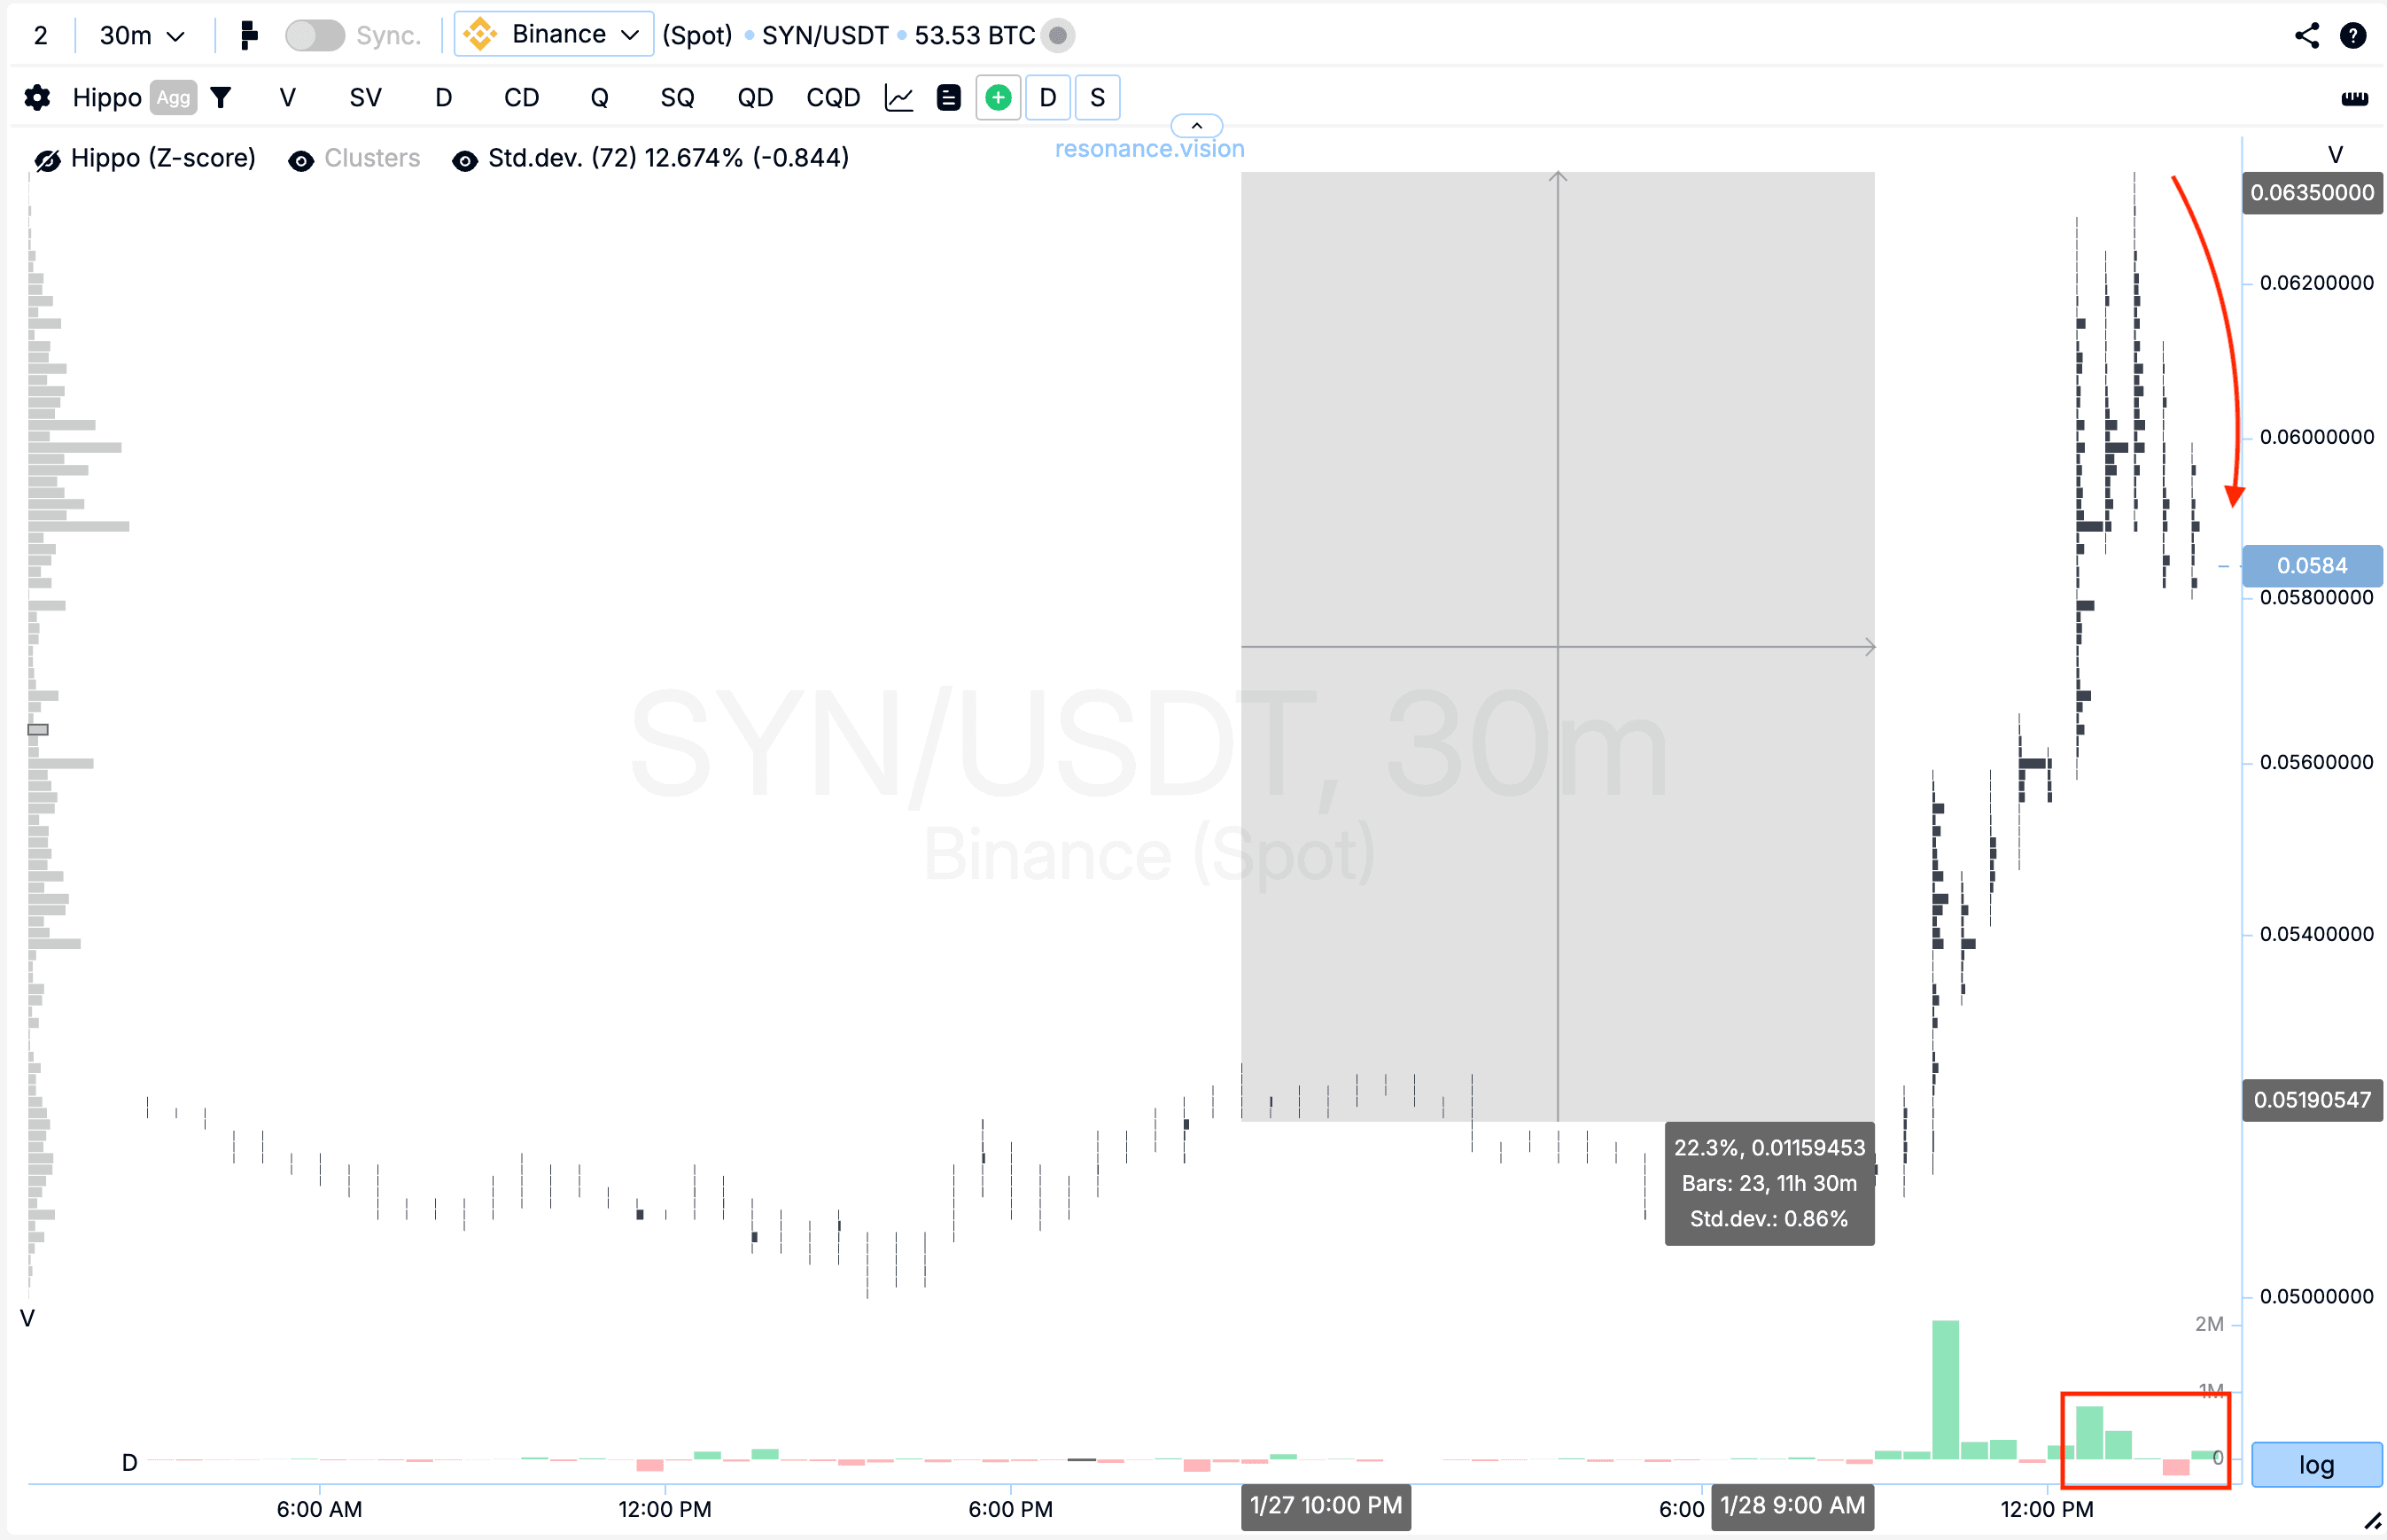
Кластерный график: от точки входа цена выросла на 22,3%, что относится к относительно сильному ценовому движению. На фоне роста заметно увеличилась волатильность, после чего сформировался выраженный откат.
Внутри этого движения объёмы на покупку начали постепенно снижаться, уступая место преобладающим маркет-продажам (прямоугольник и стрелка). Такая динамика указывает на перехват инициативы в сторону продавцов.
В этих условиях дальнейшее удержание позиции становилось менее оправданным с точки зрения риска, поэтому фиксация прибыли выглядела логичным и взвешенным решением.
Заключение
Данный разбор наглядно показывает, что сильные и качественные движения формируются не из-за самих объёмов, а из-за реакции цены на эти объёмы. Несмотря на доминирование маркет-продаж, цена перестала обновлять минимумы, а последующее накопление лимитного спроса привело к формированию локальной поддержки и последующему движению вверх.
Подобные ситуации на рынке возникают достаточно часто, однако ключевая задача трейдера - не искать сам объём, а оценивать его эффективность. Когда объёмы продолжают входить, но цена перестаёт на них реагировать, это зачастую становится первым сигналом к смене рыночной инициативы. Именно такой объективный подход позволяет выстраивать сделки с понятной логикой и контролируемым риском.
Следи за новыми статьями в нашем телеграм канале.
Не нужно выдумывать сложных схем и искать “грааль”. Используй инструменты платформы Resonance.
Регистрируйся по ссылке — получай бонус и начинай зарабатывать:
OKX | BingX | KuCoin.
Промокод TOPBLOG дает тебе 10% скидки на любой тарифный план Resonance.
Рекомендуемые статьи


