ZK +68.5% (Направленная стратегия Резонанс)

Разбор по паре ZK/USDT показывает, как через объемы и дельту можно увидеть истинное соотношение спроса и предложения на рынке. Формирование W-образной формации и неэффективность продаж указывают на ослабление давления продавцов и появление локального дефицита. Подтверждение через агрегированные данные Дешборда усиливает сигнал — лимитные покупки начали активно принимать рыночные продажи, что сформировало основу для роста. Этот пример отлично демонстрирует, почему важно анализировать не просто цену, а влиянием этого объема на ценовое движение.
Содержание

Монета: ZK/USDT
Риск: средний
Уровень понимания: новичок
Причины входа
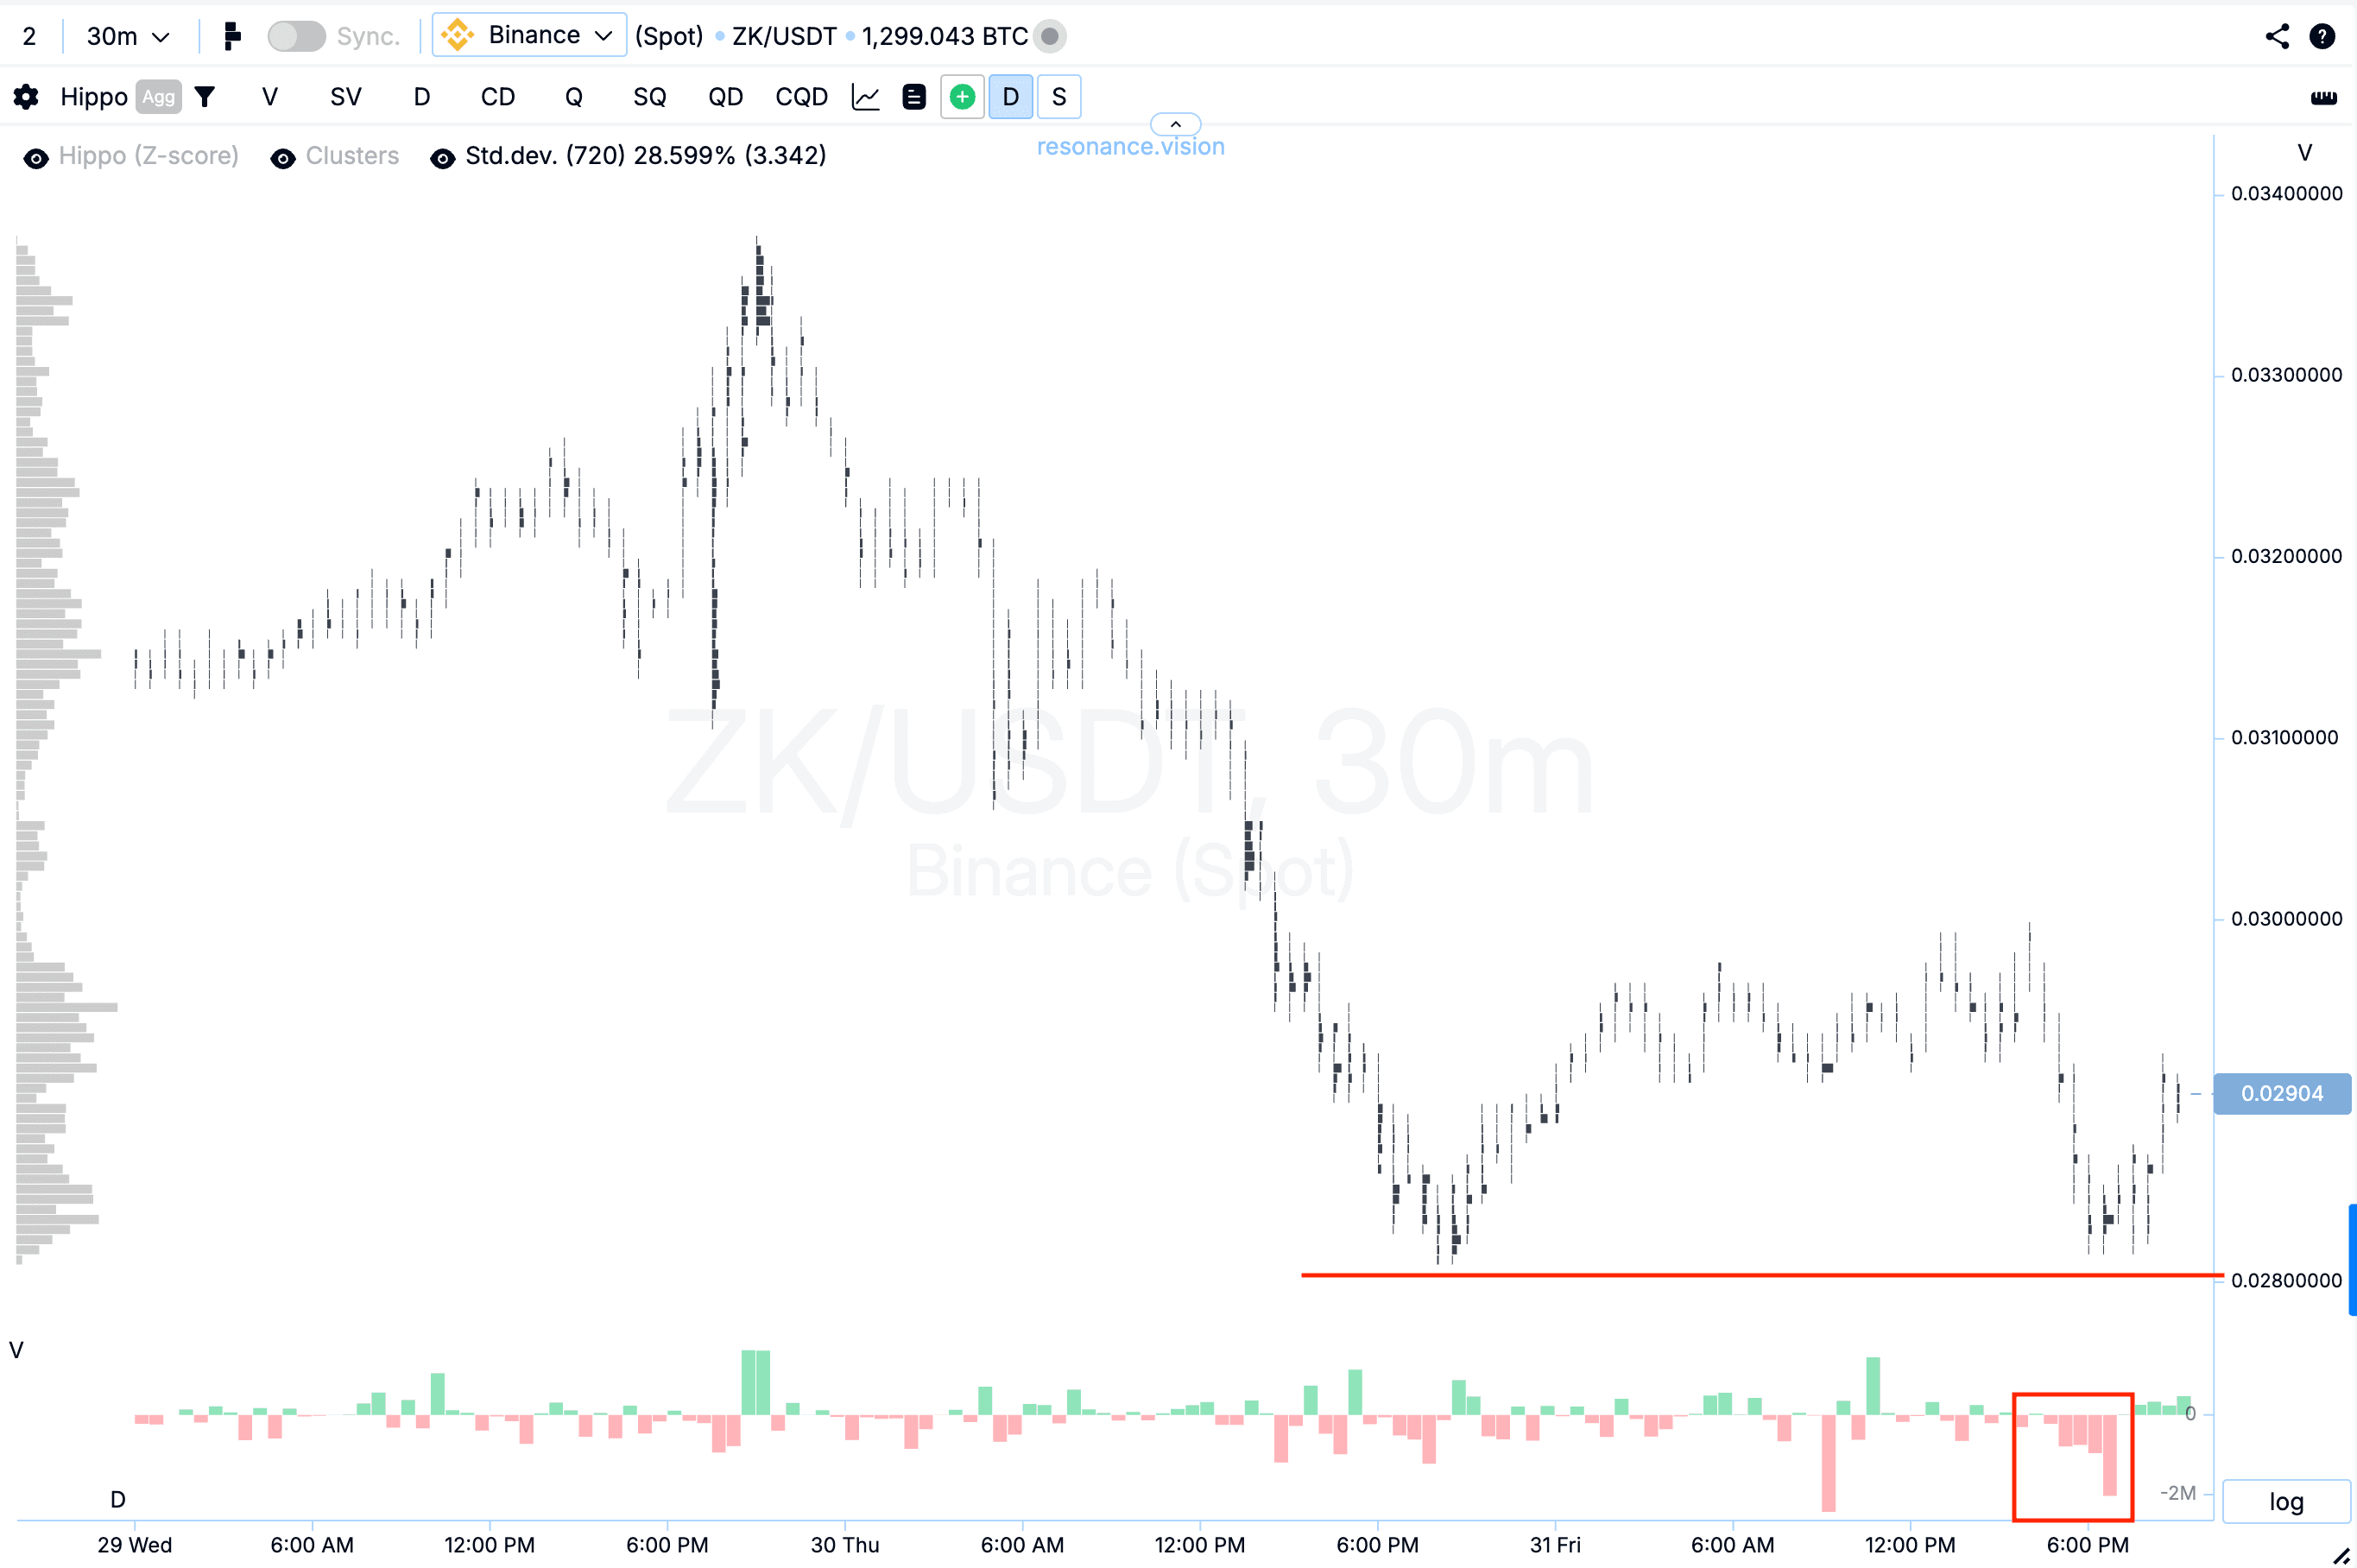
Кластерный график: сформировалась W-образная формация, в которой значительные объёмы продаж (красный прямоугольник и линия) не привели к обновлению локального минимума. Подобная динамика указывает на наличие признаков локального дефицита и ослабление давления со стороны продавцов.
В Дешборде
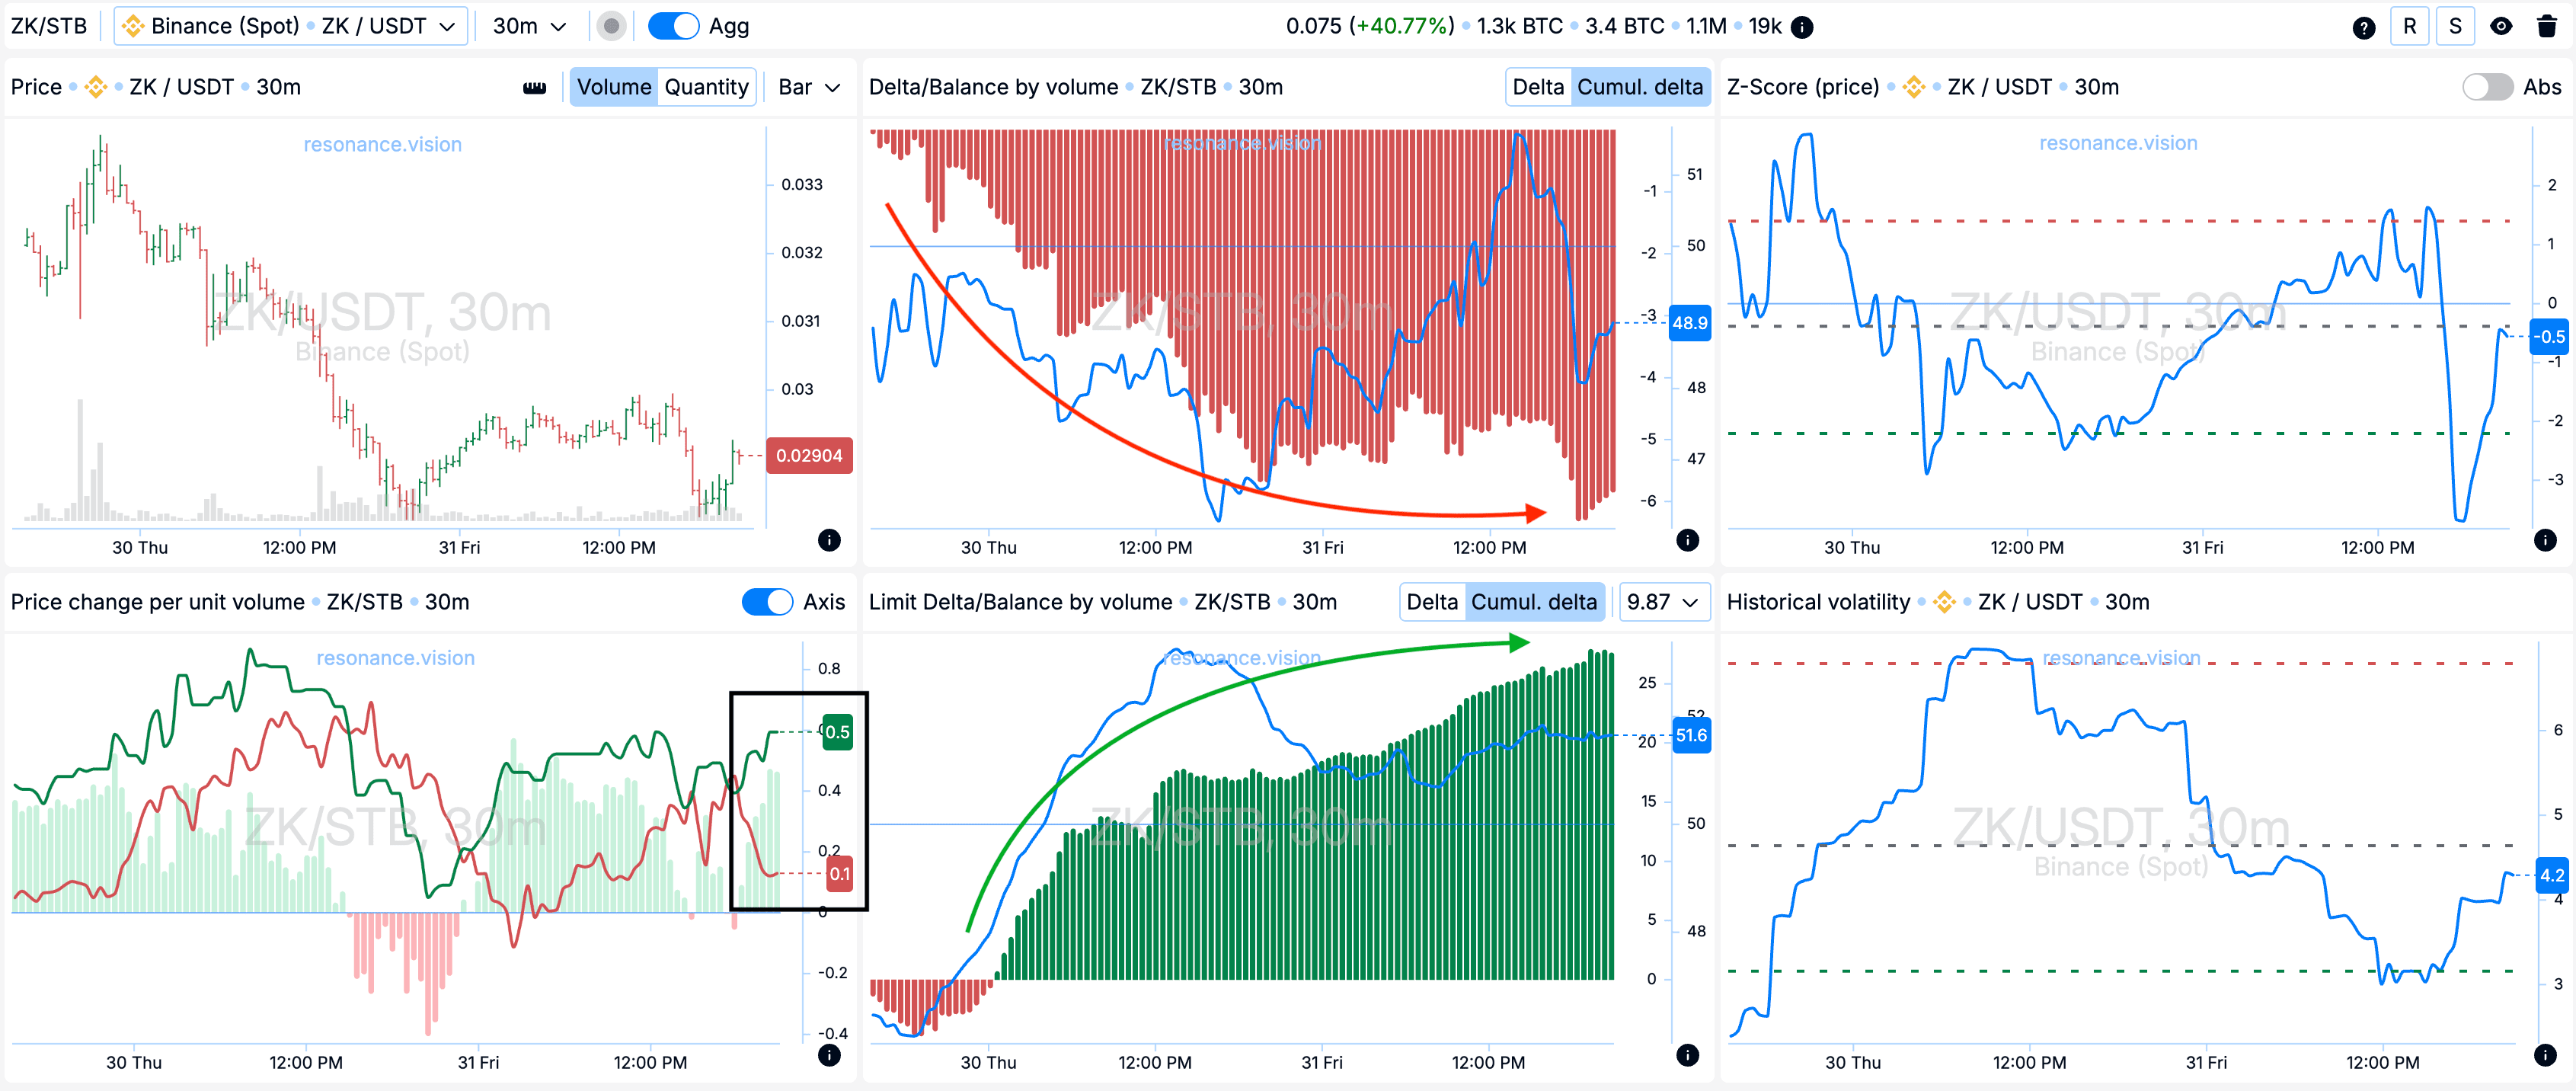
Дельта / Баланс по объёму и лимитная дельта: при оценке агрегированных данных по всем парам и биржам наблюдается подтверждение картины, отмеченной на кластерном графике. В этот период по рынку доминировали объёмы продаж - это отчётливо видно по гистограмме кумулятивной дельты (красная стрелка). При этом по лимитным заявкам фиксируется заметное увеличение количества заявок на покупку, что отражено на гистограмме кум. дельты (зелёная стрелка). Такая ситуация указывает на готовность участников лимитно принимать весь маркет-объём на продажу, что формирует локальную поддержку.
Изменение цены на единицу объёма: эффективность воздействия рыночных ордеров на цену начала расходится в пользу покупателей (чёрный прямоугольник), что выступает дополнительным аргументом в пользу открытия позиции в лонг.
Причины выхода
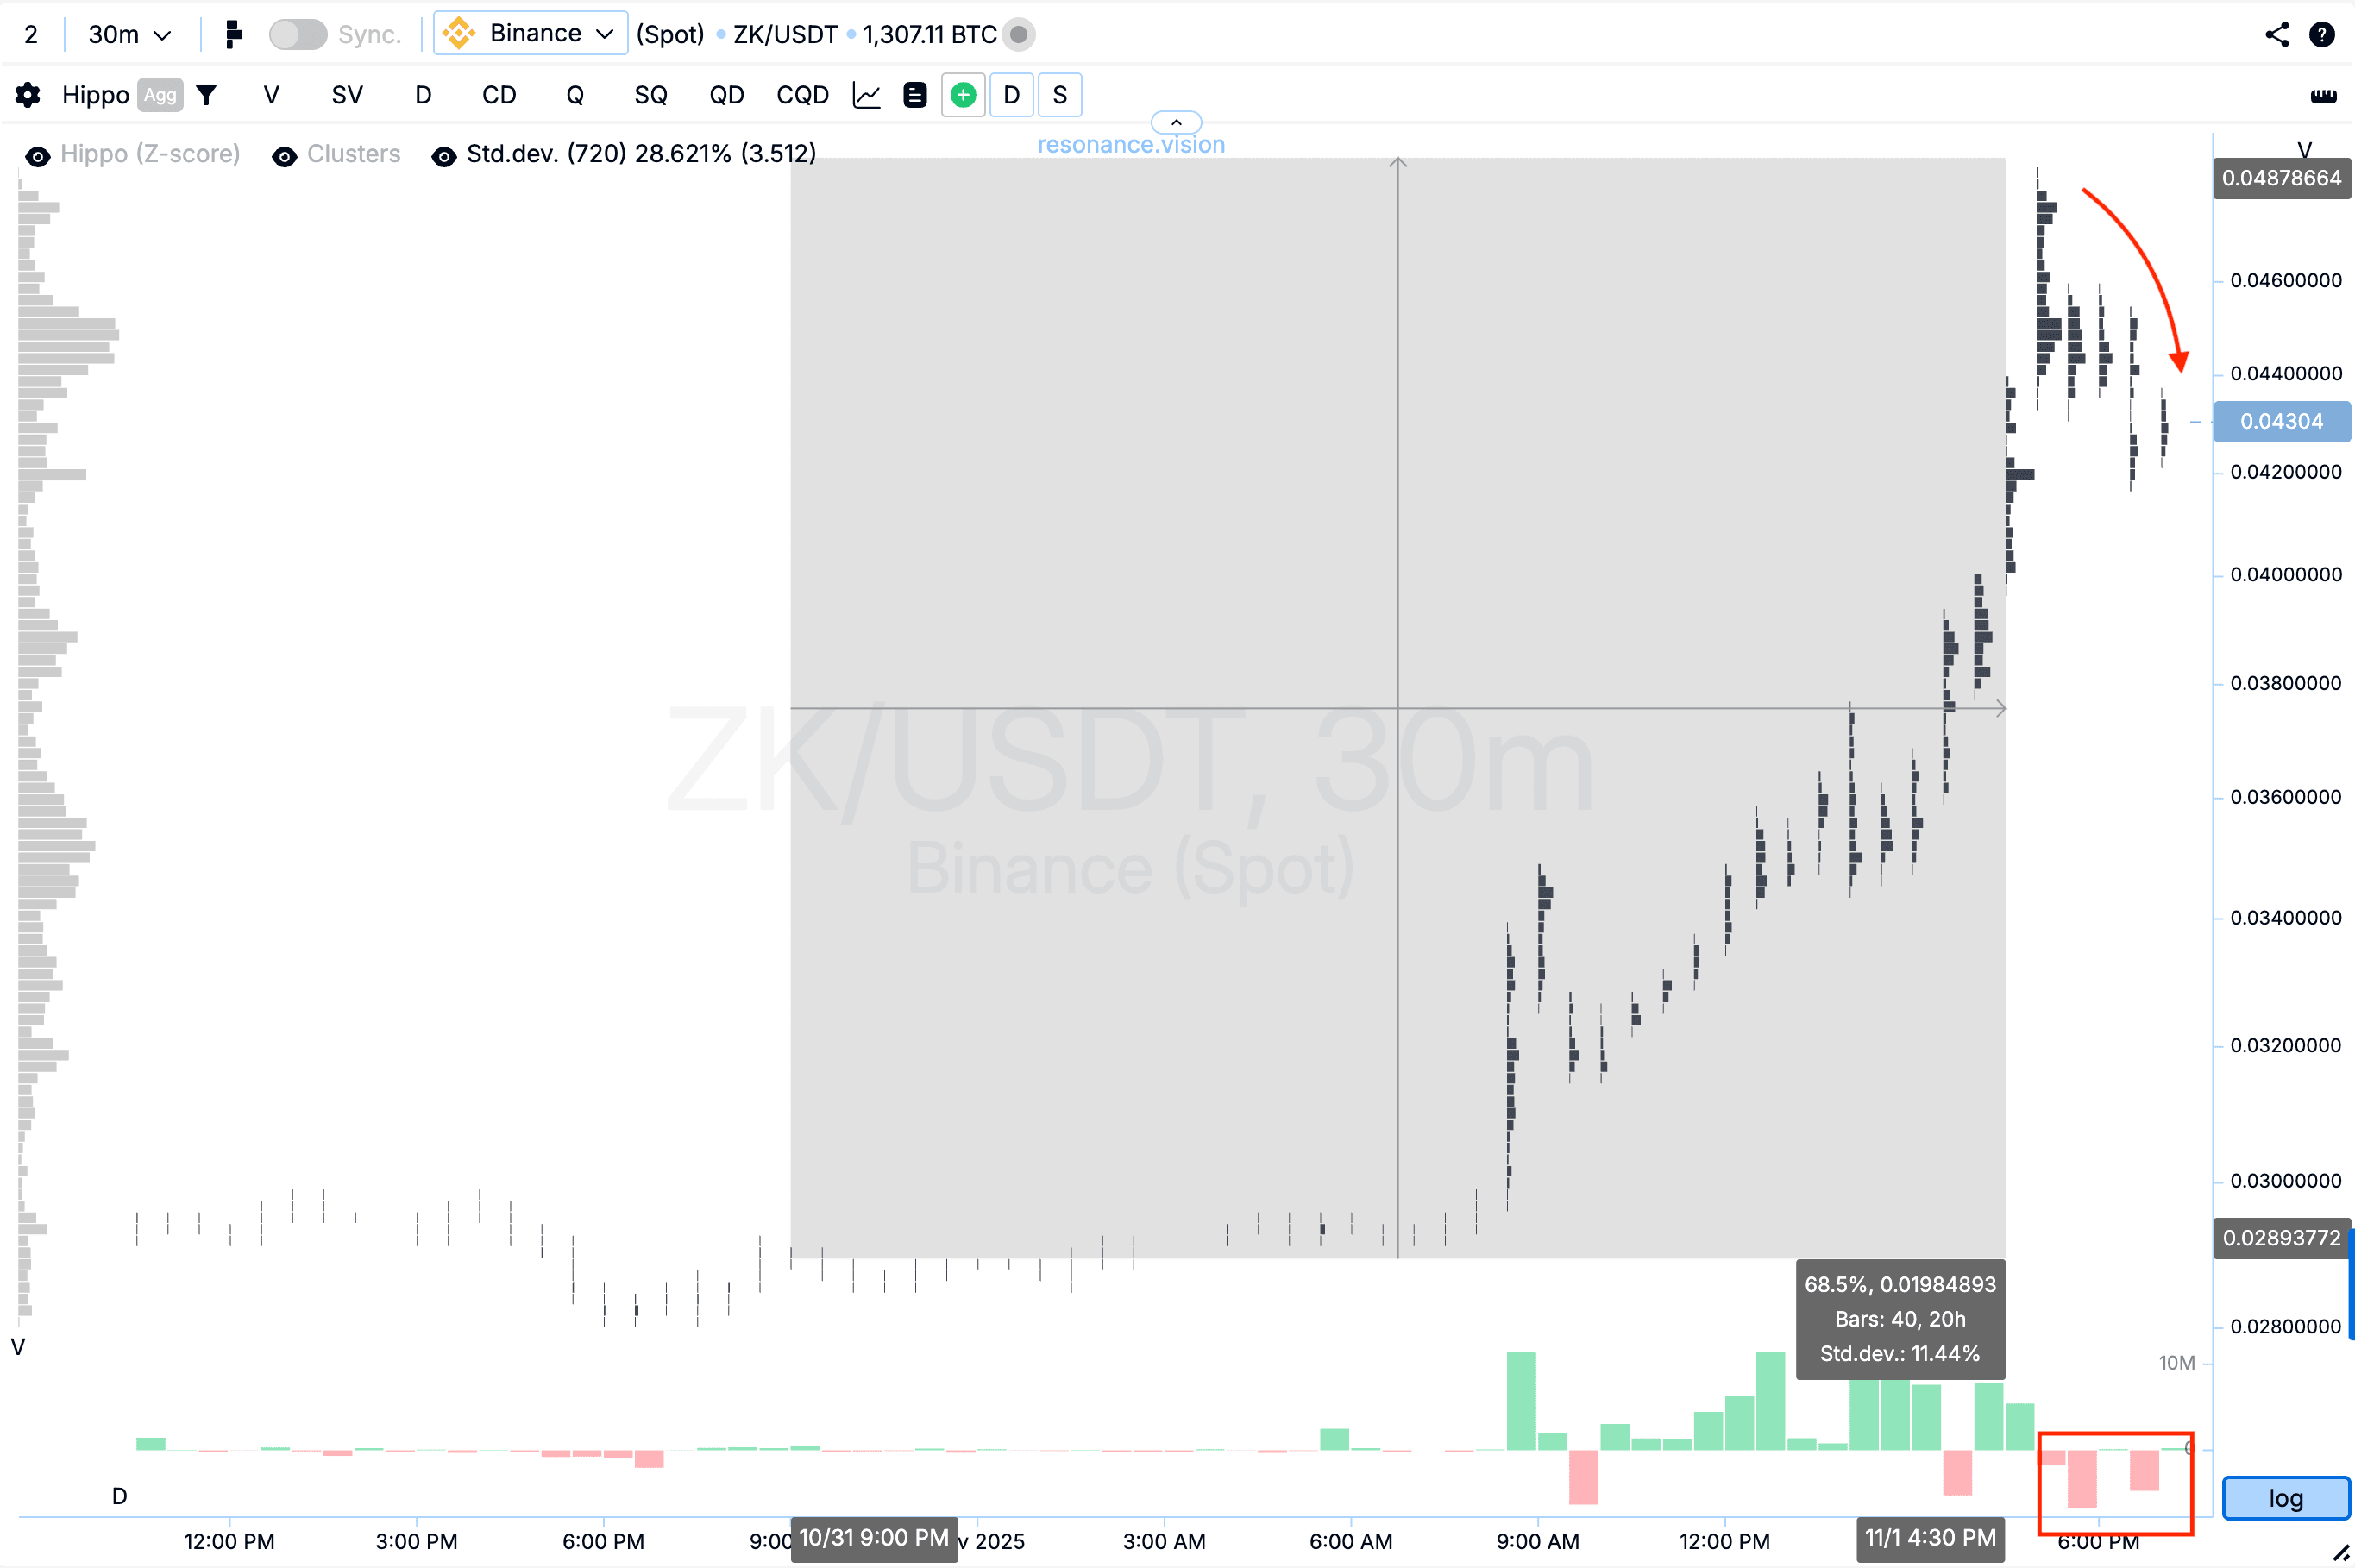
Кластерный график: от точки входа цена выросла почти на 70%, что само по себе является значительным ценовым движением. Однако впоследствии сформировался ощутимый откат, сопровождавшийся объёмными продажами (прямоугольник и стрелка), что может указывать на переход инициативы к продавцам. В такой ситуации дальнейшее удержание позиции повышает риск, поэтому фиксация прибыли выглядела наиболее рациональным и взвешенным решением.
Заключение
Данный разбор наглядно показывает, что любые движения цены - это следствие дисбаланса между спросом и предложением. Именно объемы позволяют увидеть, где на рынке проявляется слабость одной из сторон и где формируется потенциальное преимущество другой.
В рассматриваемом кейсе значительные продажи не смогли обновить лой, что послужило тригером о сокращении предложения. Подтверждение через Дешборд - усиление лимитных покупок и рост эффективности воздействия ордеров в сторону покупателей - показало смещение баланса в пользу спроса.
Таким образом, использование кластерного анализа помогает не просто “оценить” направление движения, а понимать, что именно происходит внутри рынка. И если помнить, что цена всегда является следствием взаимодействия спроса и предложения, то оценка кластеров и дельты становится инструментом основным способом видеть структуру рынка и принимать взвешенные решения.
Следи за новыми статьями в нашем телеграм канале.
Не нужно выдумывать сложных схем и искать “грааль”. Используй инструменты платформы Resonance.
Регистрируйся по ссылке — получай бонус и начинай зарабатывать:
OKX | BingX | KuCoin.
Промокод TOPBLOG дает тебе 10% скидки на любой тарифный план Resonance.
Рекомендуемые статьи


