Major Platform Update: New Features and Visual Comfort

Explore the massive Resonance platform update: a redesigned cluster chart, trade simulator, deep position analytics, and optimized asset search. We’ve made professional trading intuitive while maintaining the full power of supply and demand analysis tools. Try new features and our updated mini-course today.
Table of contents

We continue to make our platform more powerful while keeping it lightweight and easy to use. In this update, we focused on clarity and intuitive navigation: the interface is now cleaner, and working with data feels more logical.
How can you navigate the update? Below, you’ll find a detailed breakdown of each new feature. To make everything easier to understand, we have prepared screenshots for each section and highlighted the key changes. The platform will also guide you as you use it: almost every element is highlighted on hover and instantly explains its purpose.
New Cluster Chart
We have completely redesigned the visual side of the tool. The chart now feels much lighter and less overloaded while preserving the full depth of the data.
Below, we’ll walk through what exactly has changed in its structure.
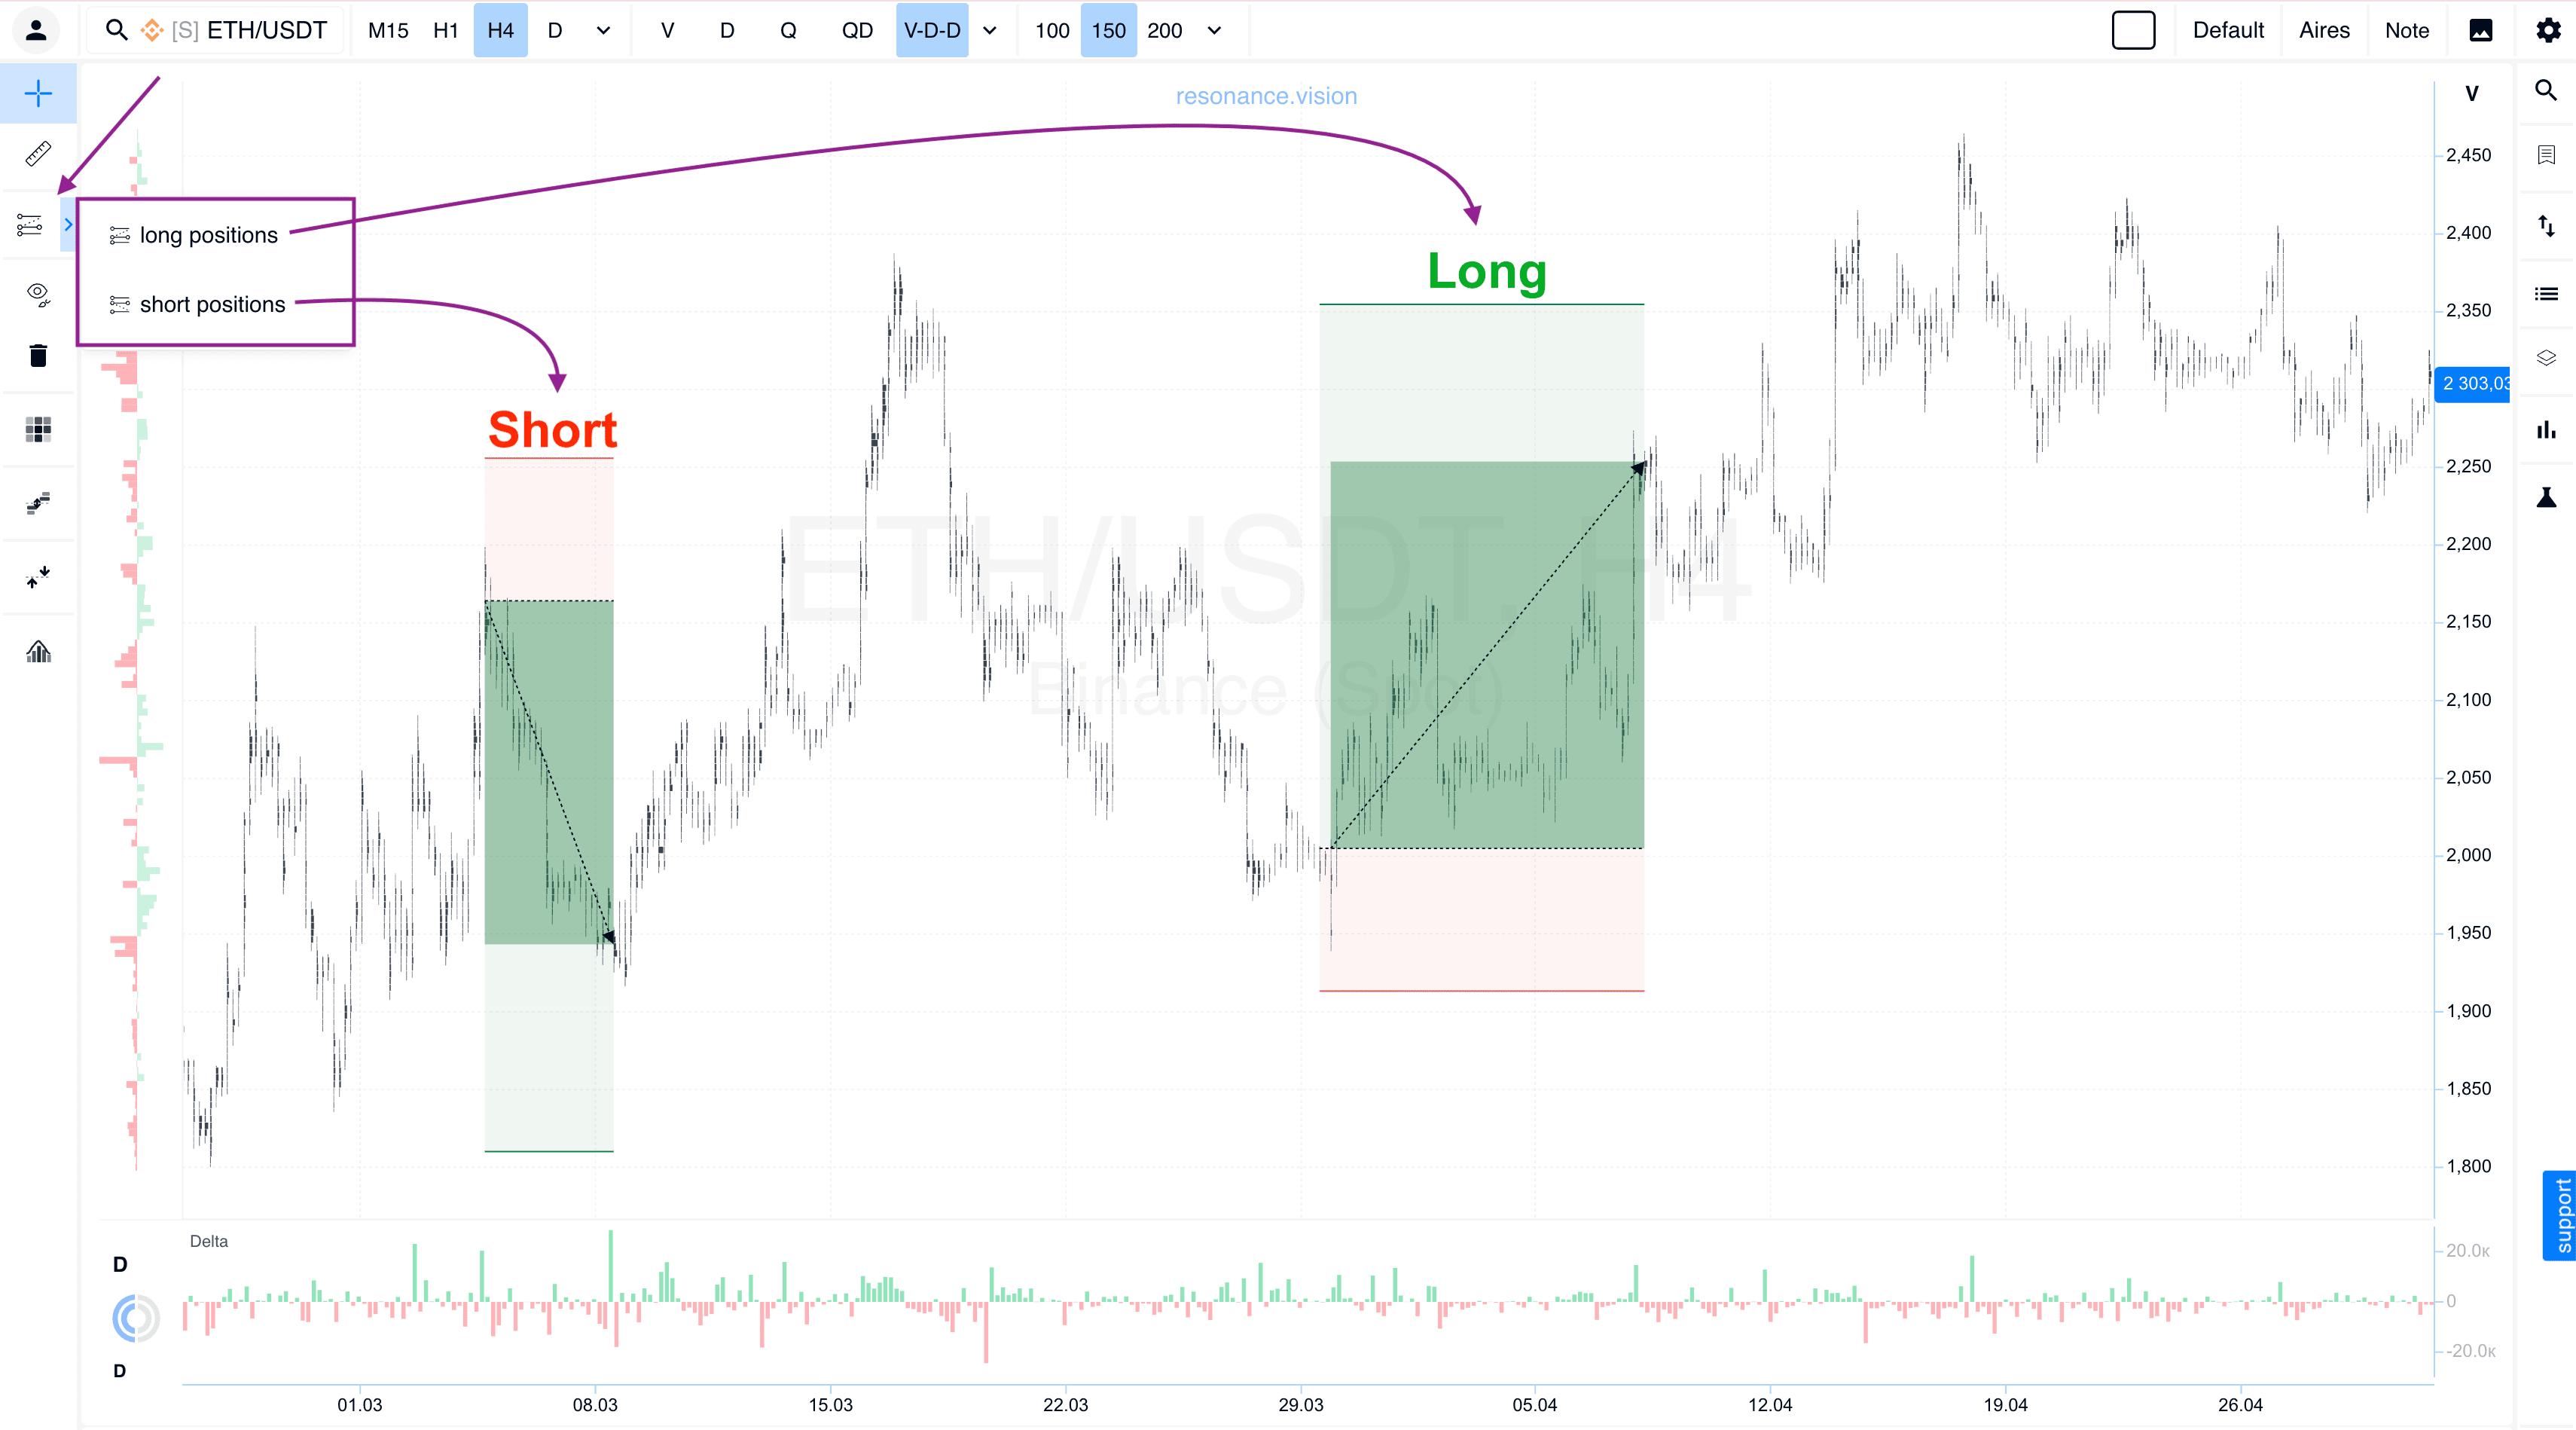
#1 Position Display
The chart now displays the opening points of your Long and Short positions. We have also added a quick workspace cleanup feature, allowing you to delete all open positions in one click.
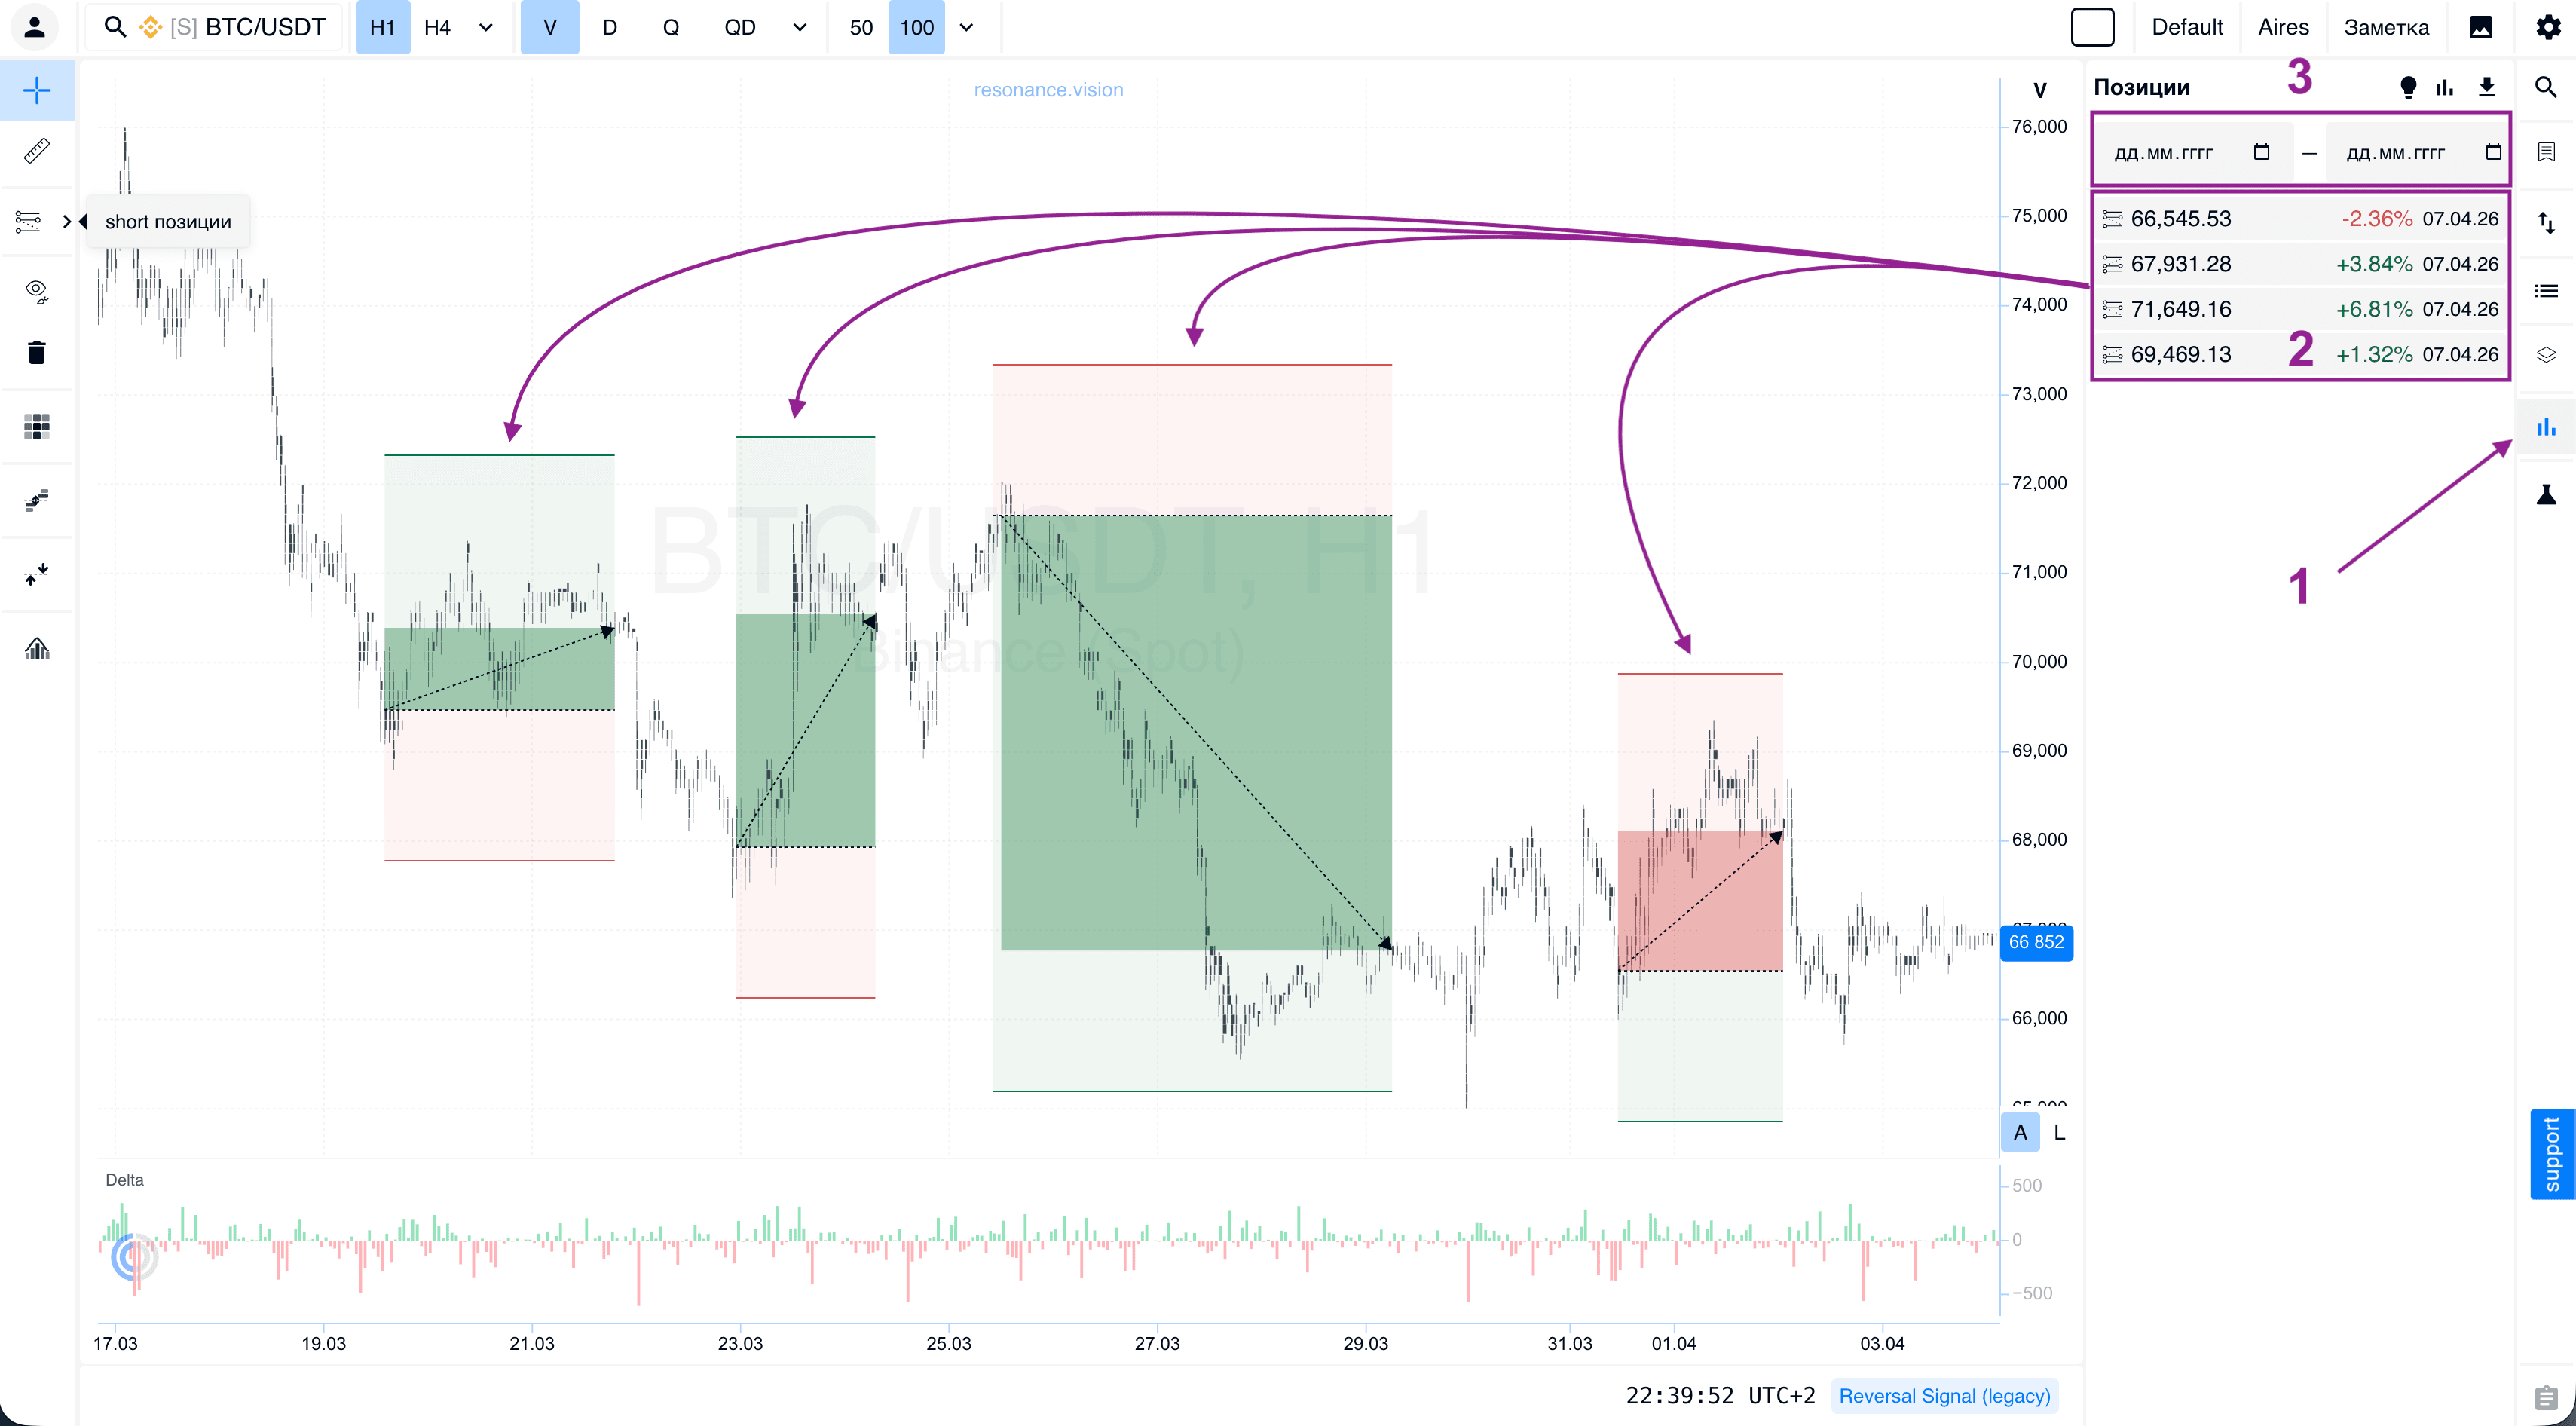
#2 Deep Position Analytics
A dedicated analytics window is now available. It brings together all your trade data in a structured format. You can use flexible date filters and calculate overall performance statistics.
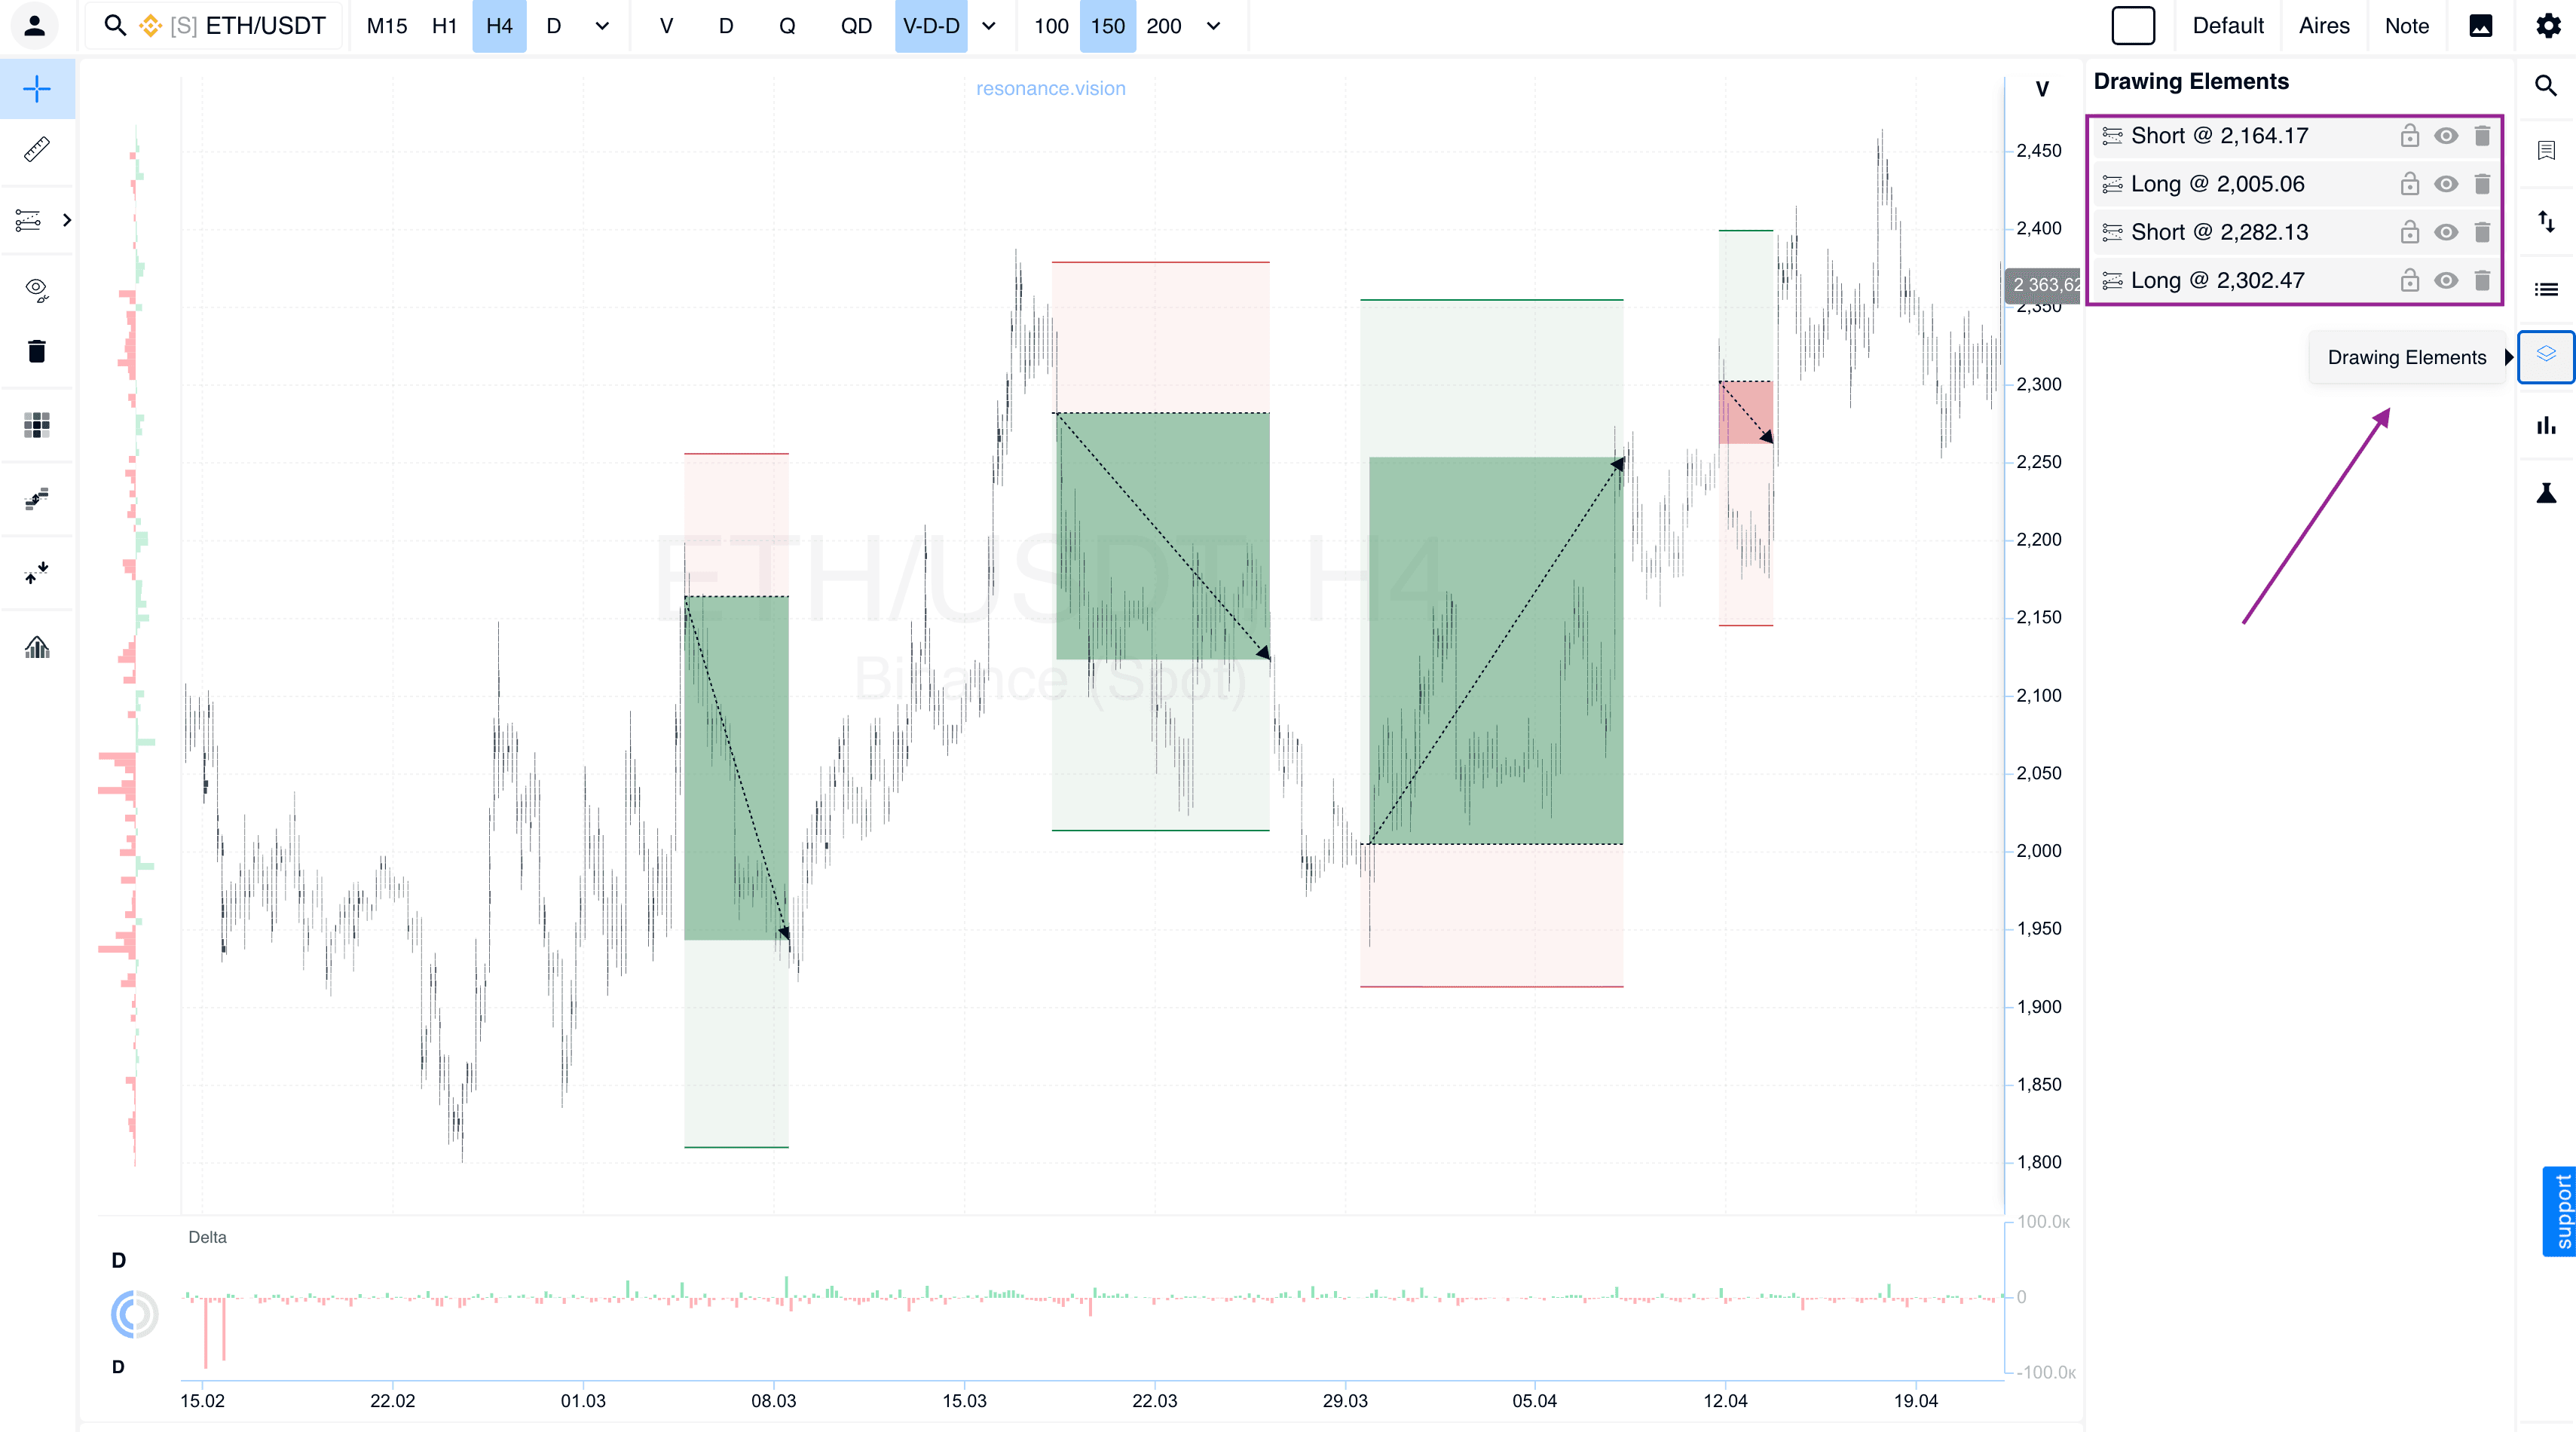
#3 Drawing Tools Management
You can now see a list of all active positions directly when opening the drawing tools. Individual elements can be hidden instantly so they do not interfere with your analysis, or permanently deleted if they are no longer needed.
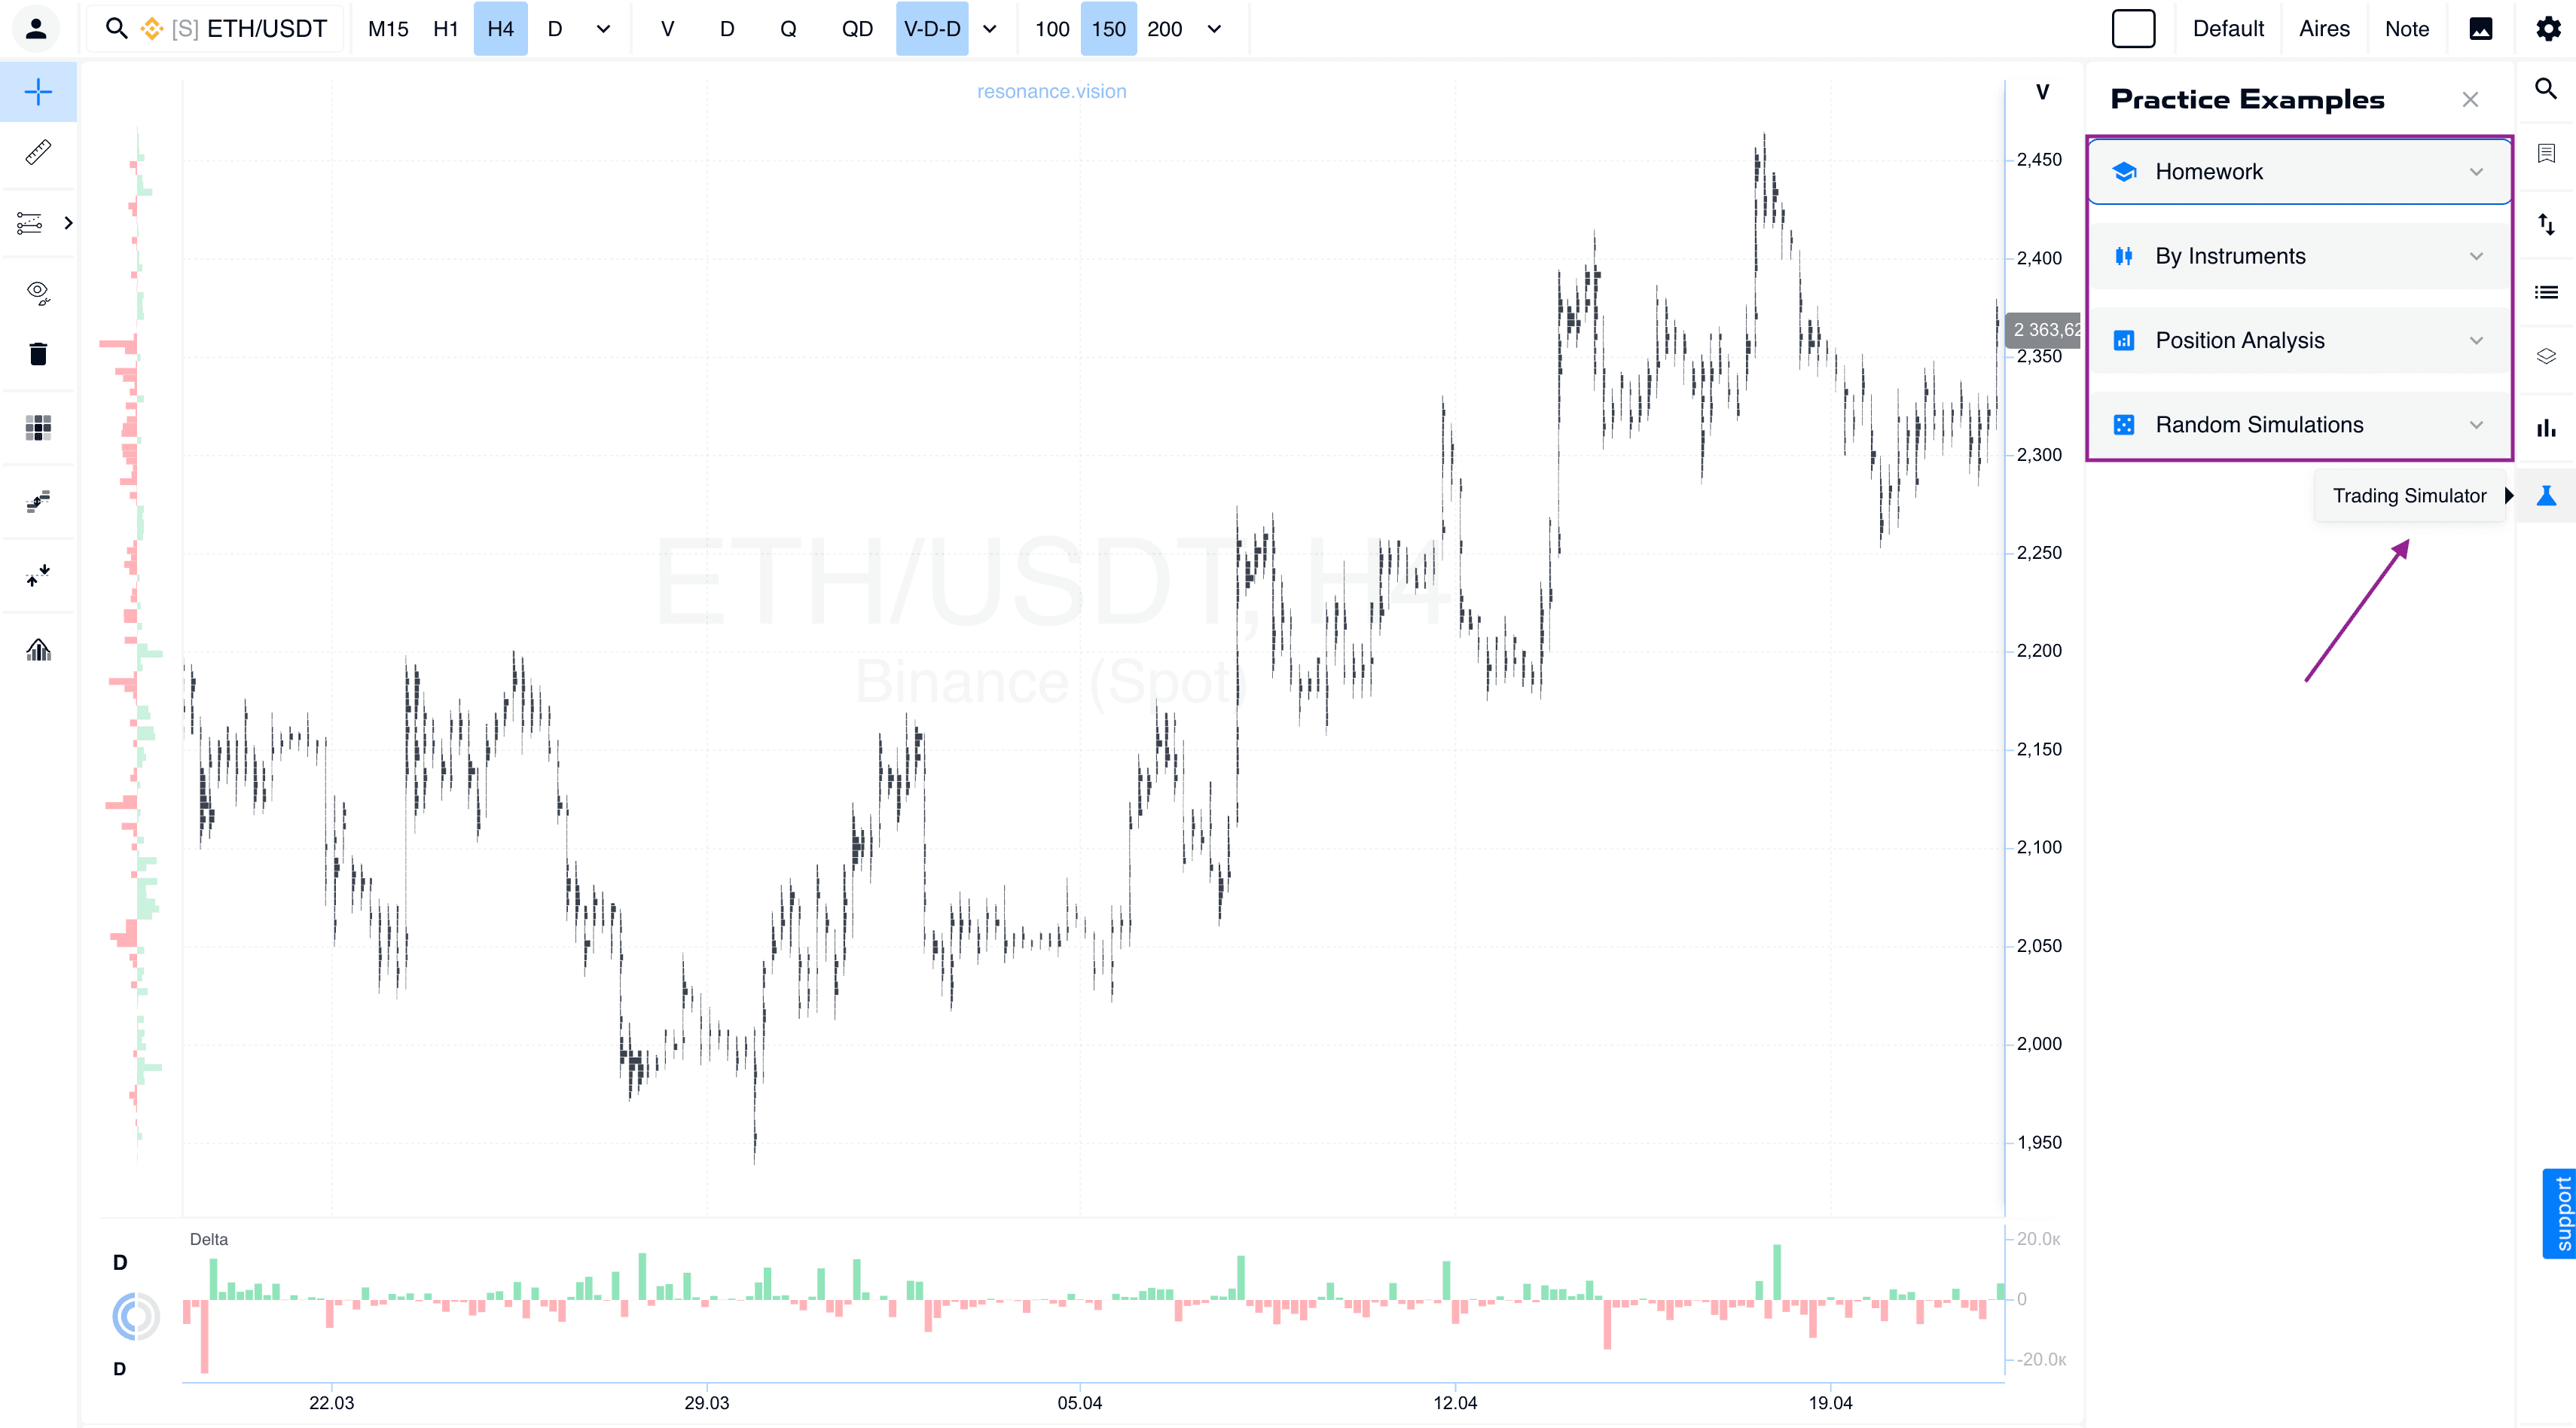
#4 Trading Simulator
We have added a simulator for practicing trading skills without risking your deposit:
- Homework: a system for tracking your progress in the mini-training.
- Tool-based practice: individual simulations focused on specific analytical tools. This feature is currently being refined.
- Position review: detailed analysis of completed trades. This feature is in the final stage of development.
- Random simulation: a random mode that allows you to open trades on random historical segments and test the objectivity of your strategy.
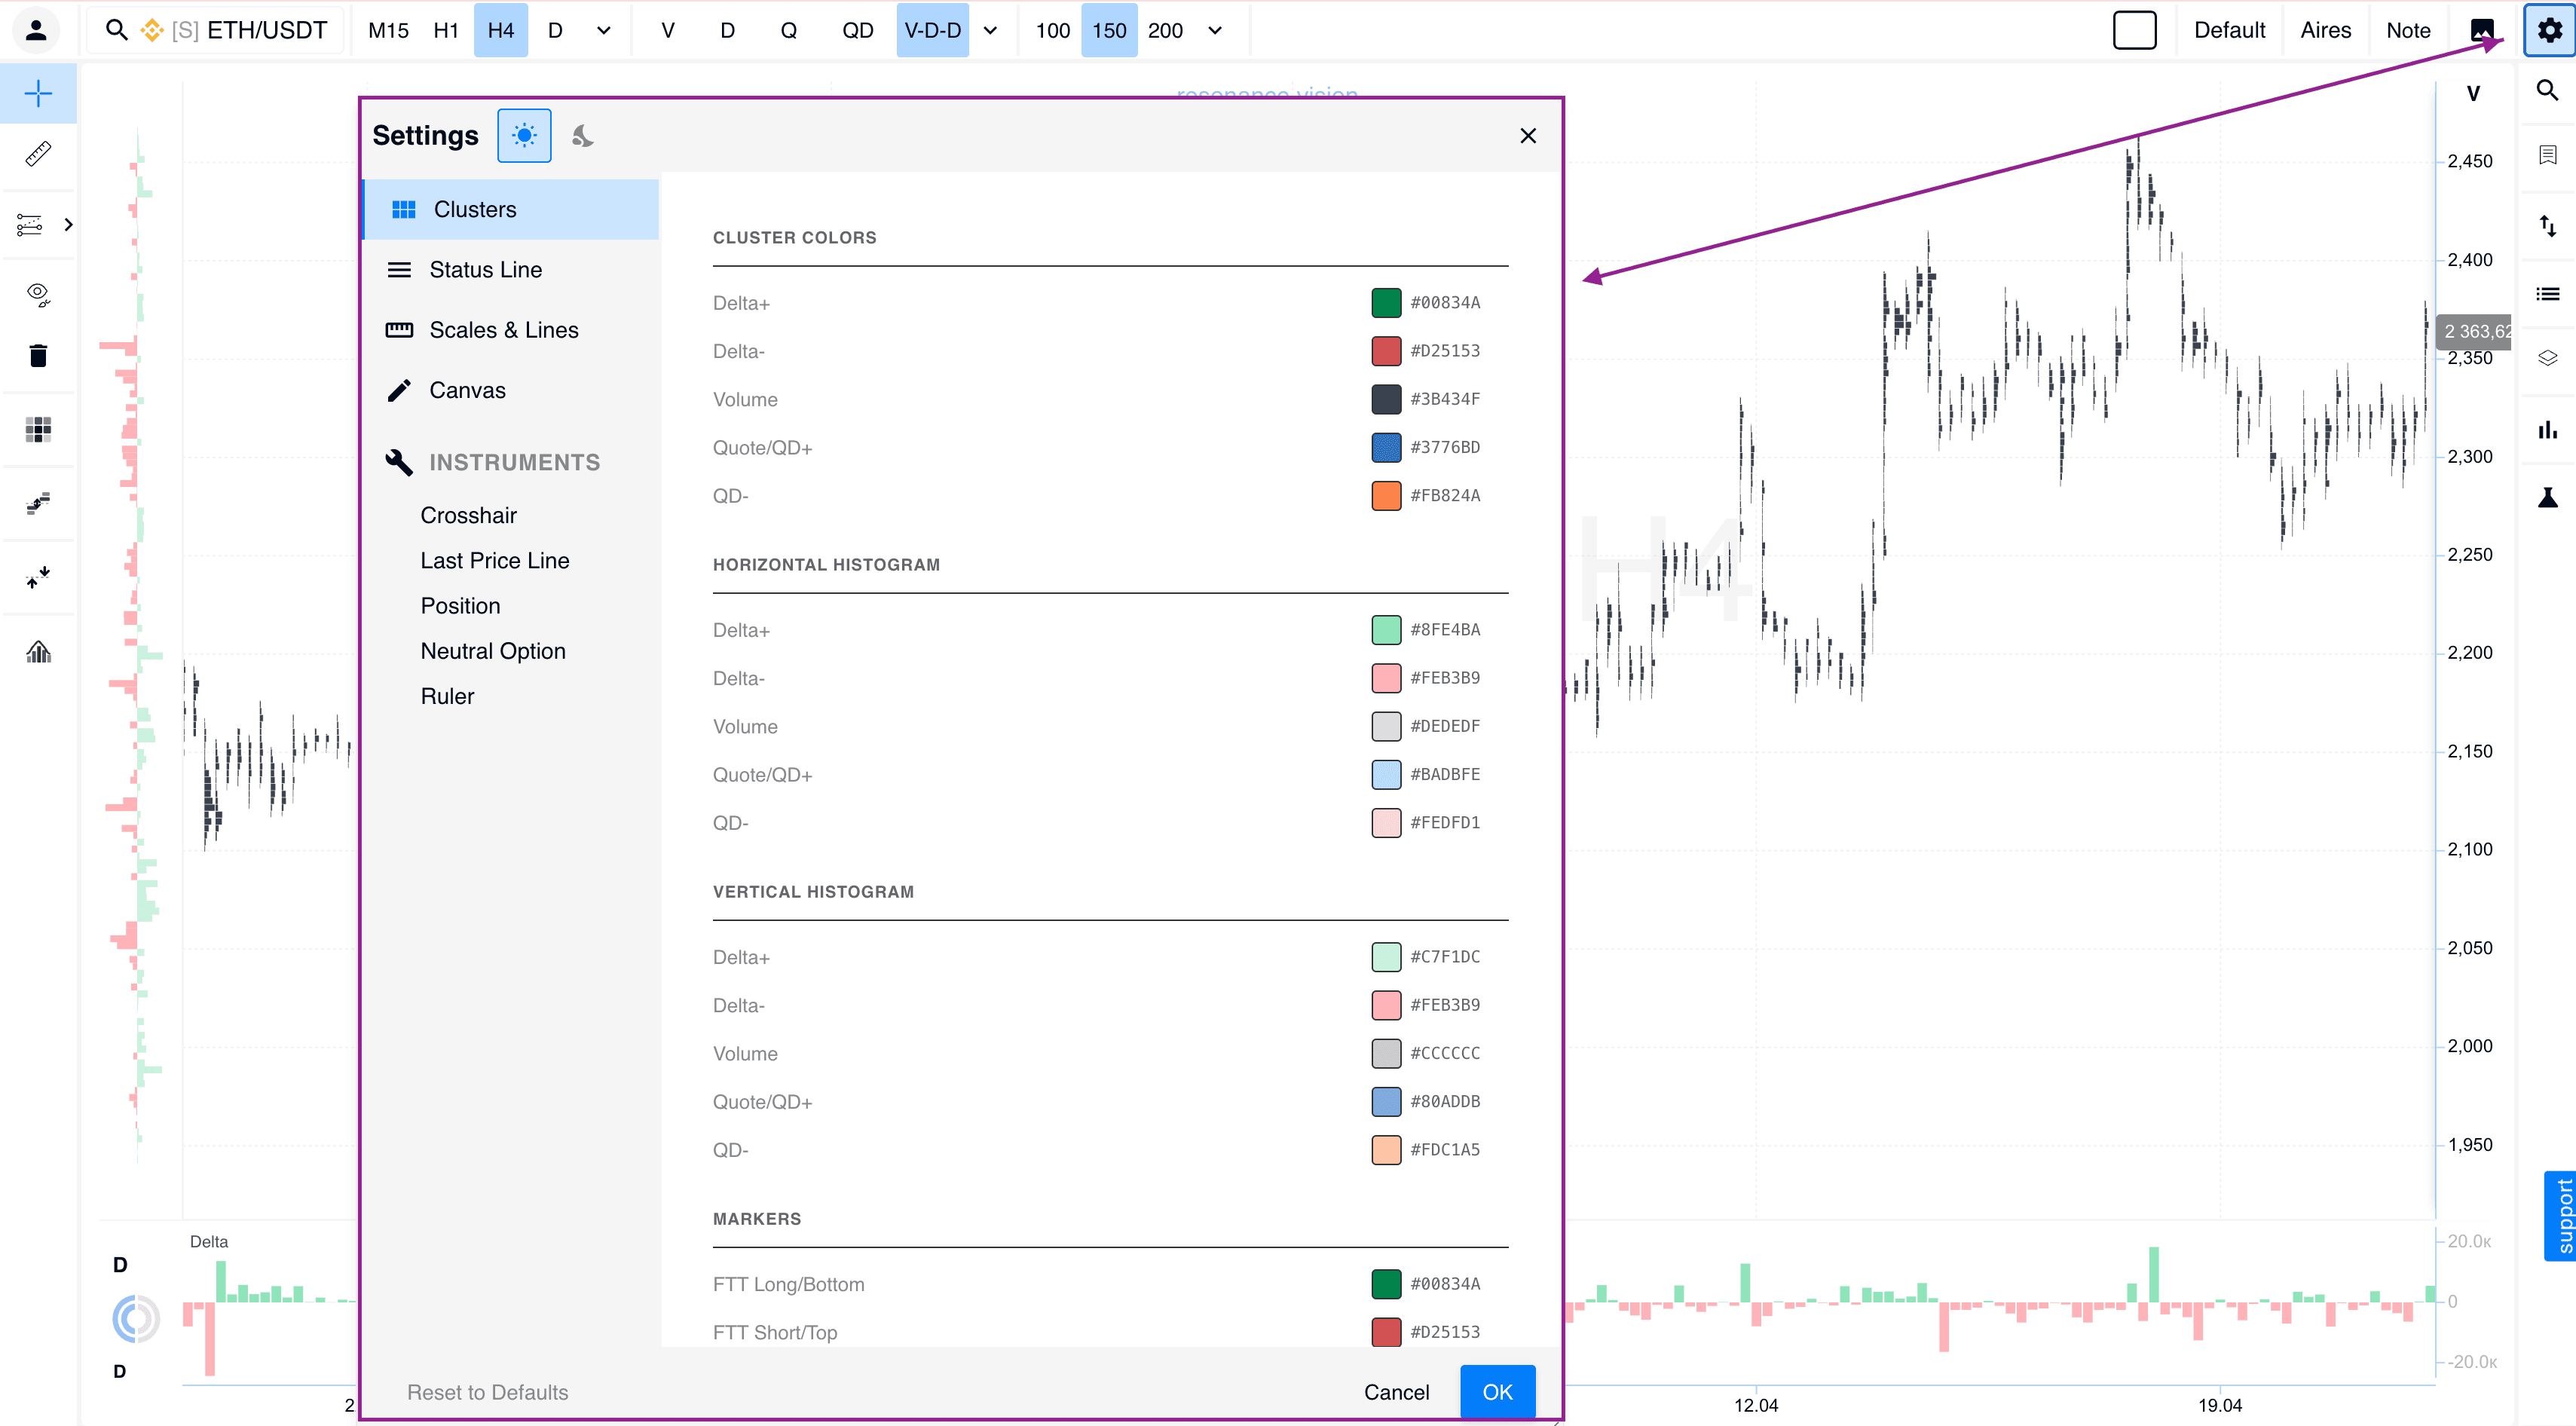
#5 Display Settings Menu
We have introduced a full customization menu. You can now adjust the appearance of any tool to match your personal preferences and visual comfort.
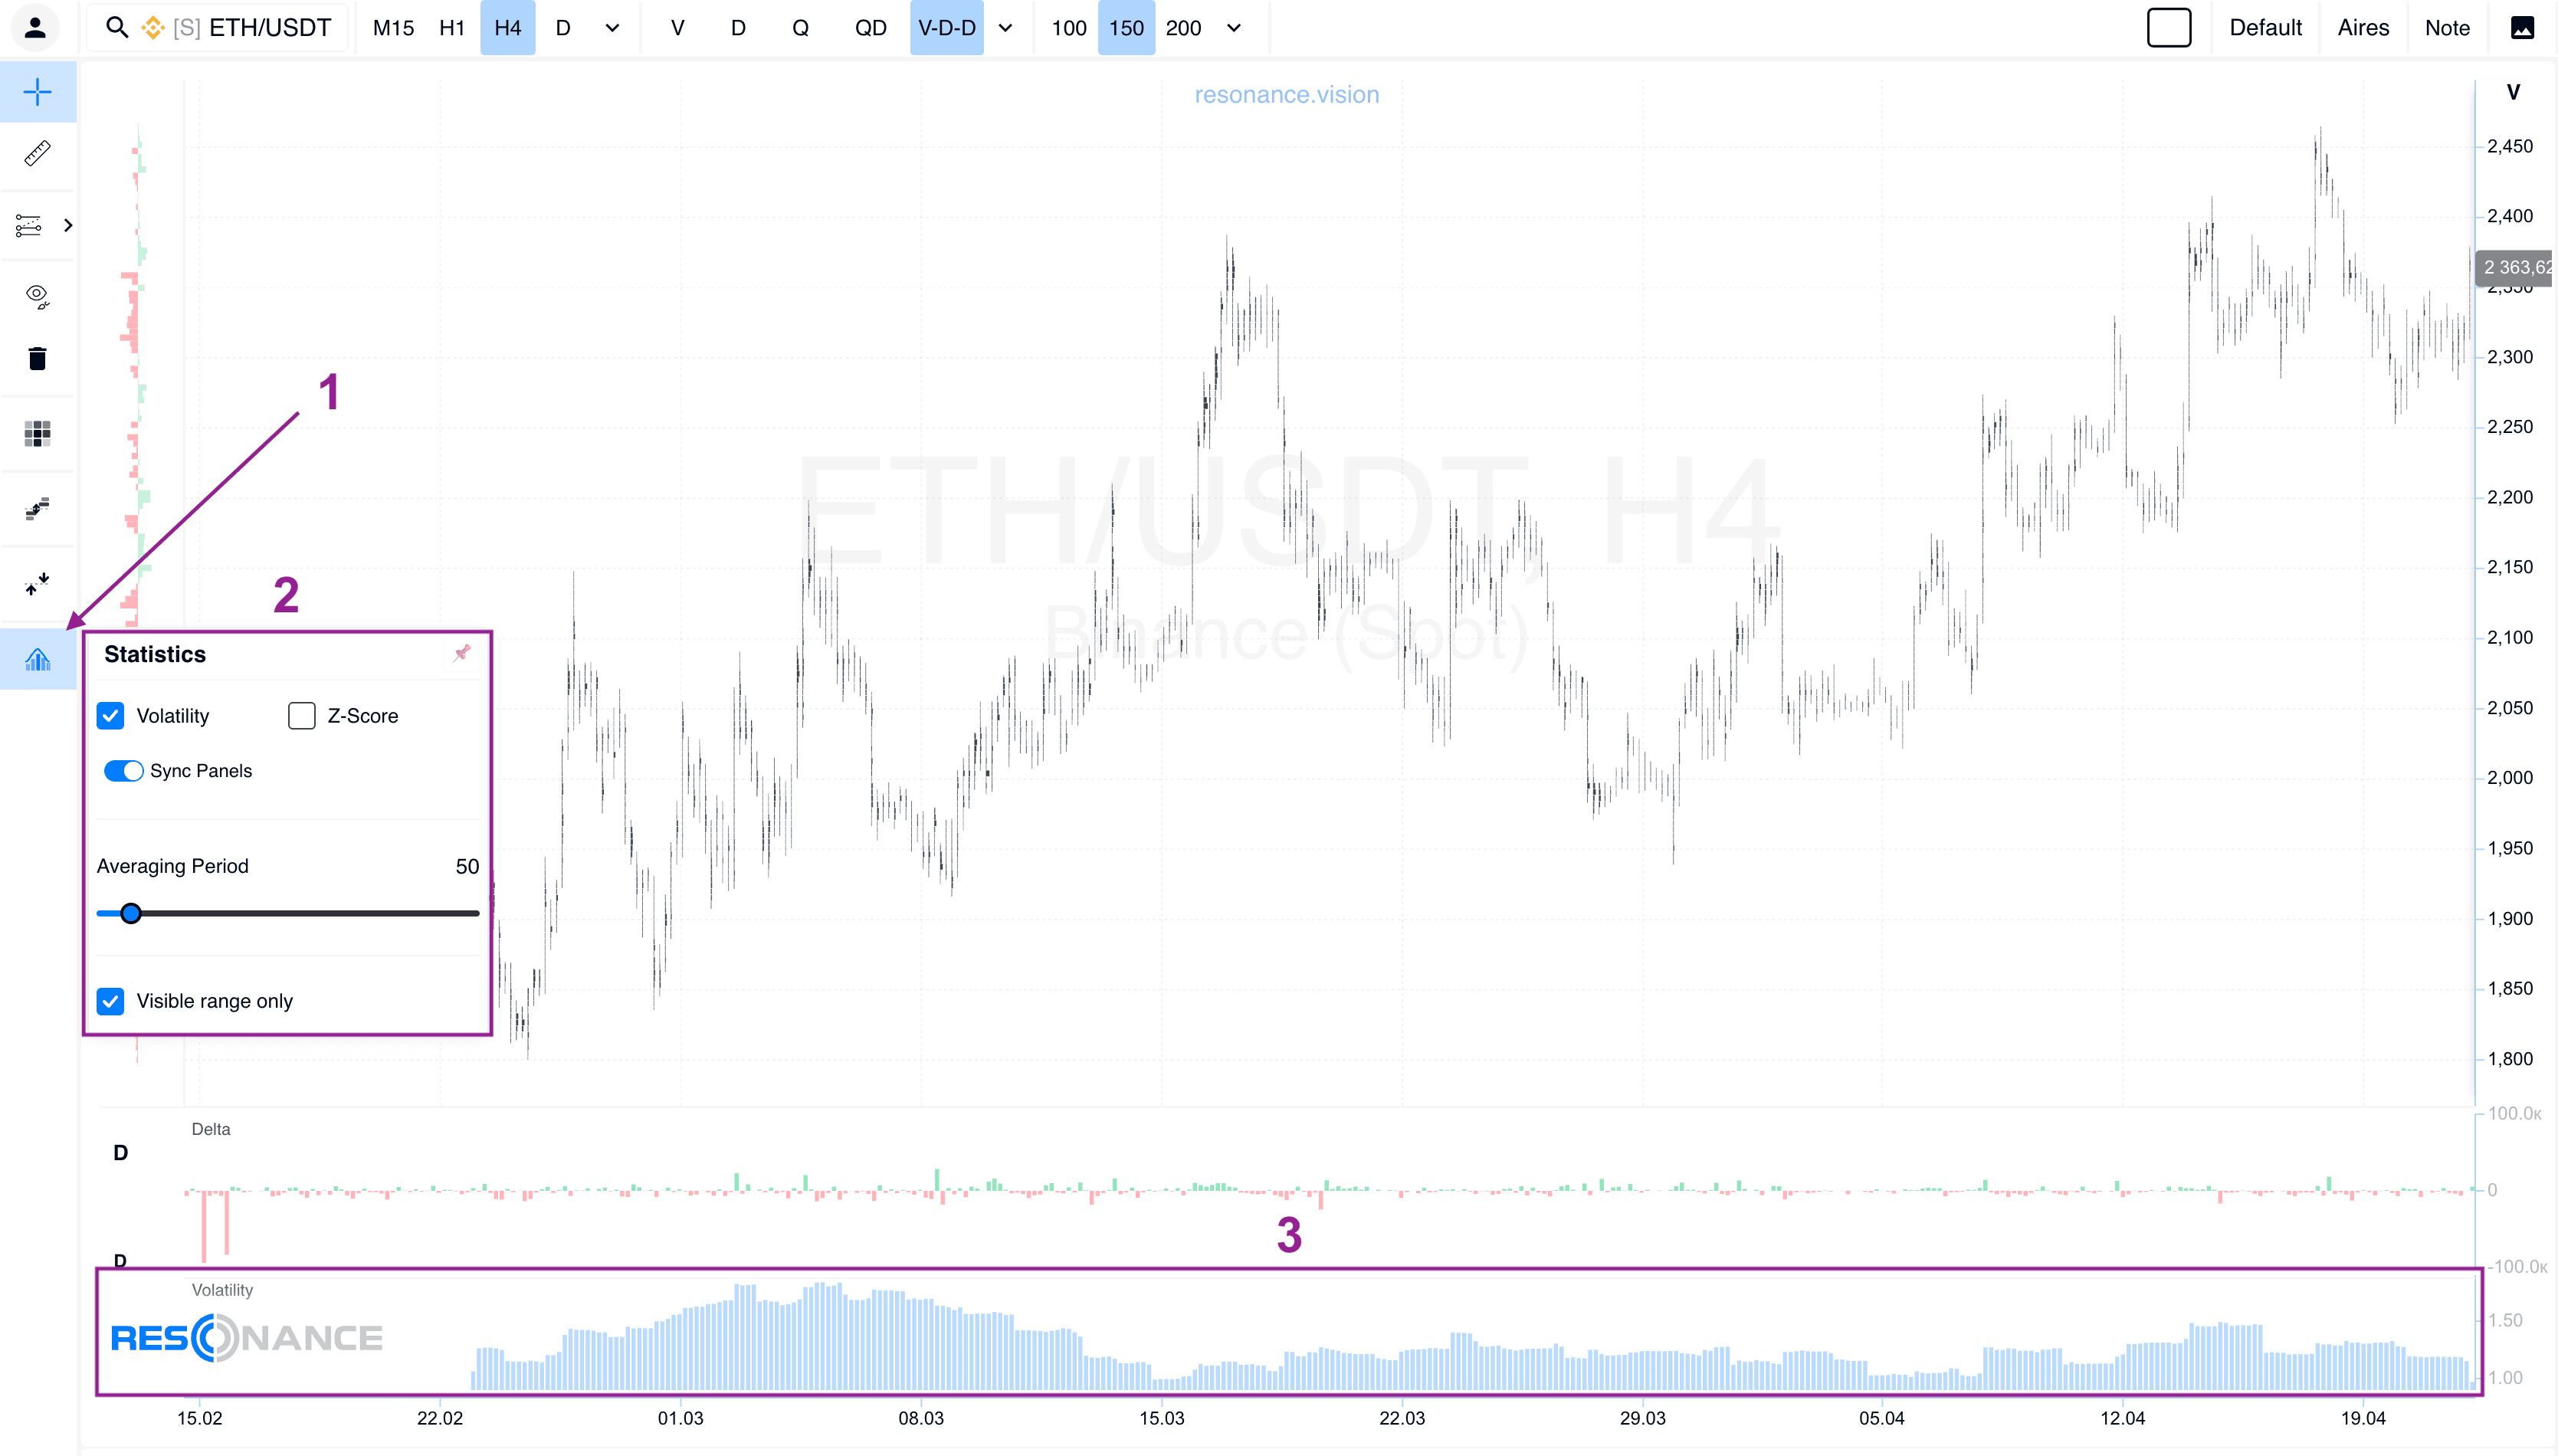
#6 Statistical Tools: Volatility and Z-Score
For more precise analysis, we have moved Volatility and Z-Score indicators into a separate block. They are now displayed as a clear histogram at the bottom of the chart.
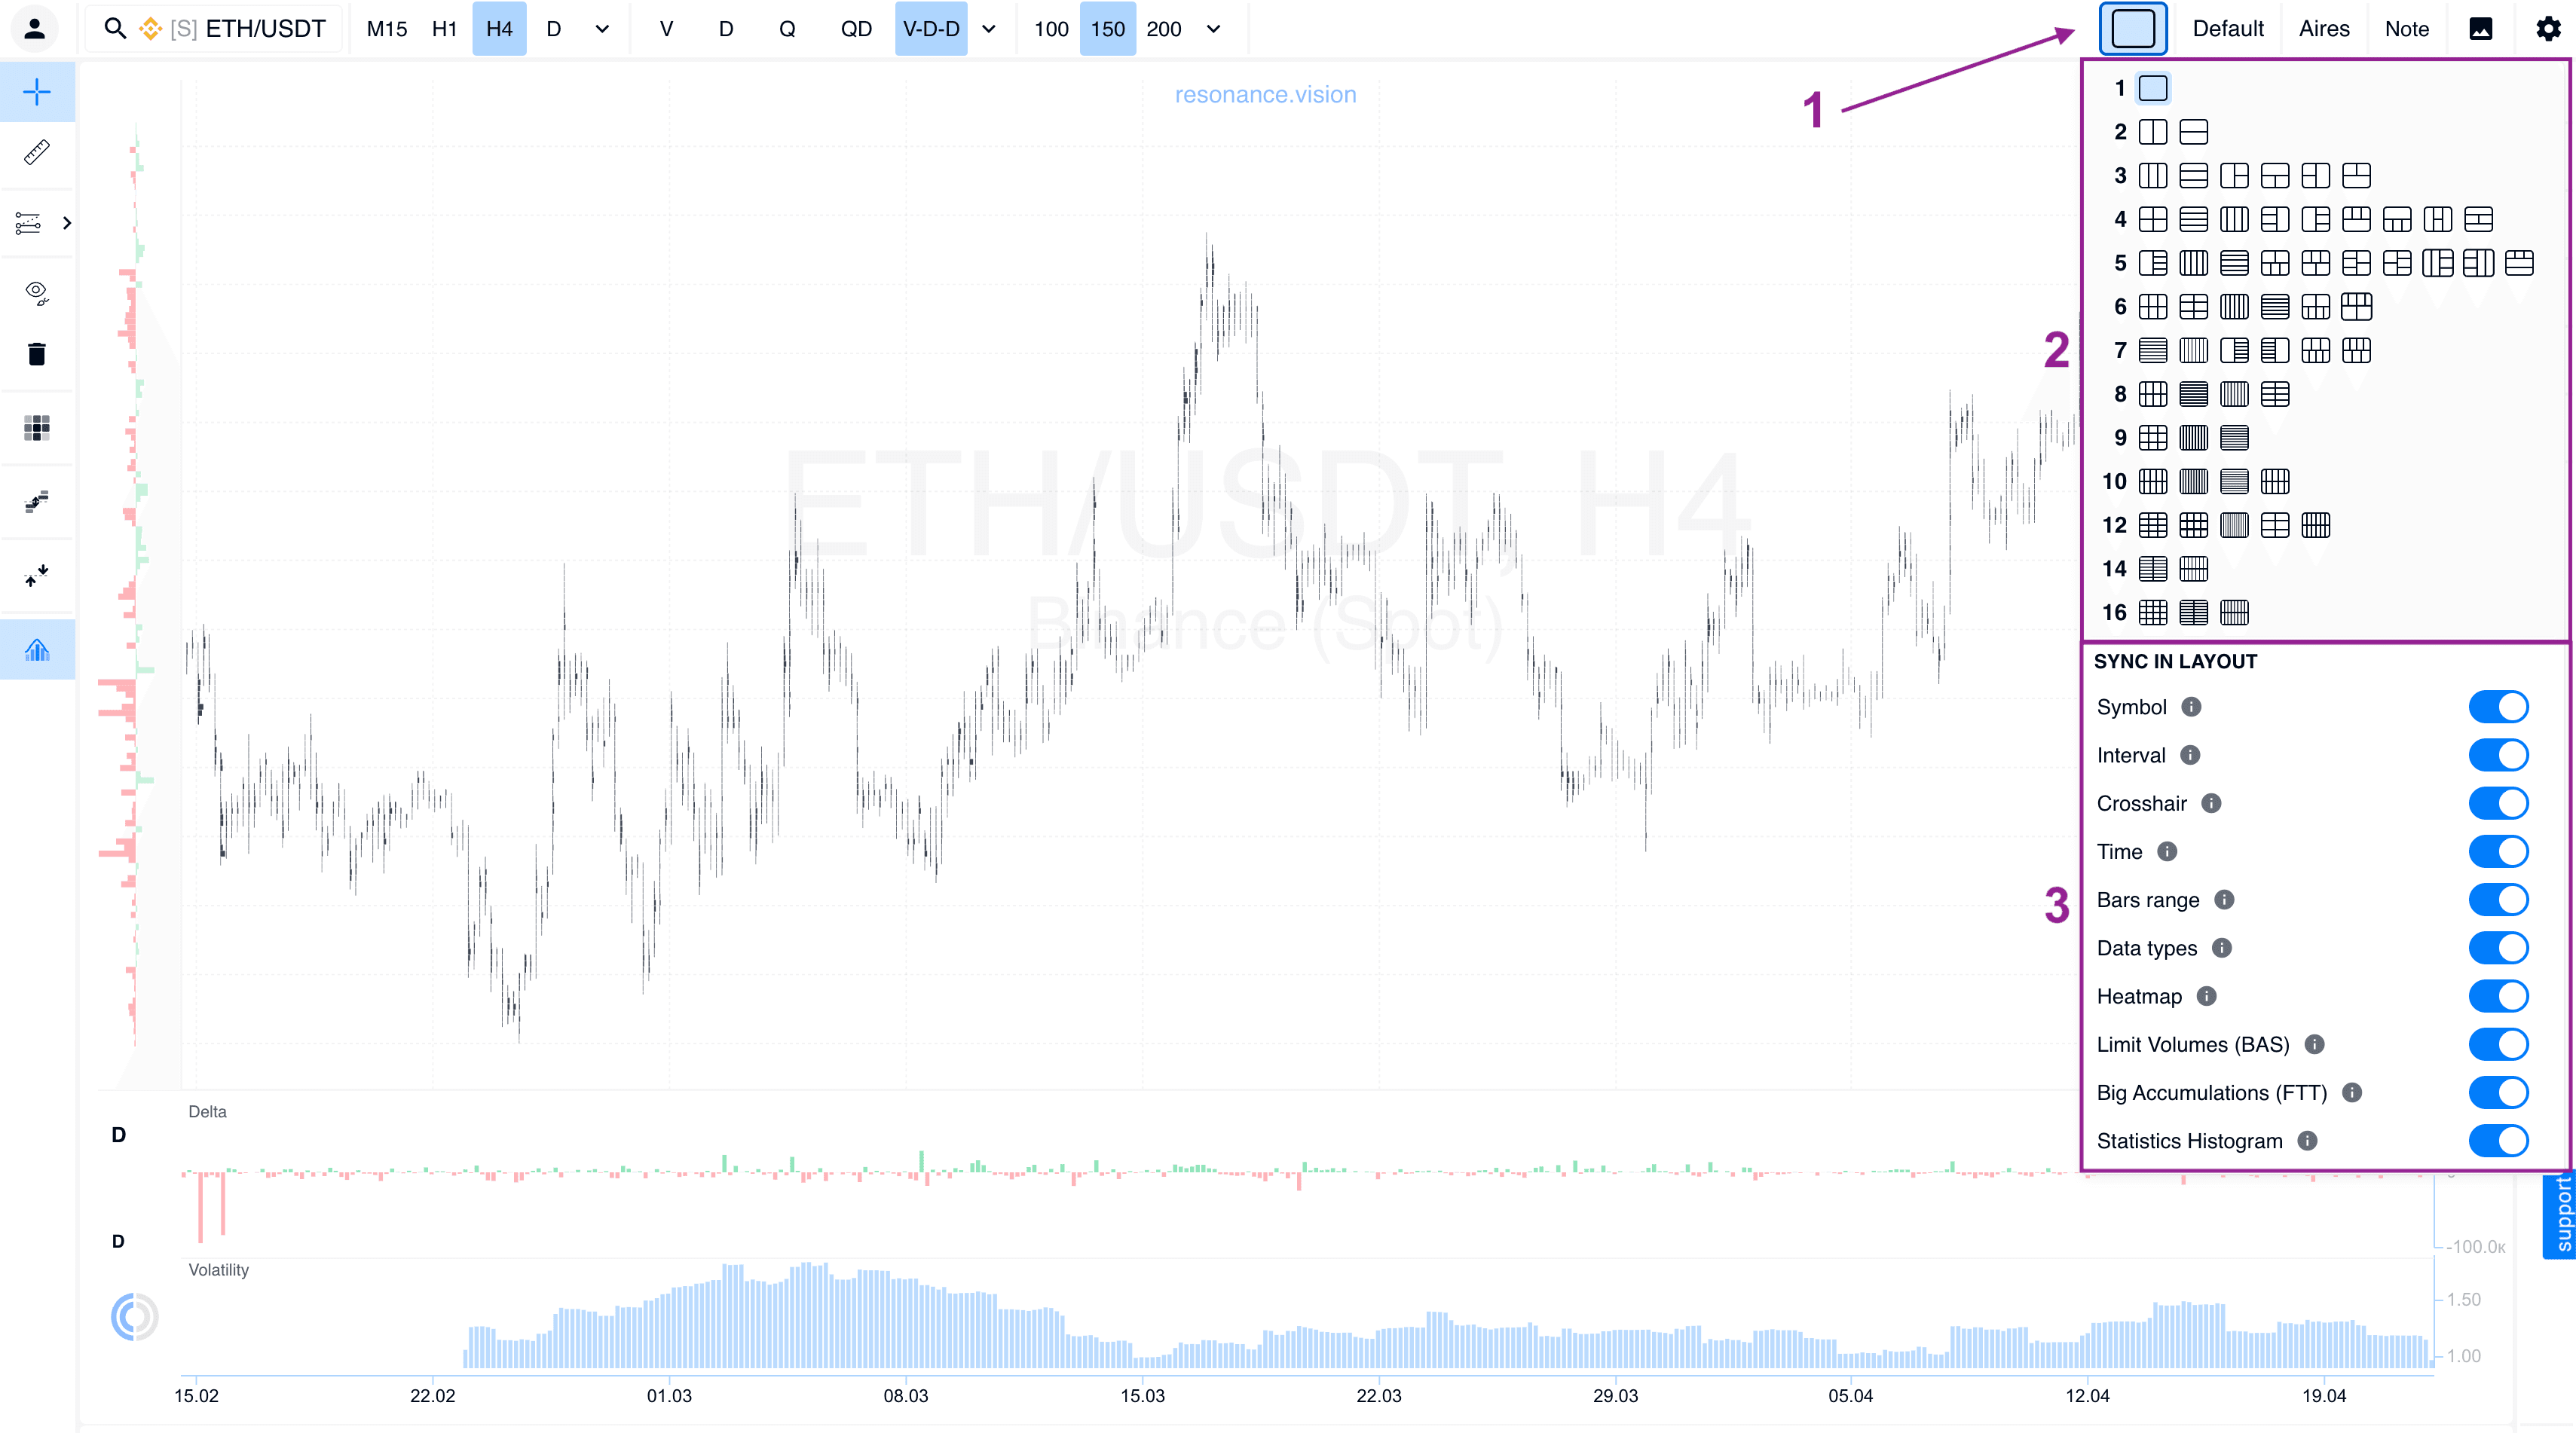
#7 Multi-Window Mode and Synchronization
You can now add multiple cluster chart variations within a single workspace. Each window can be managed individually, and synchronization mode makes it easier to compare assets.
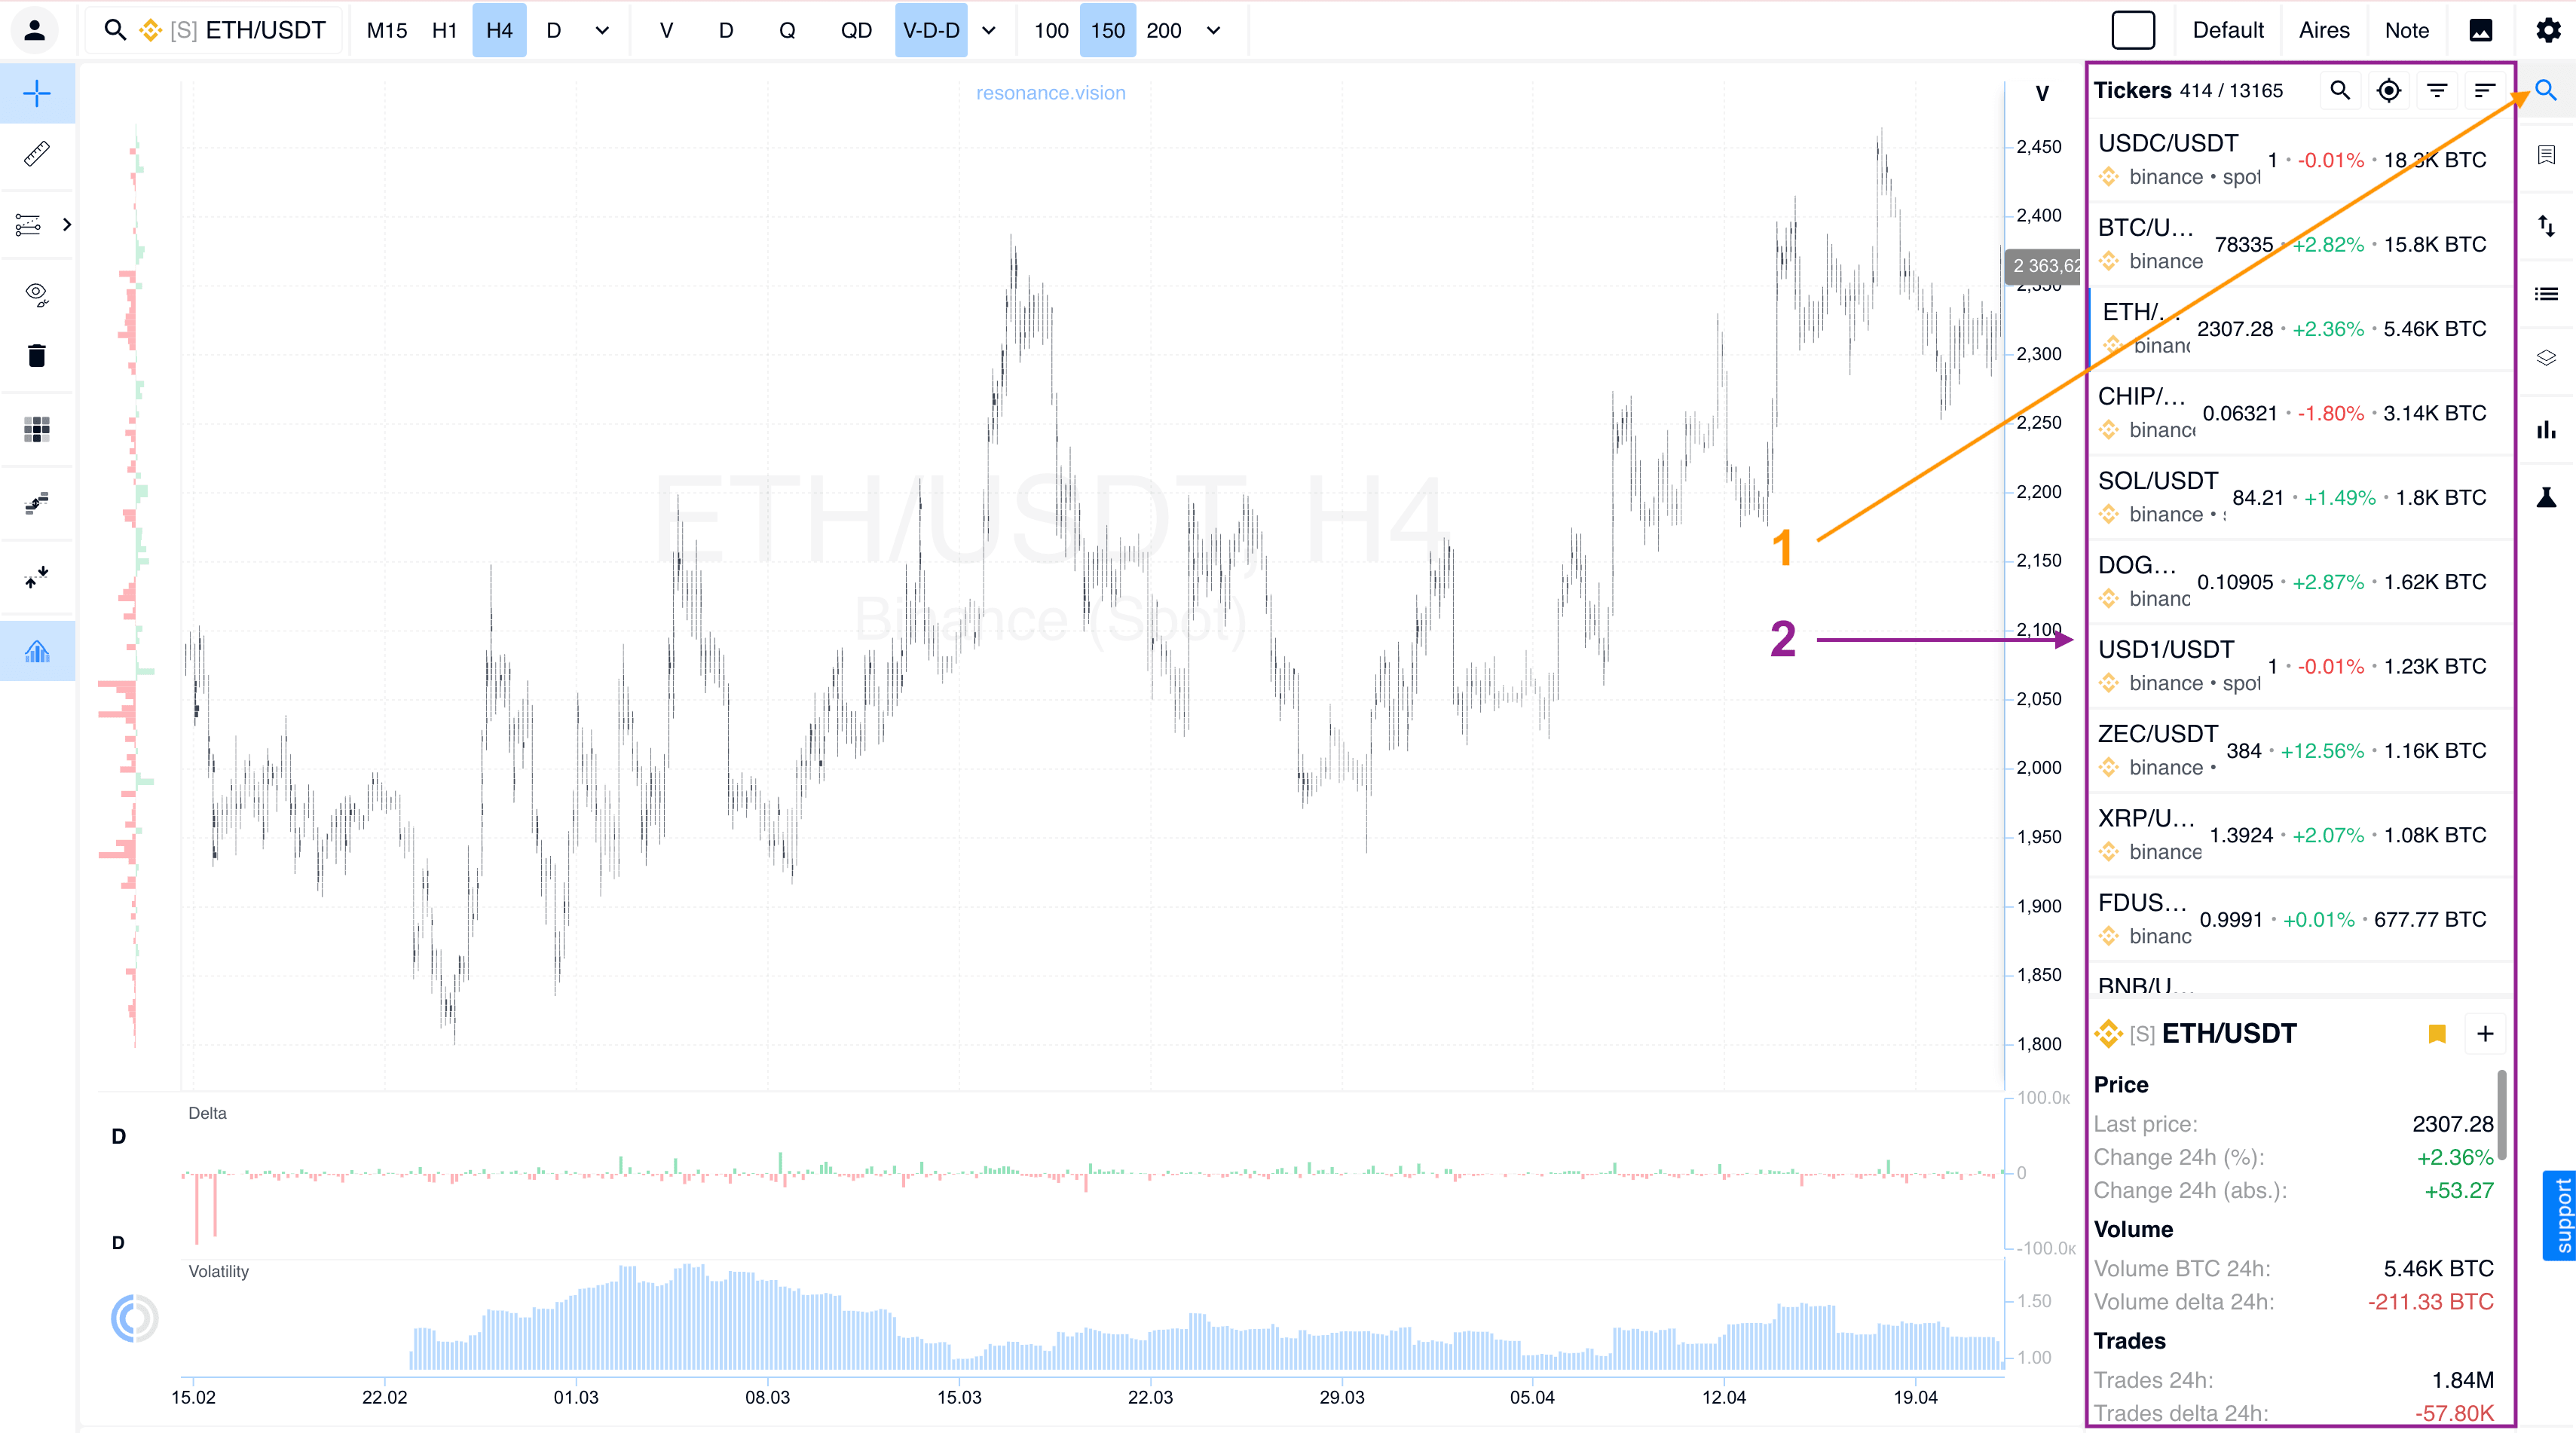
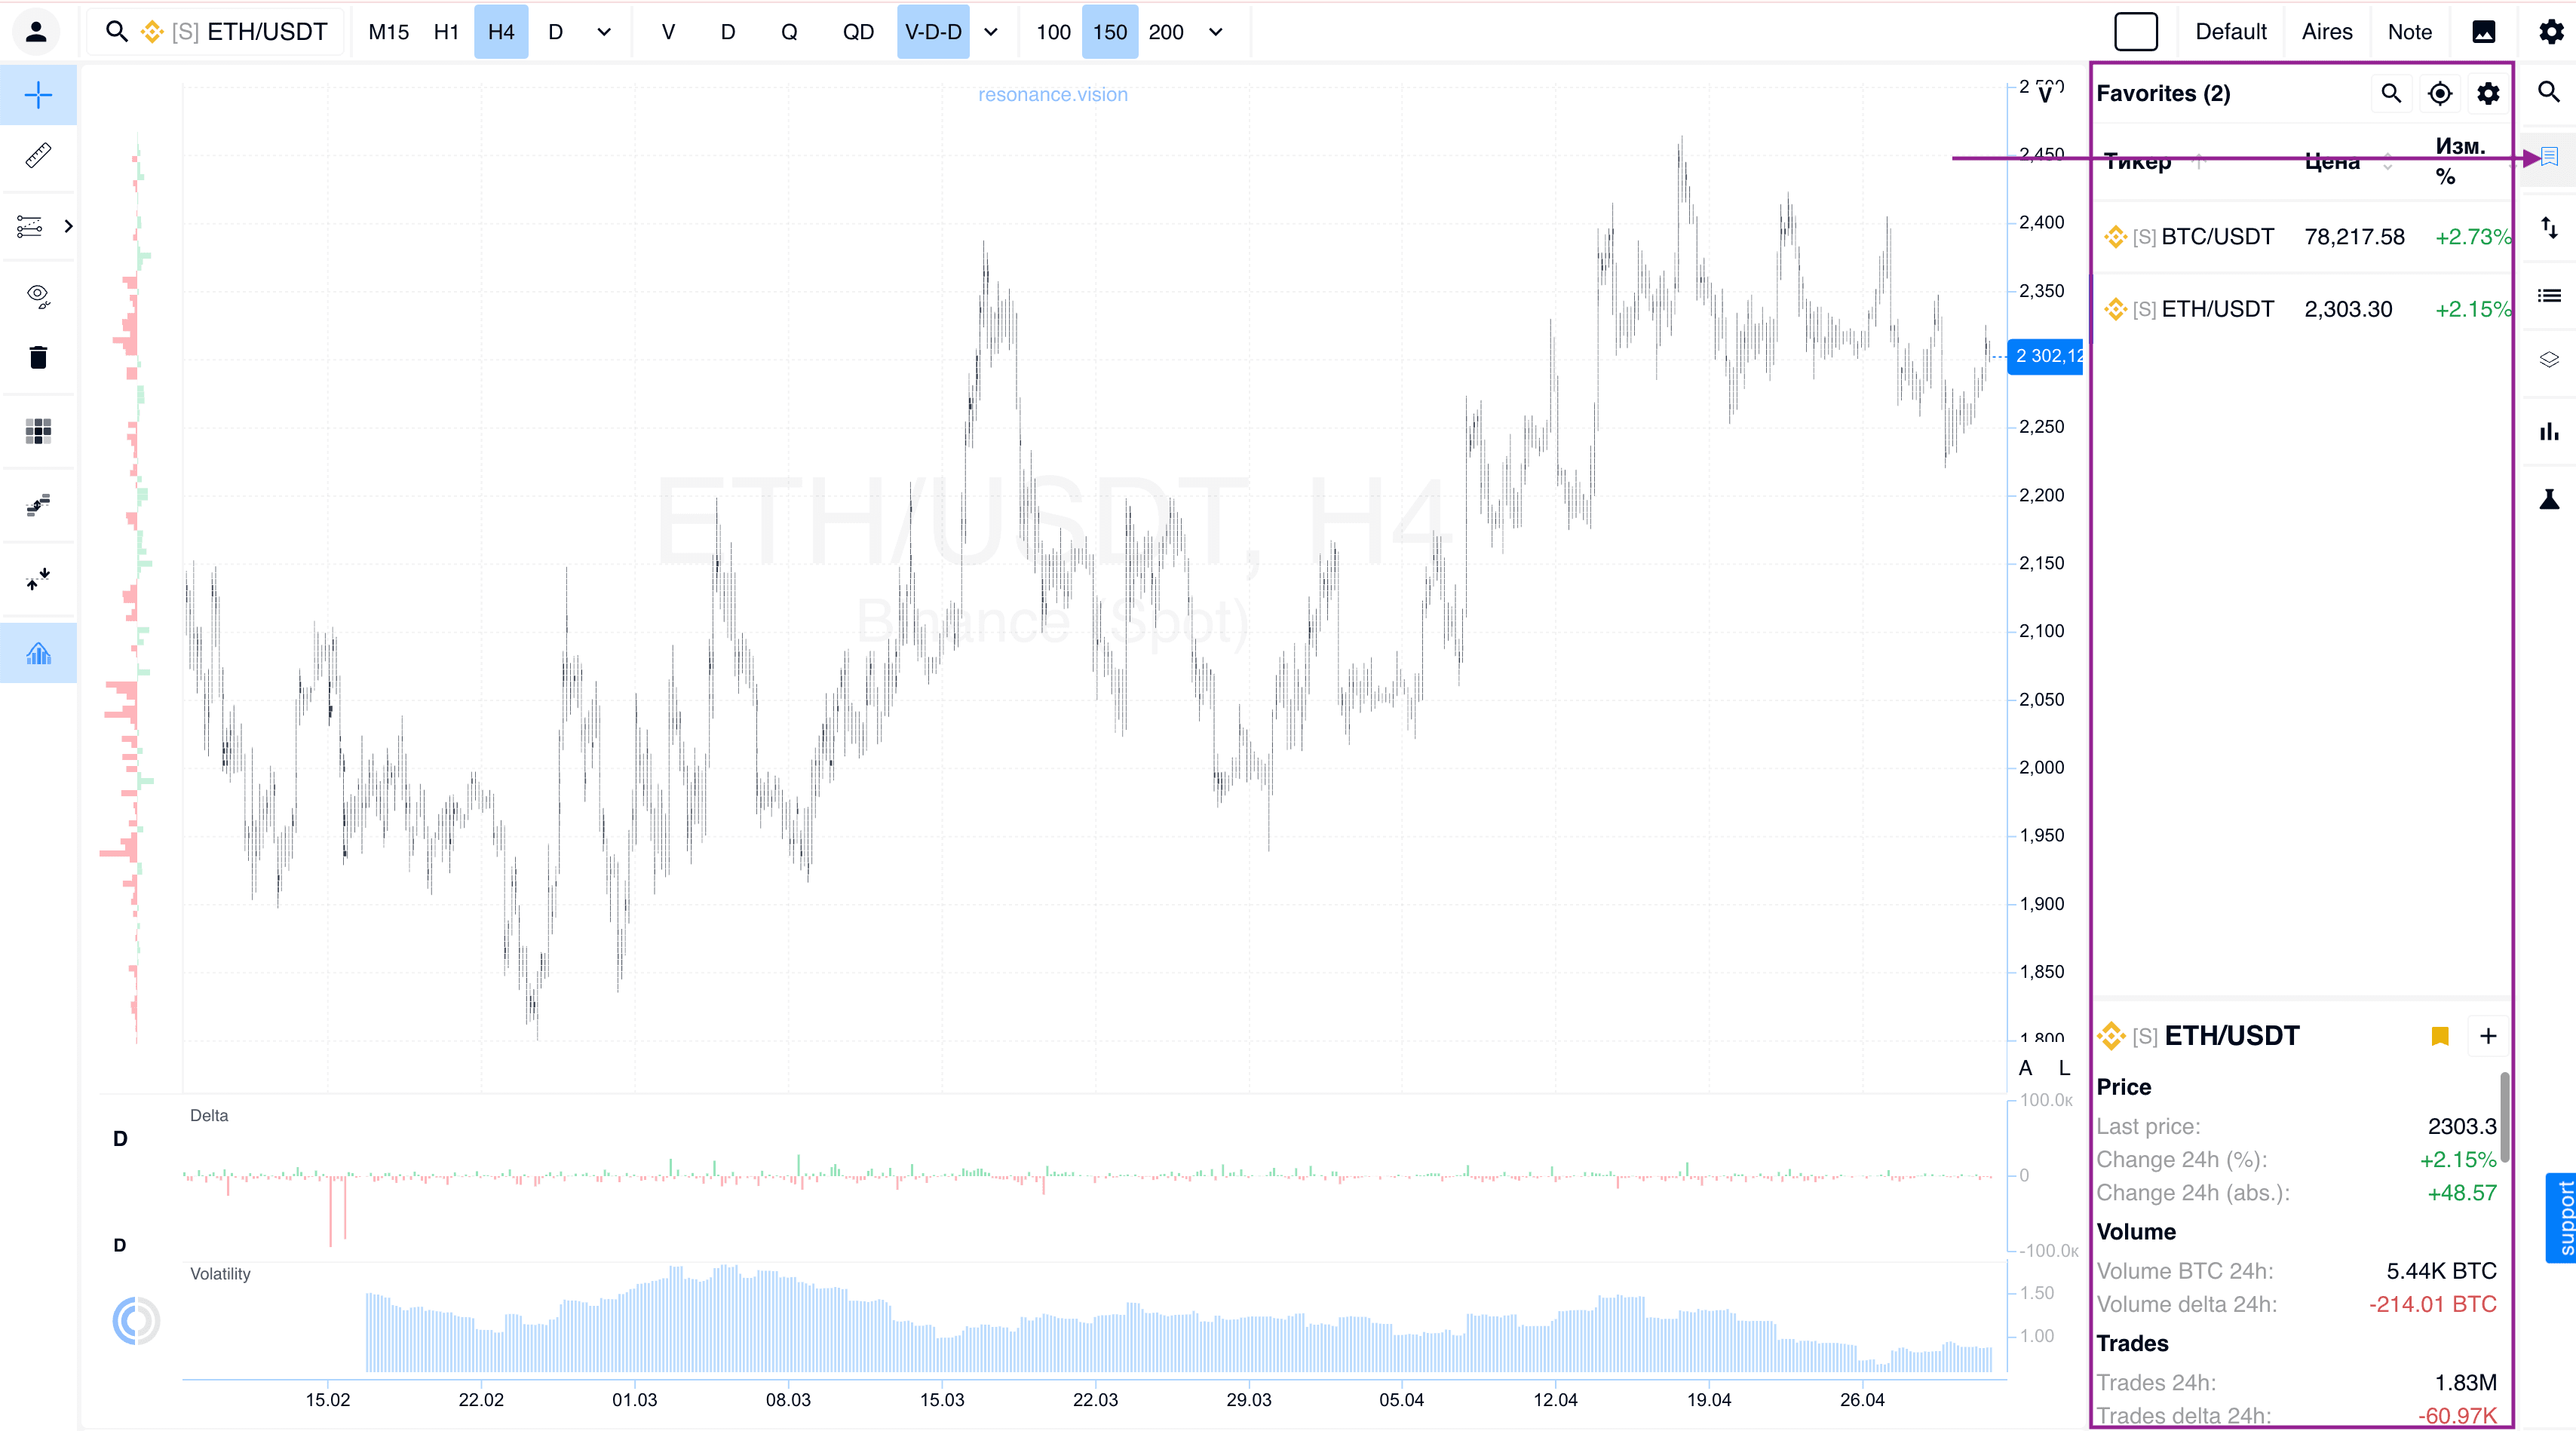
#8 Tickers Window
We have completely updated the ticker information window. It is now a full asset control center: key data for the selected asset is gathered in one place, and the interface allows you to add a ticker to Favorites or create your own Session List for faster workflow.
Optimization and Improvements
Pair Tree and Asset Search
We have fully optimized the search logic and the structure of the pair tree. Navigation through a large list of assets now takes just seconds, and the interface has become much more informative.
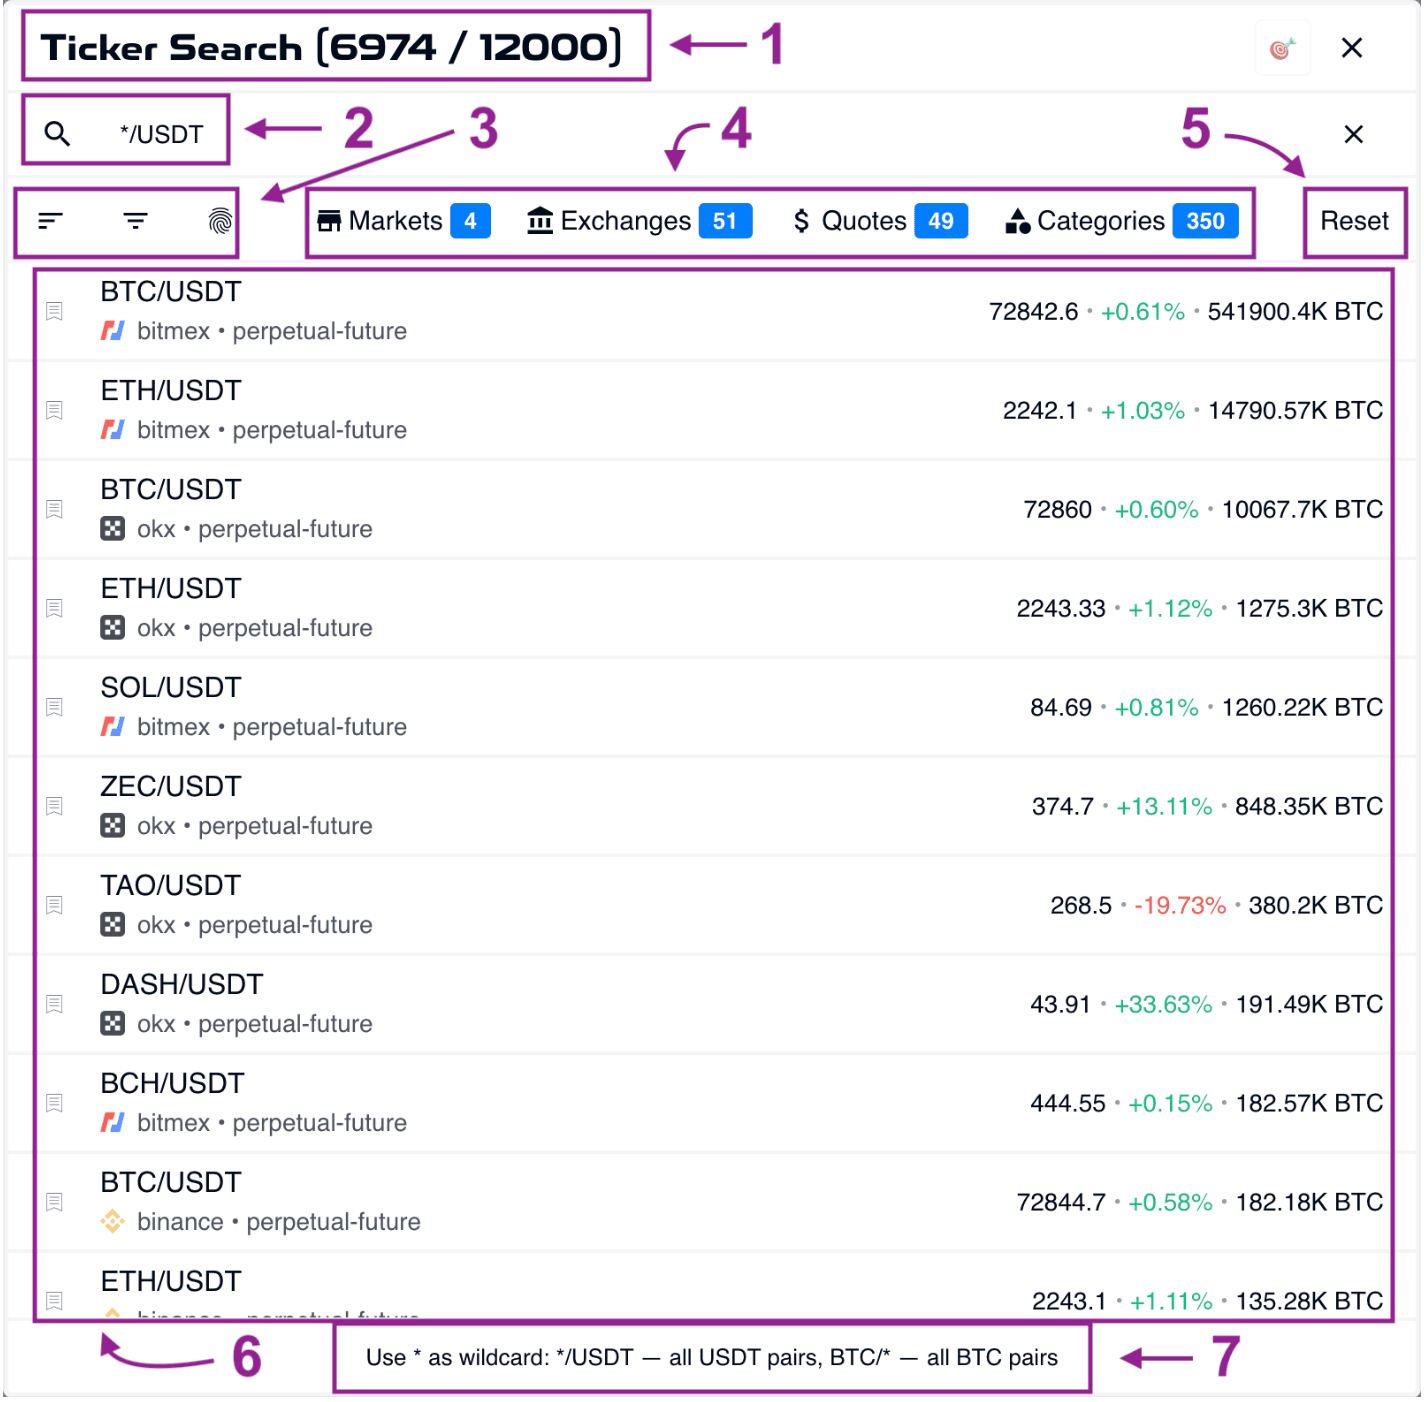
Search Bar and Filtering #1
The top search control panel now includes:
- Input field #2: instant search by ticker or asset name.
- Flexible filtering settings #3: dedicated filters that allow you to quickly sort groups of assets by selected parameters.
- Active filter indicator #4: a separate field that clearly shows which filtering criteria are currently applied to the list.
- Reset settings #5: a quick-clear button that removes all filters and returns you to the full list of pairs.
Pair tree #6: the tree structure itself, allowing you not only to see the list, but also to quickly browse the filtered results.
Hint #7: if you get confused by the active filters, simply check the indicator field. It will always show why this particular list of assets is currently displayed.
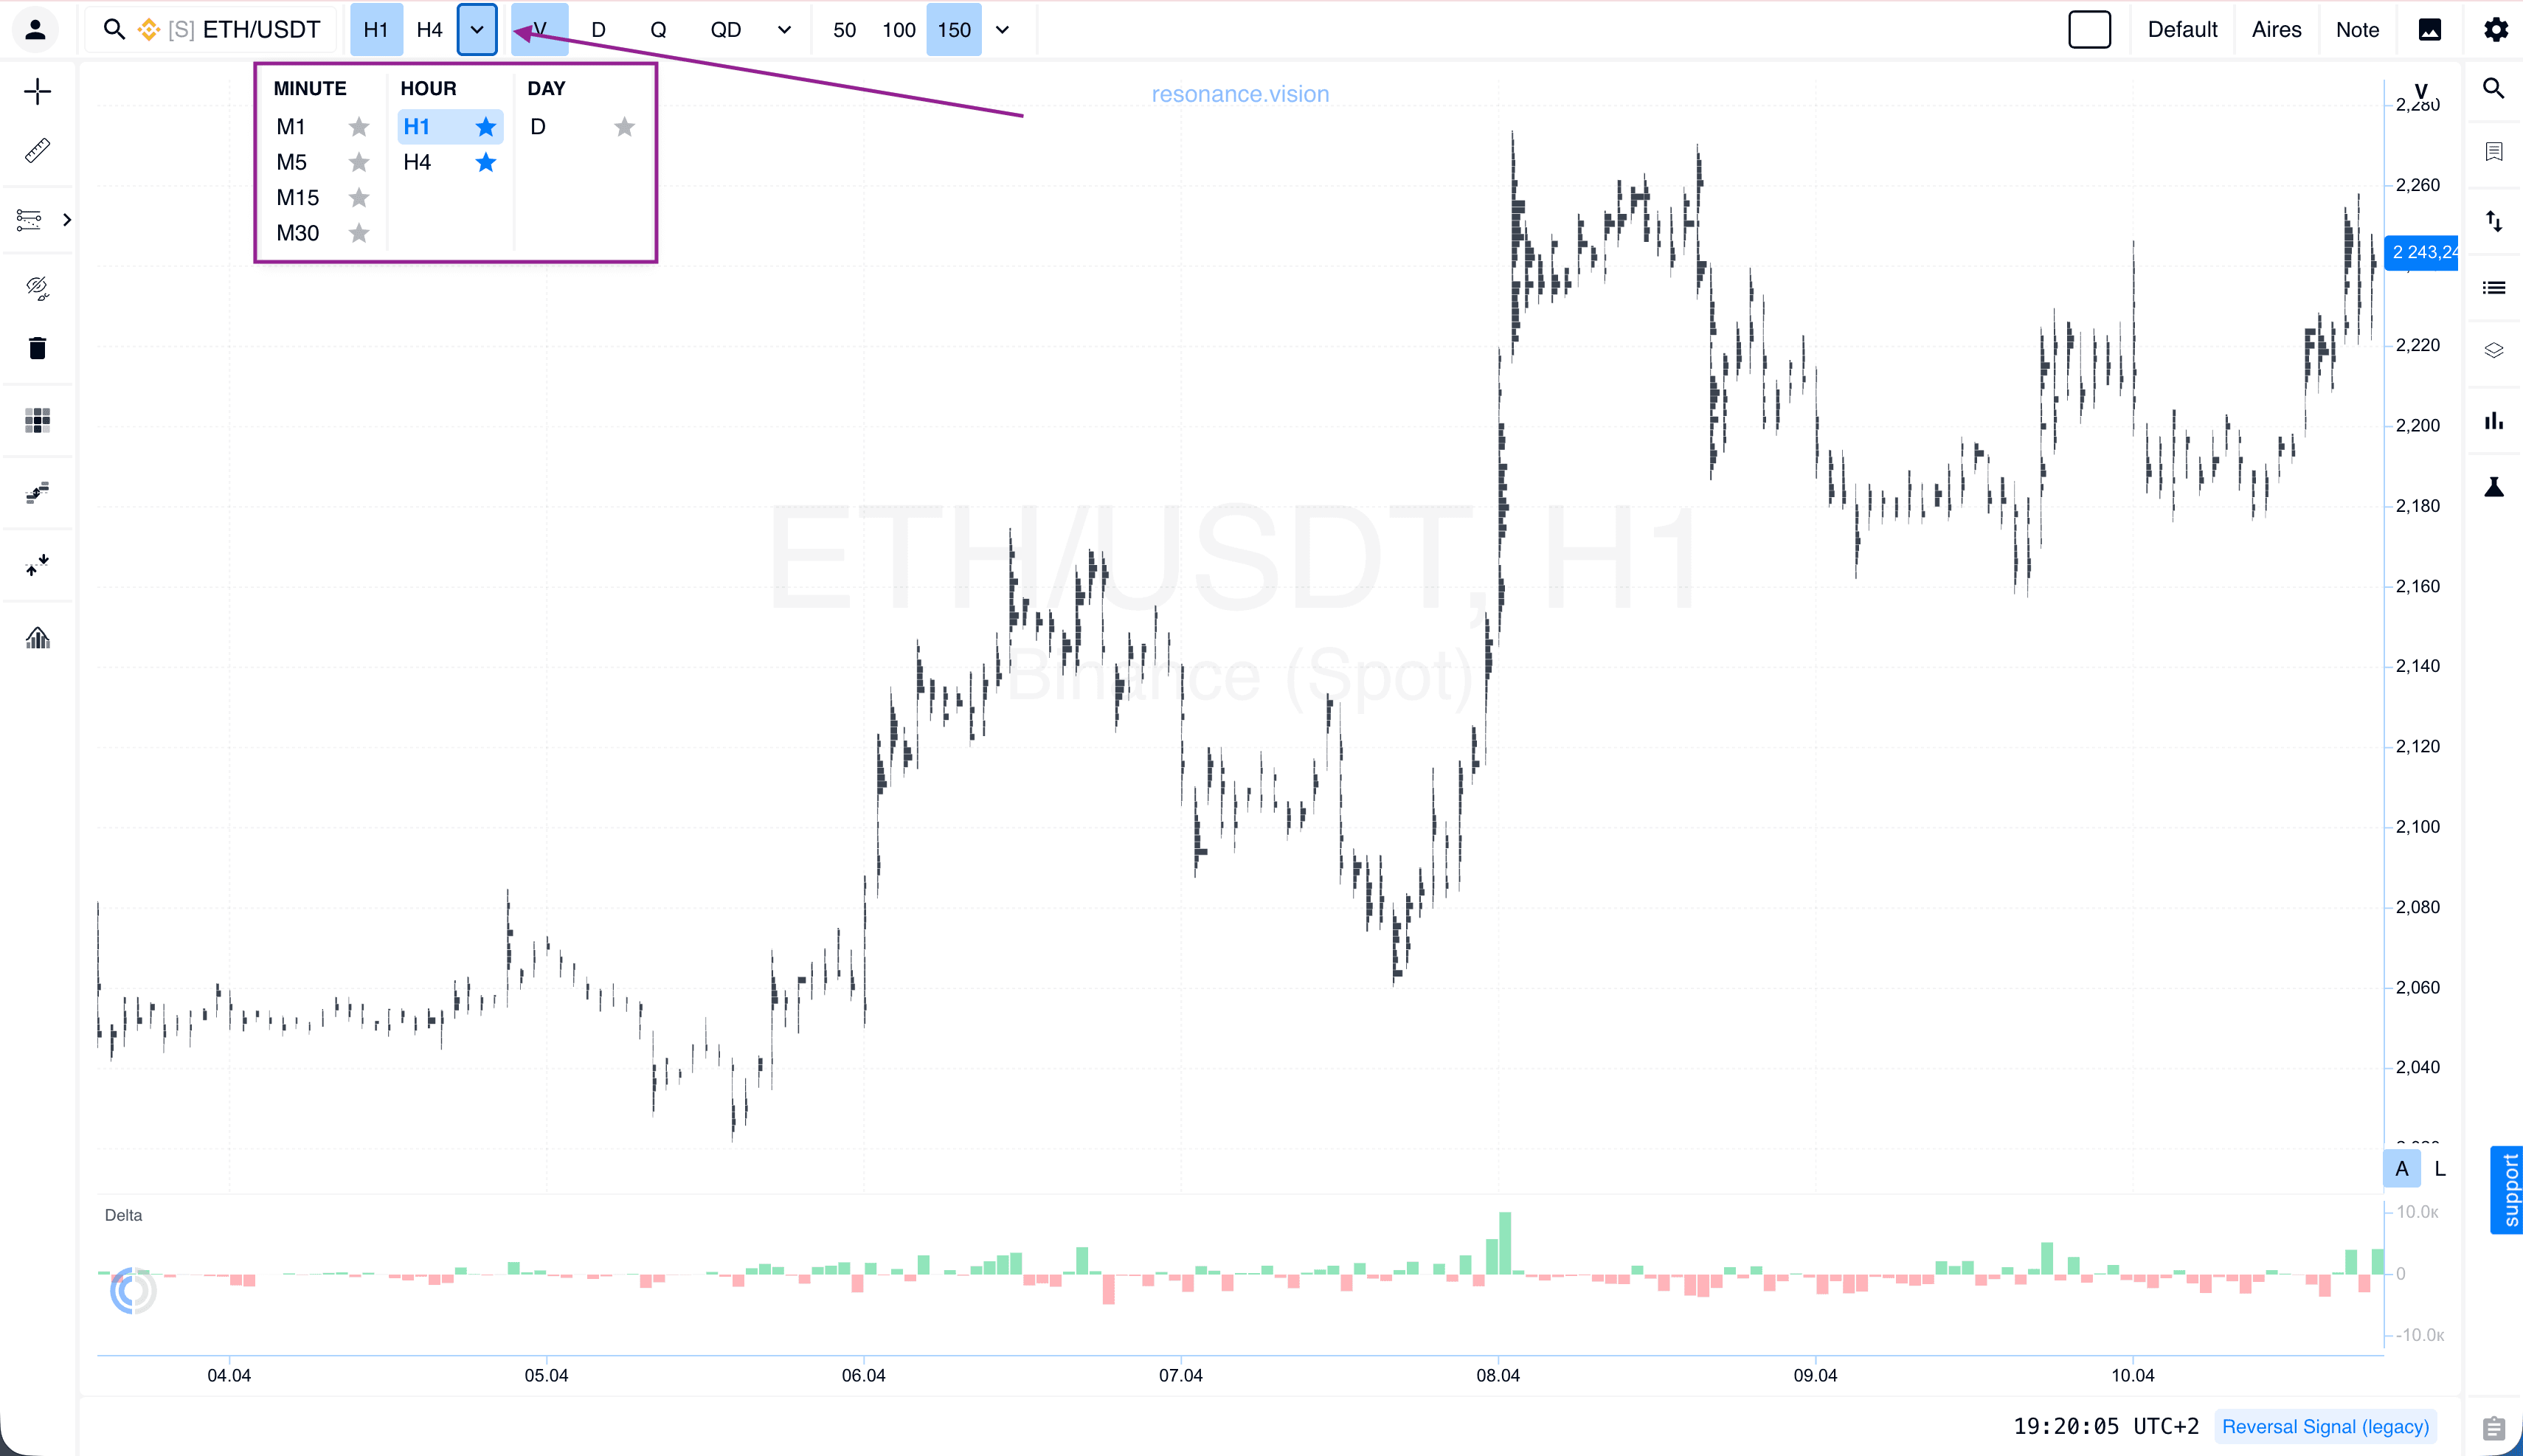
Timeframes
Timeframe blocks are now separated for better readability. We have also added the ability to mark selected timeframes as Favorites. They are pinned to the top panel for quick access.
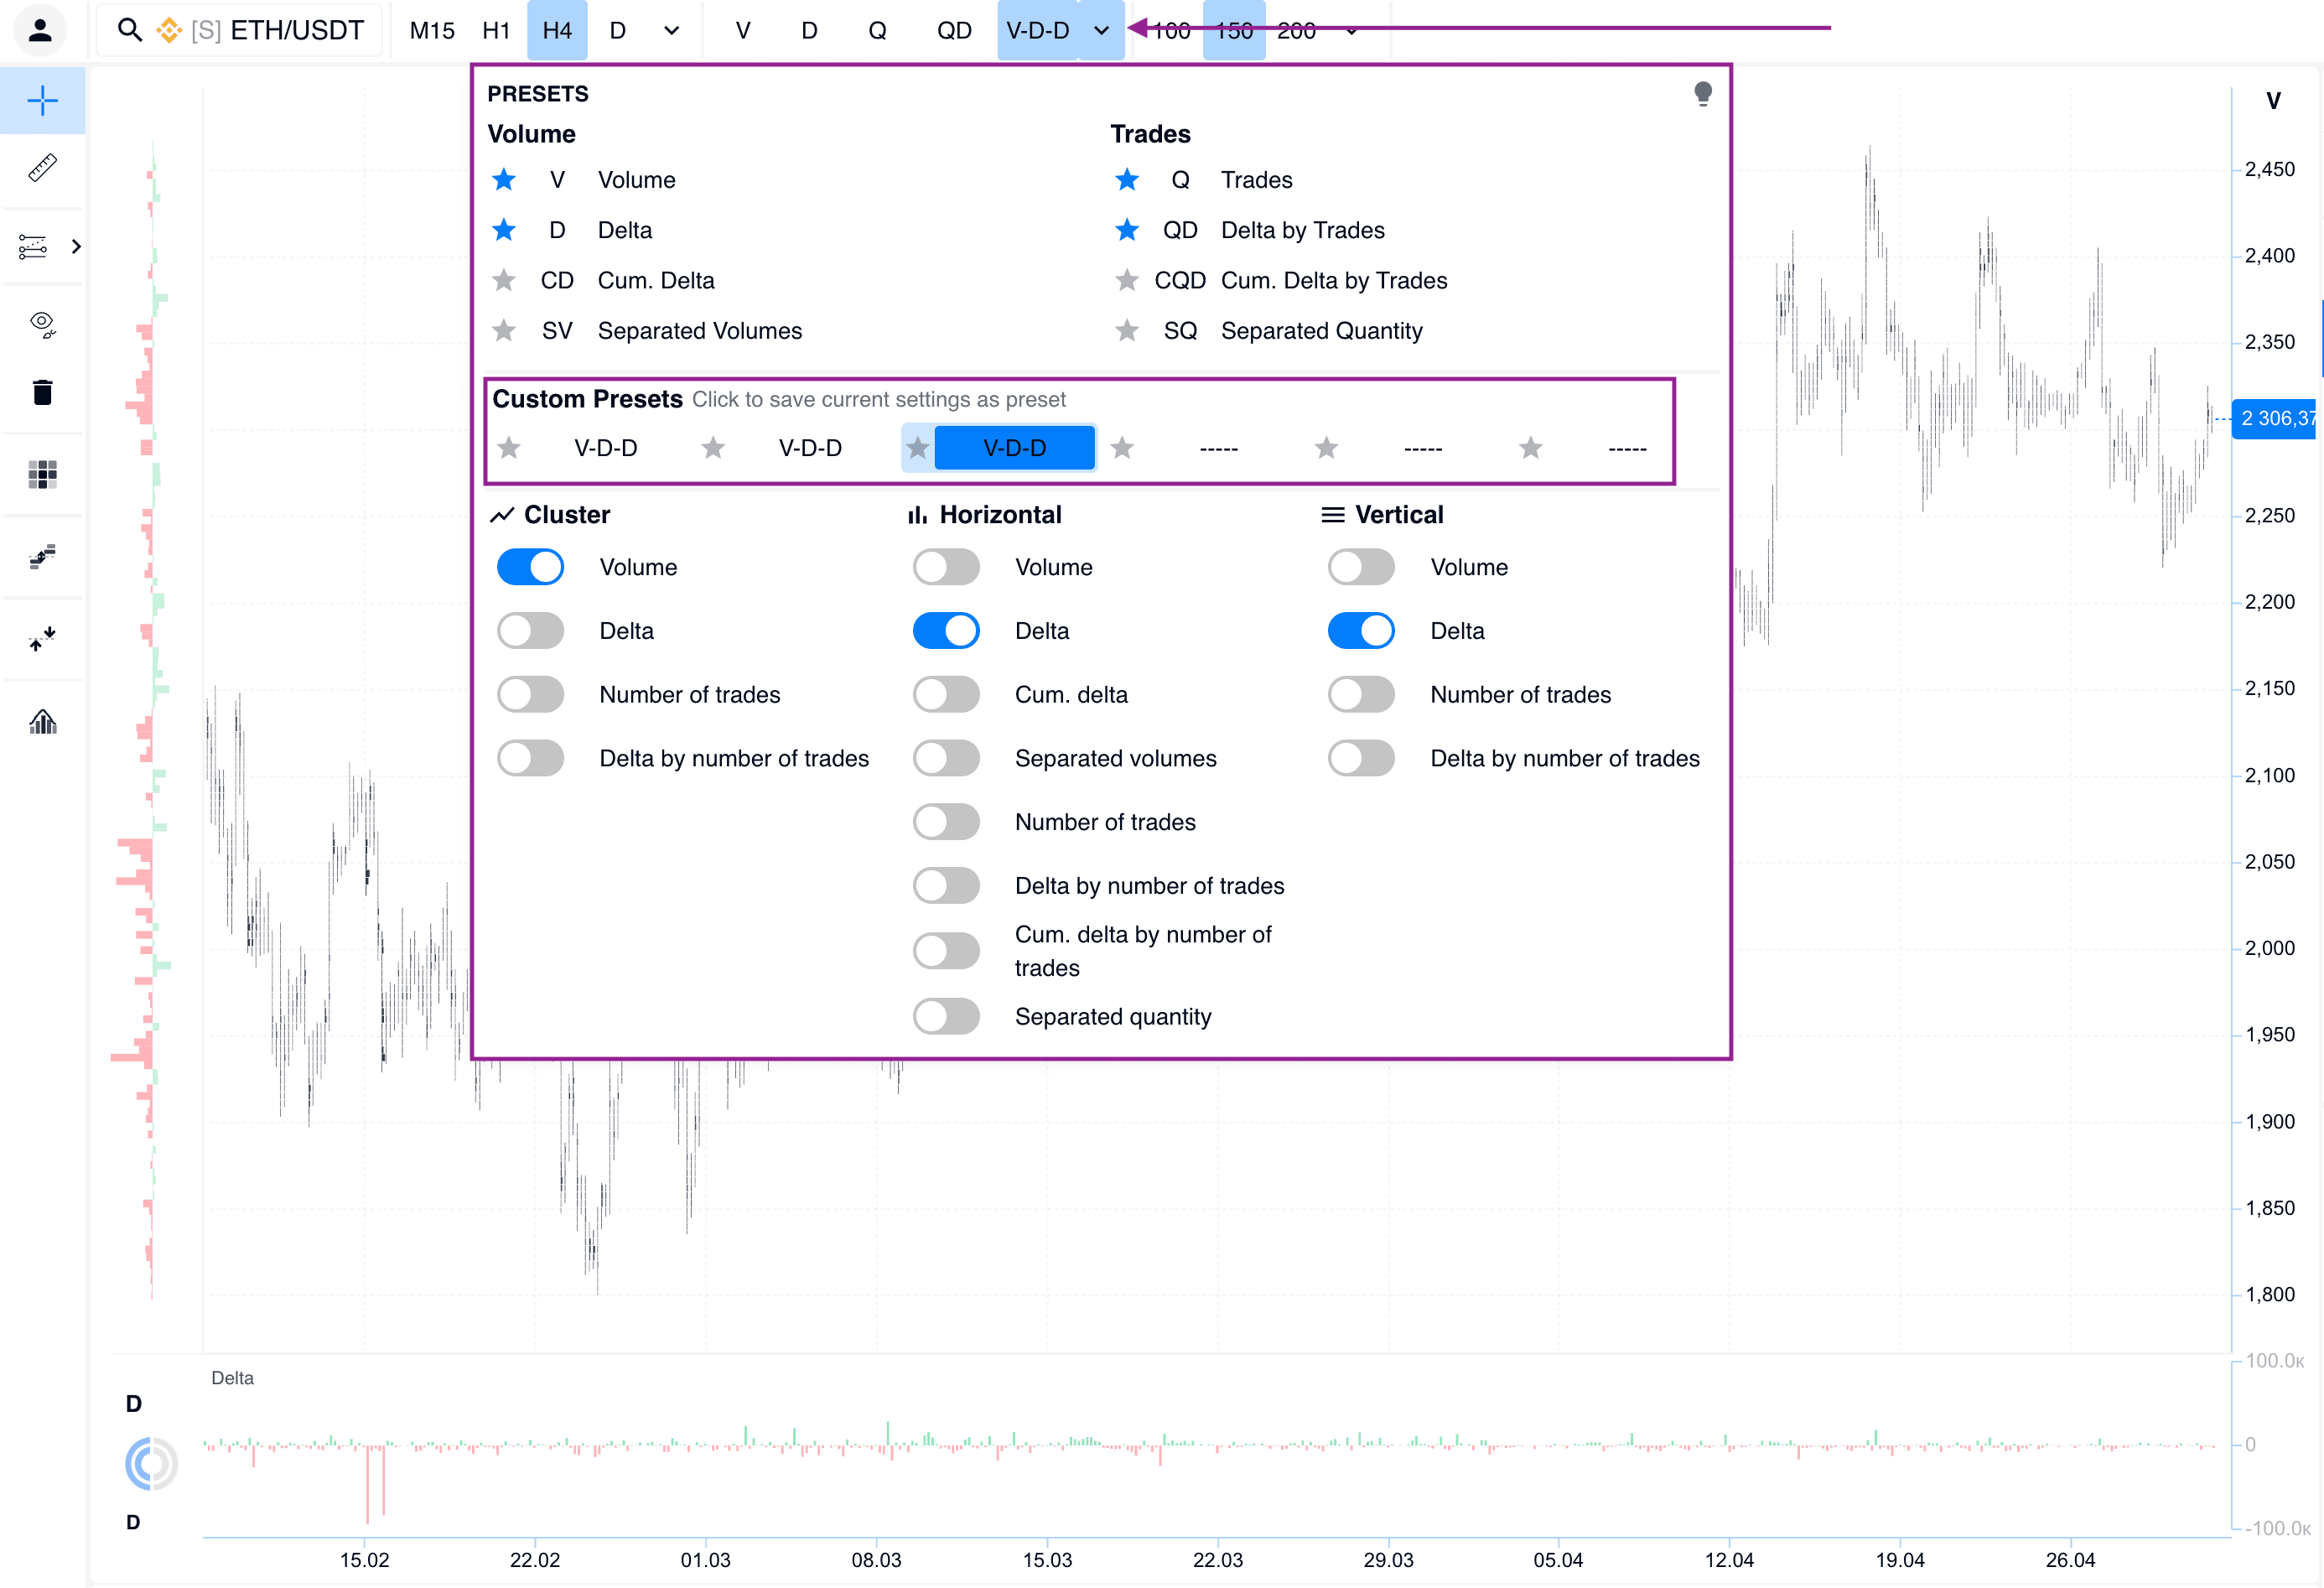
Data Types and Custom Presets
We have revised the data display logic so you can instantly switch between different analytical modes.
Favorite data types: just like with timeframes, you can now mark frequently used data types with a star. They are pinned to the quick access panel, allowing you to change the display in one click without extra steps.
Fast navigation: add your best settings to Favorites. This allows you to switch in seconds between, for example, a preset for finding large limit clusters and a preset for analyzing market delta, while keeping your focus on the chart.
Personal presets: the platform allows you to create and save custom presets based on your own settings.
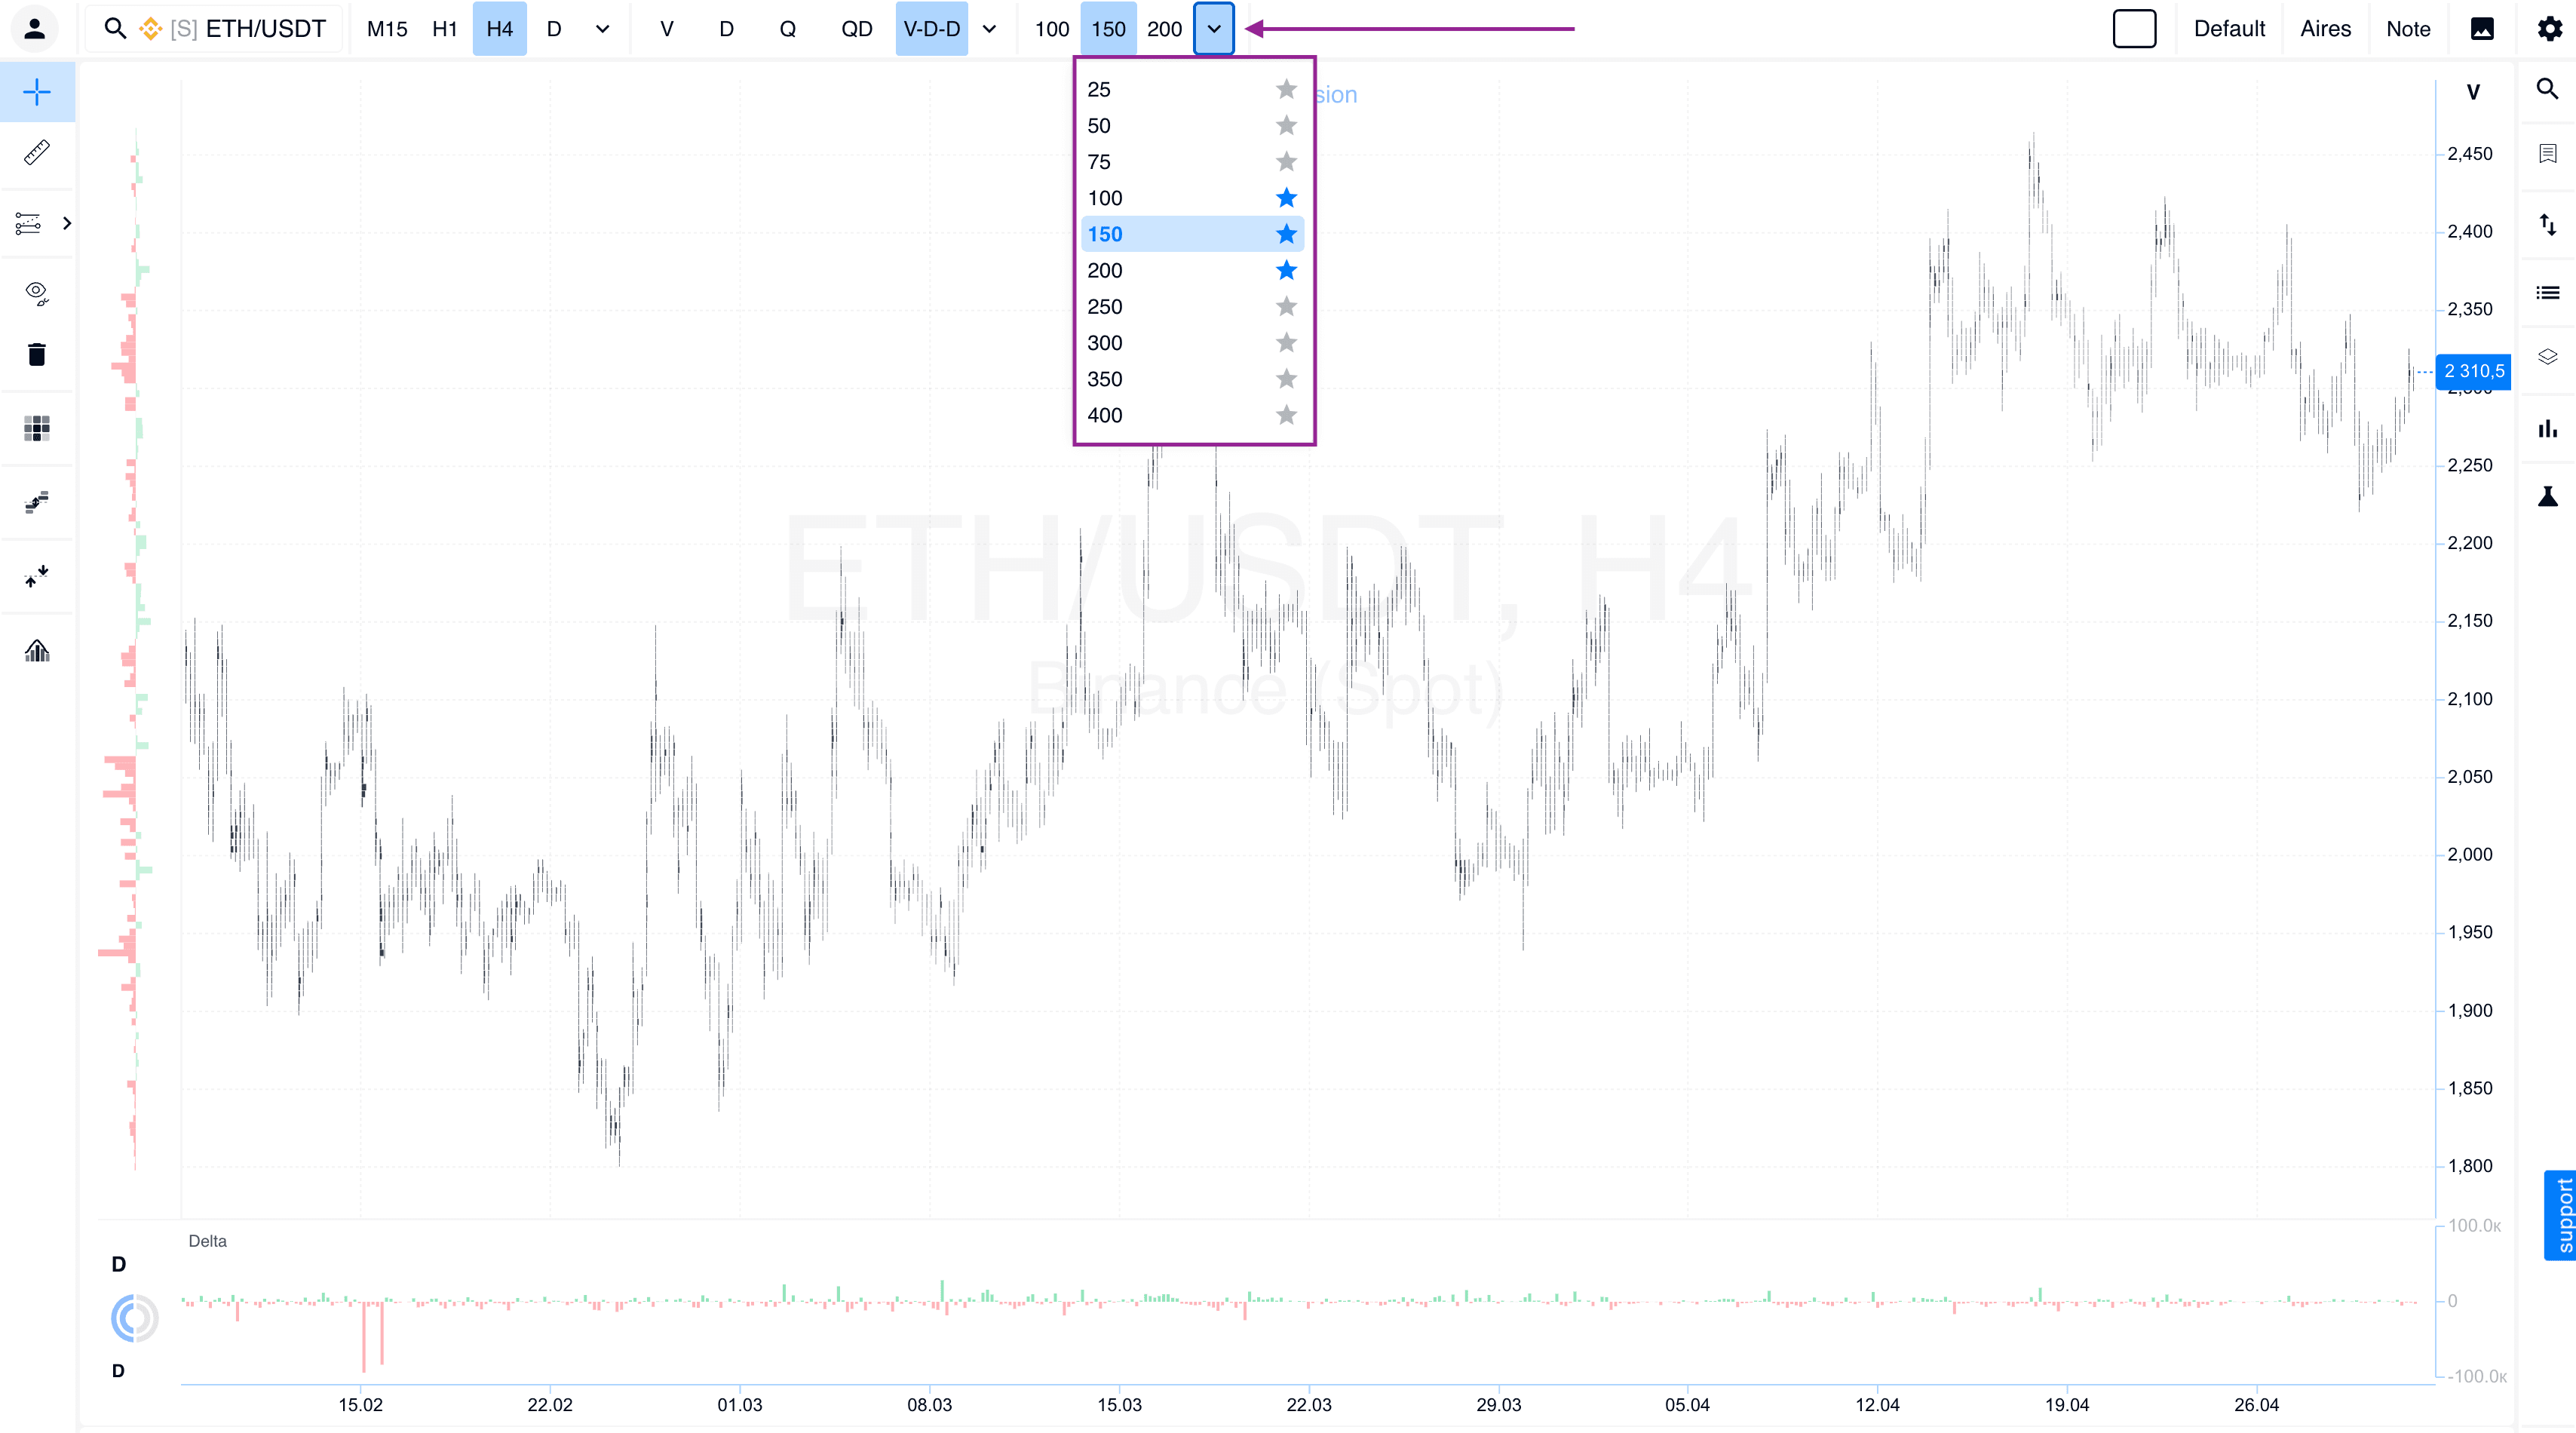
Detail Level
We have significantly expanded the range of detail settings so you can adjust the precision of data display to match your specific tasks.
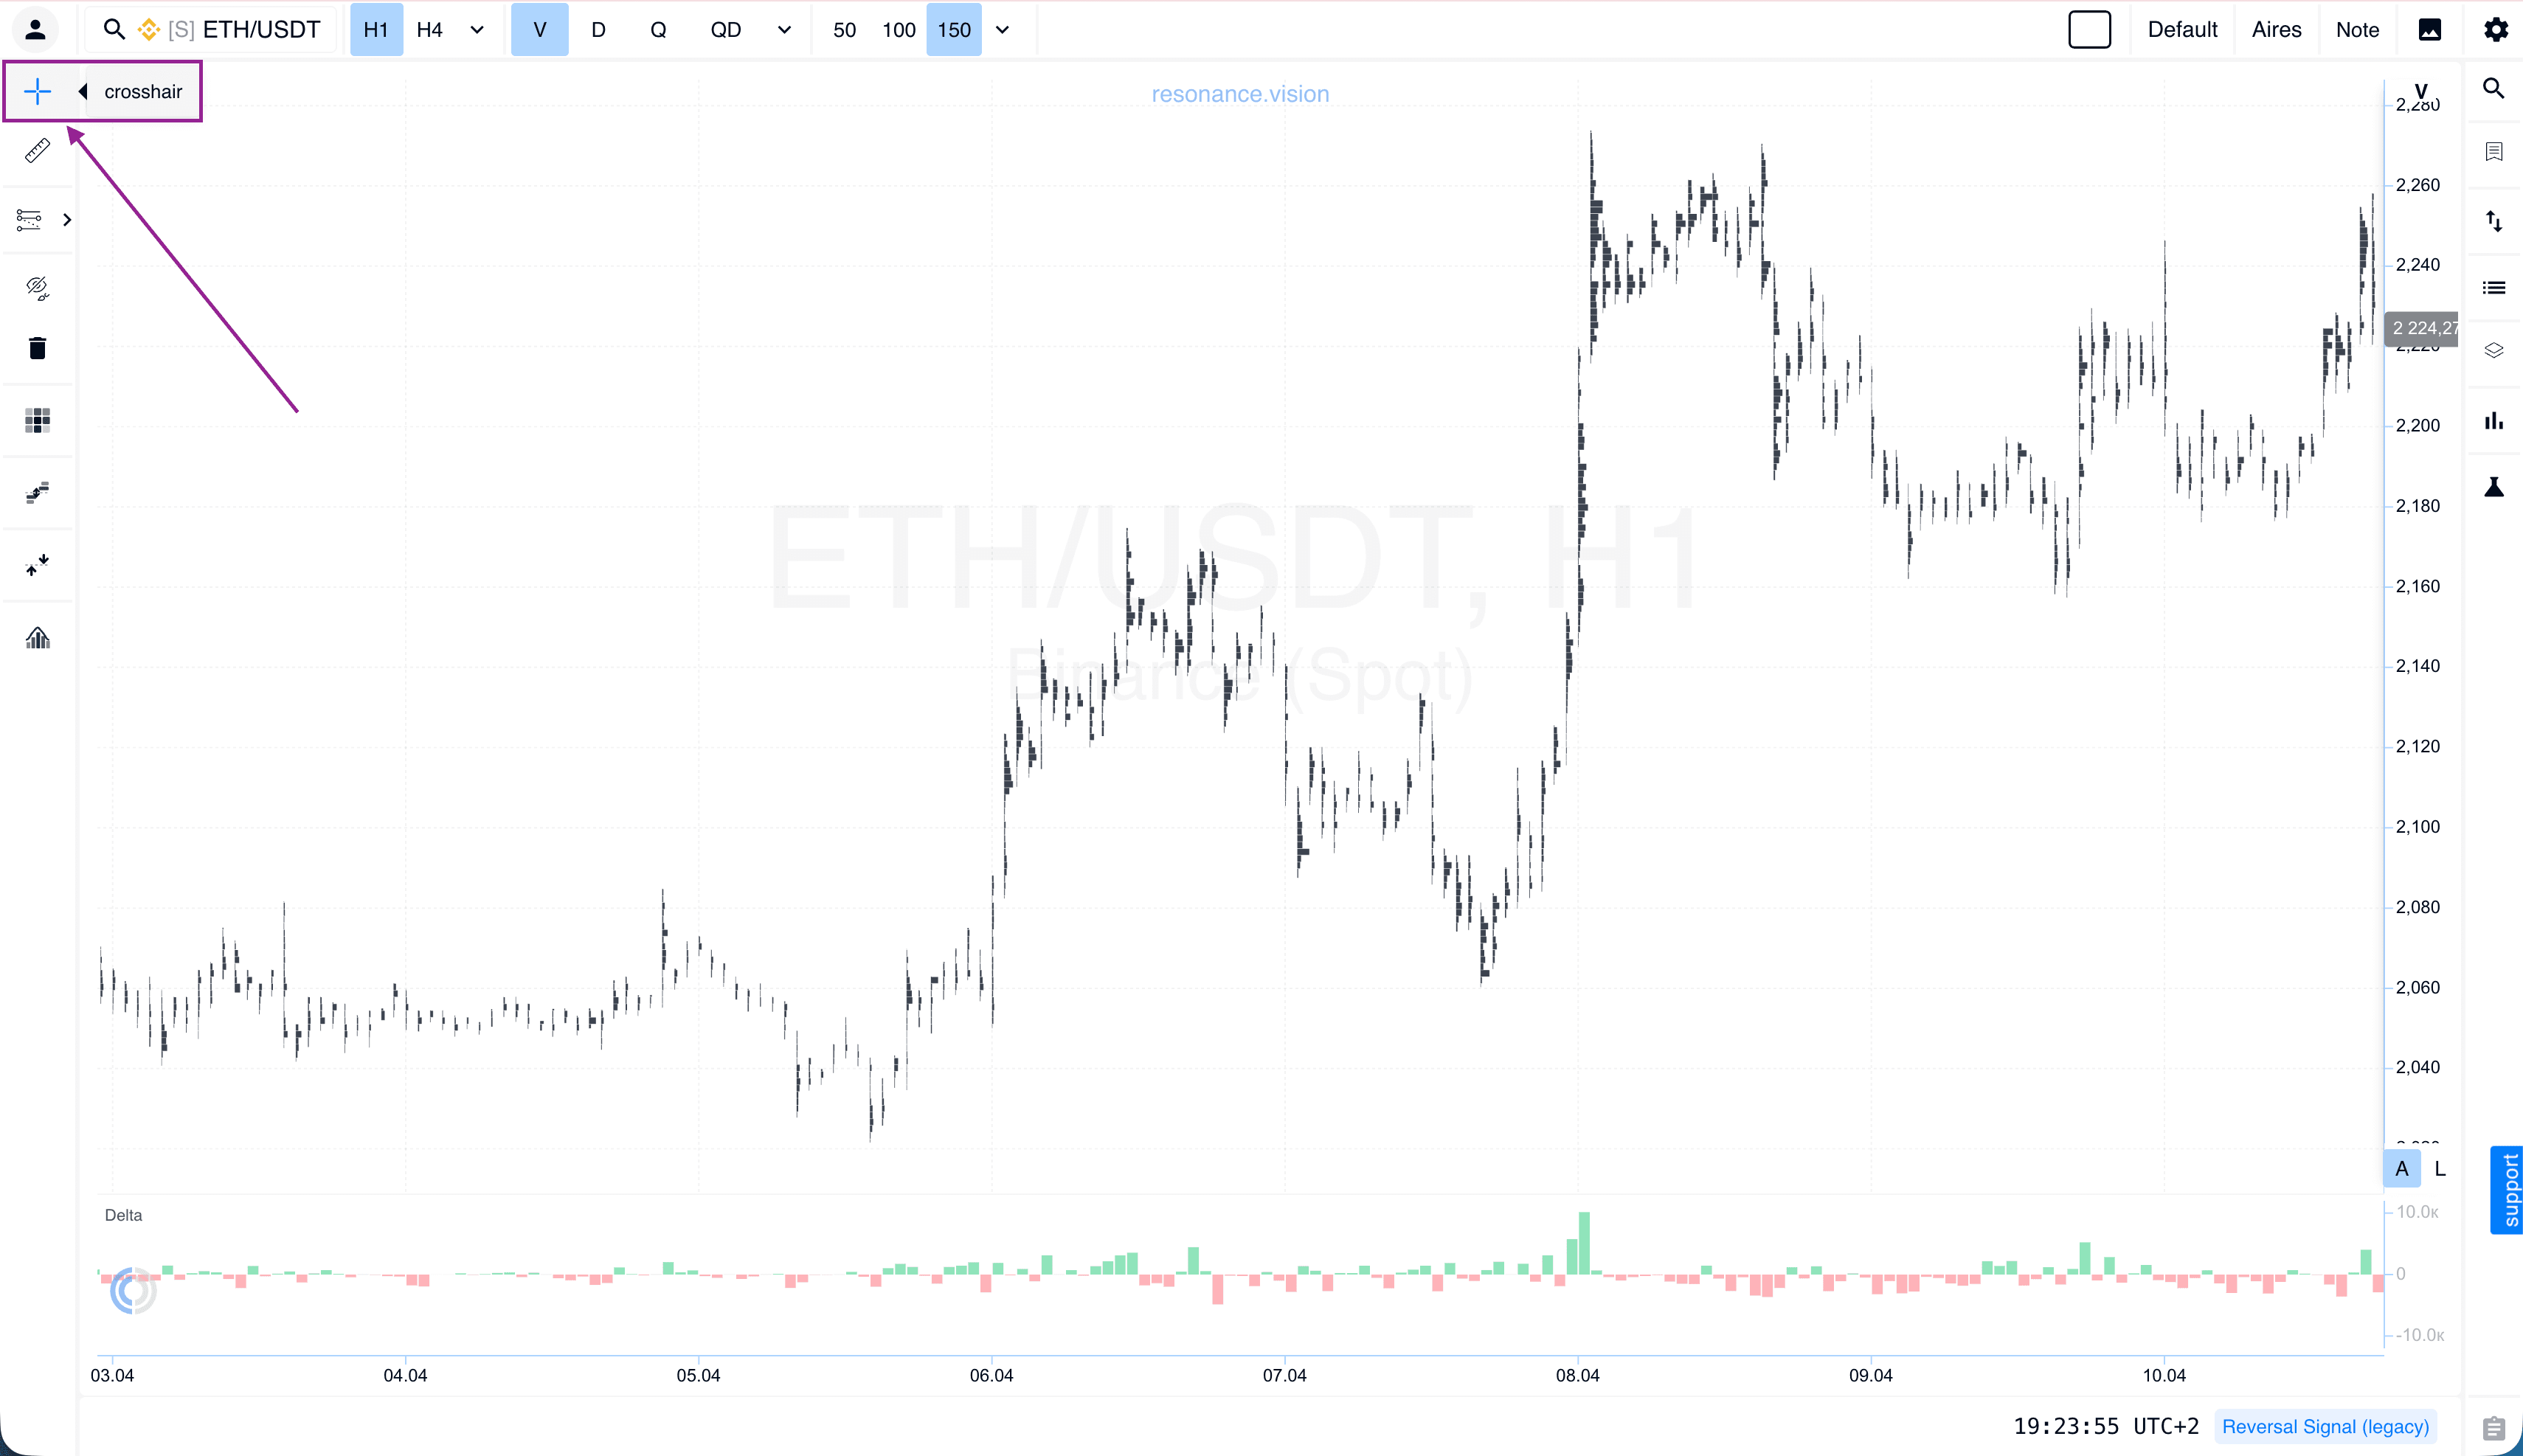
Crosshair
For those who prefer a cleaner chart, it is now possible to completely disable crosshair mode when hovering over the chart.
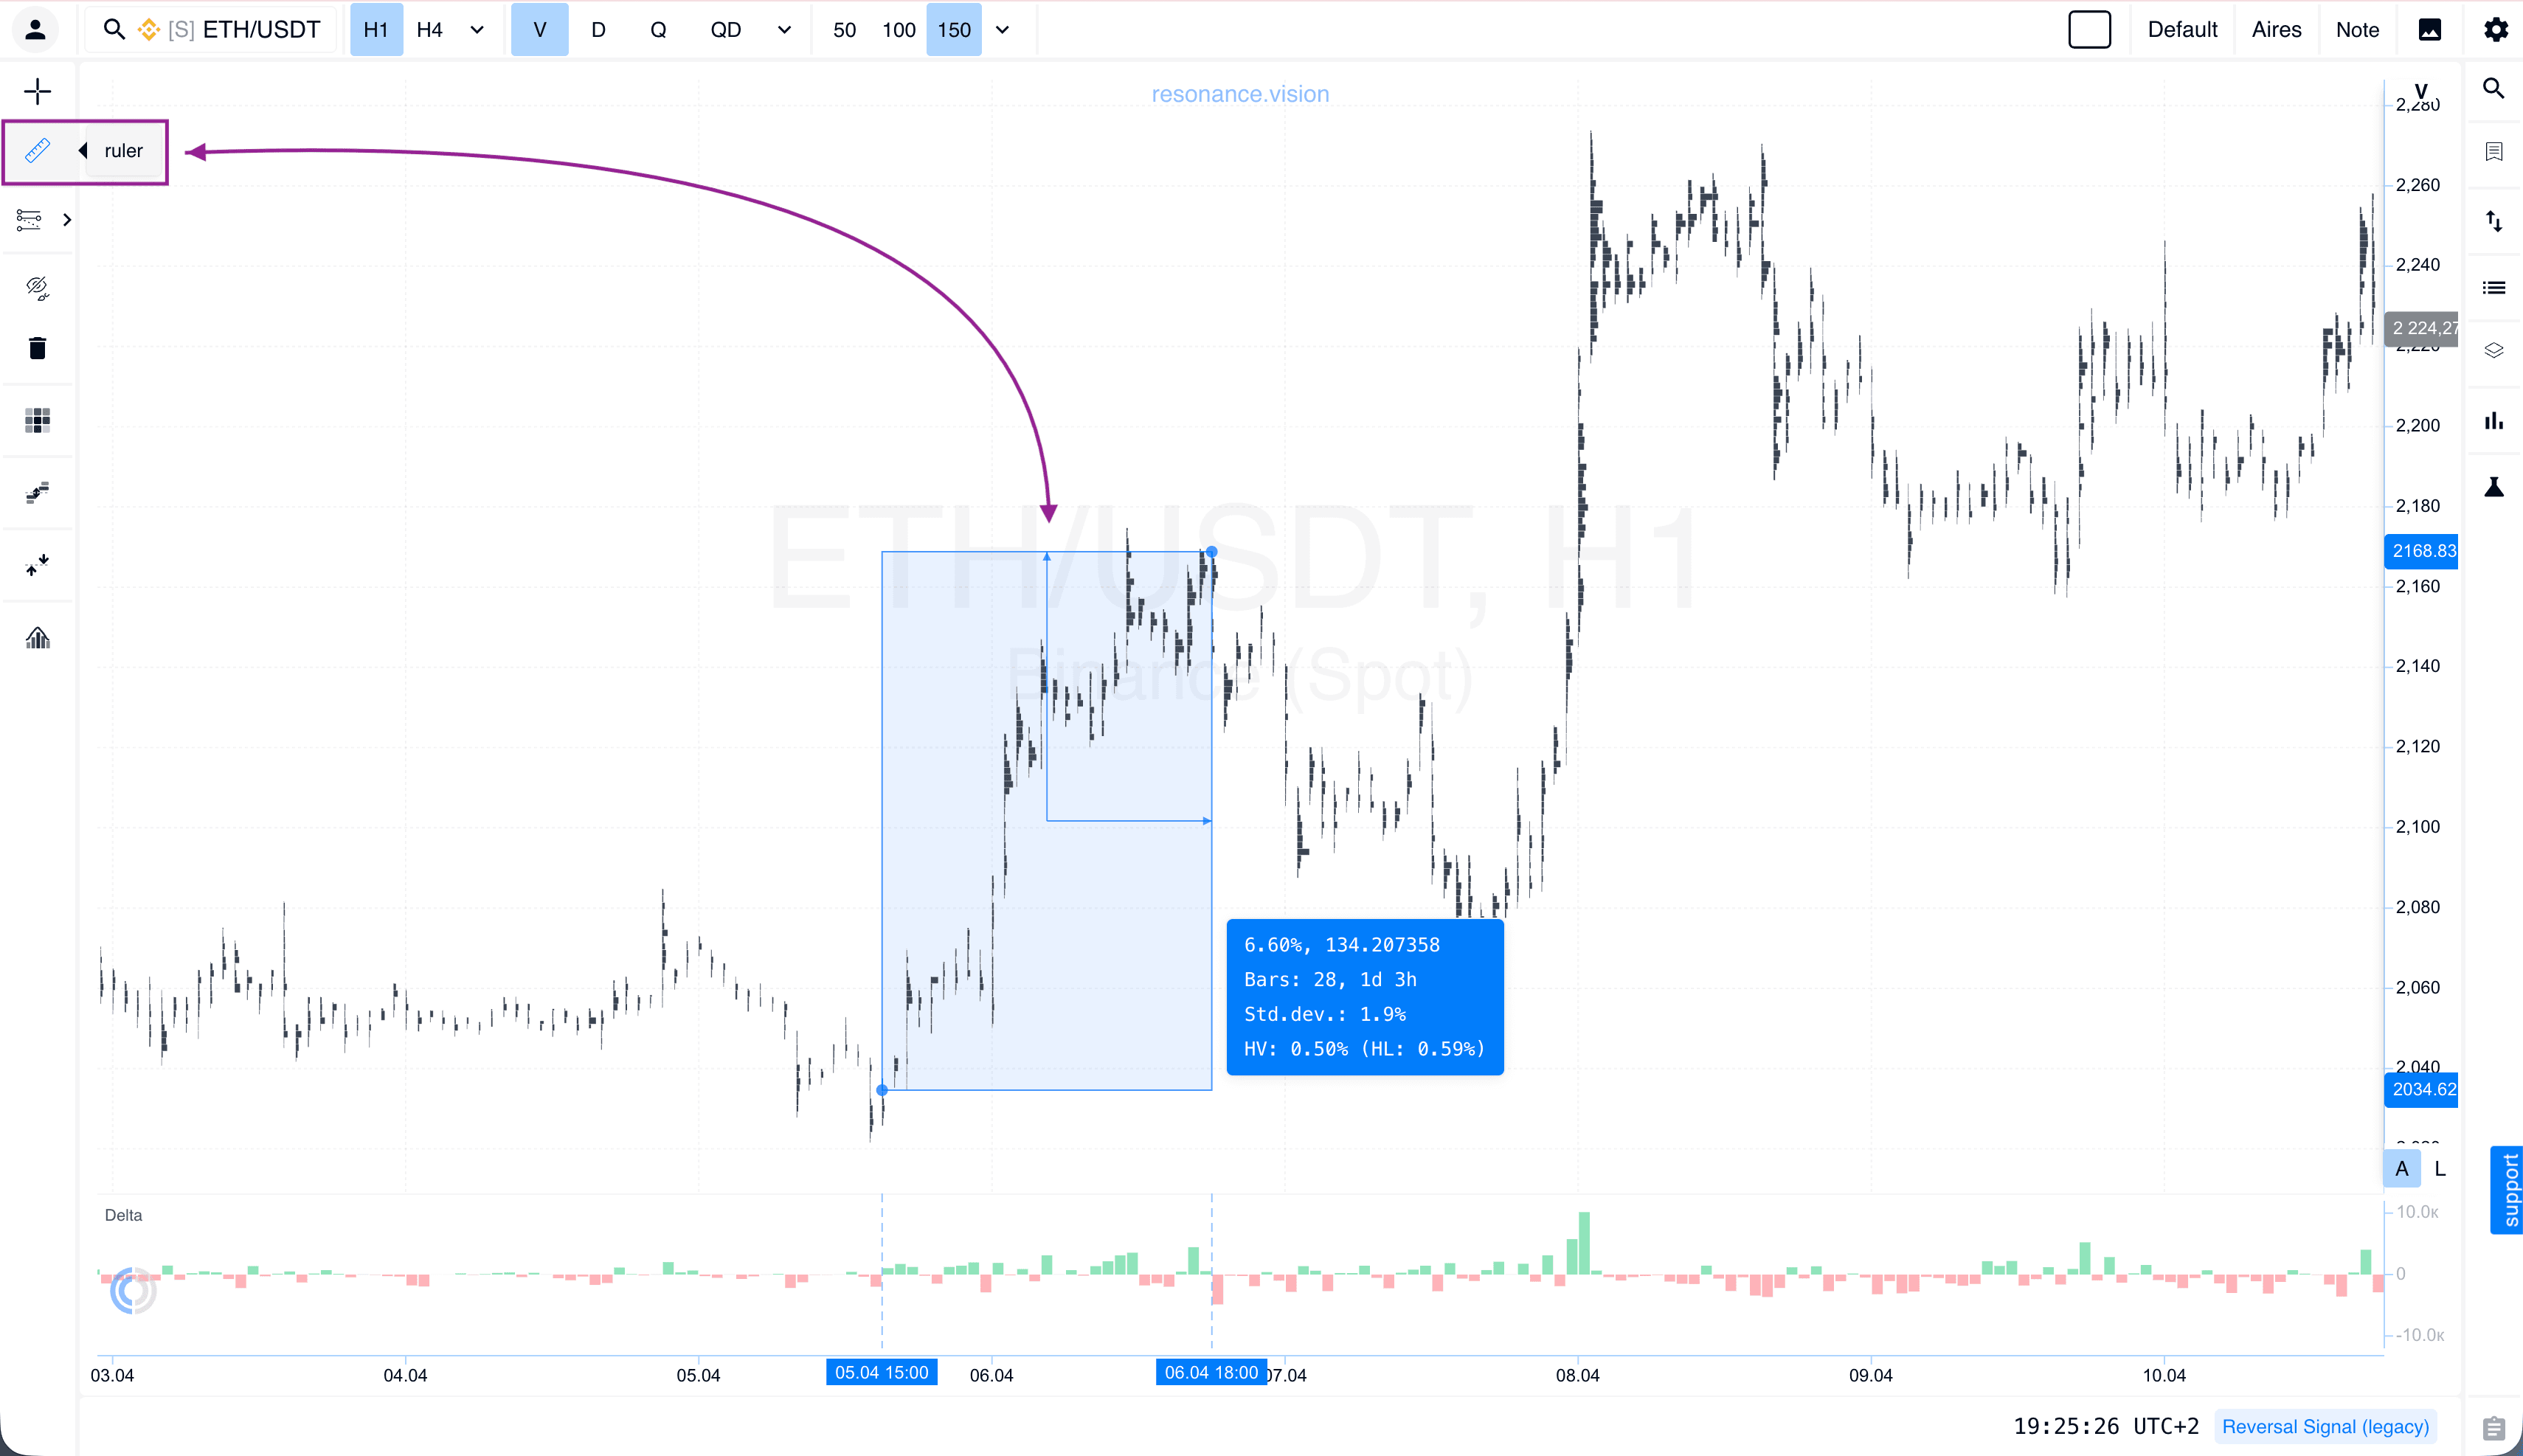
Ruler
The tool has received an updated design. At the same time, the familiar distance-measurement mechanic with the SHIFT key remains unchanged. It is still the fastest way to measure and calculate distances on the chart.
Heatmap
We have redesigned the heatmap settings interface, making it simpler and more intuitive to manage.
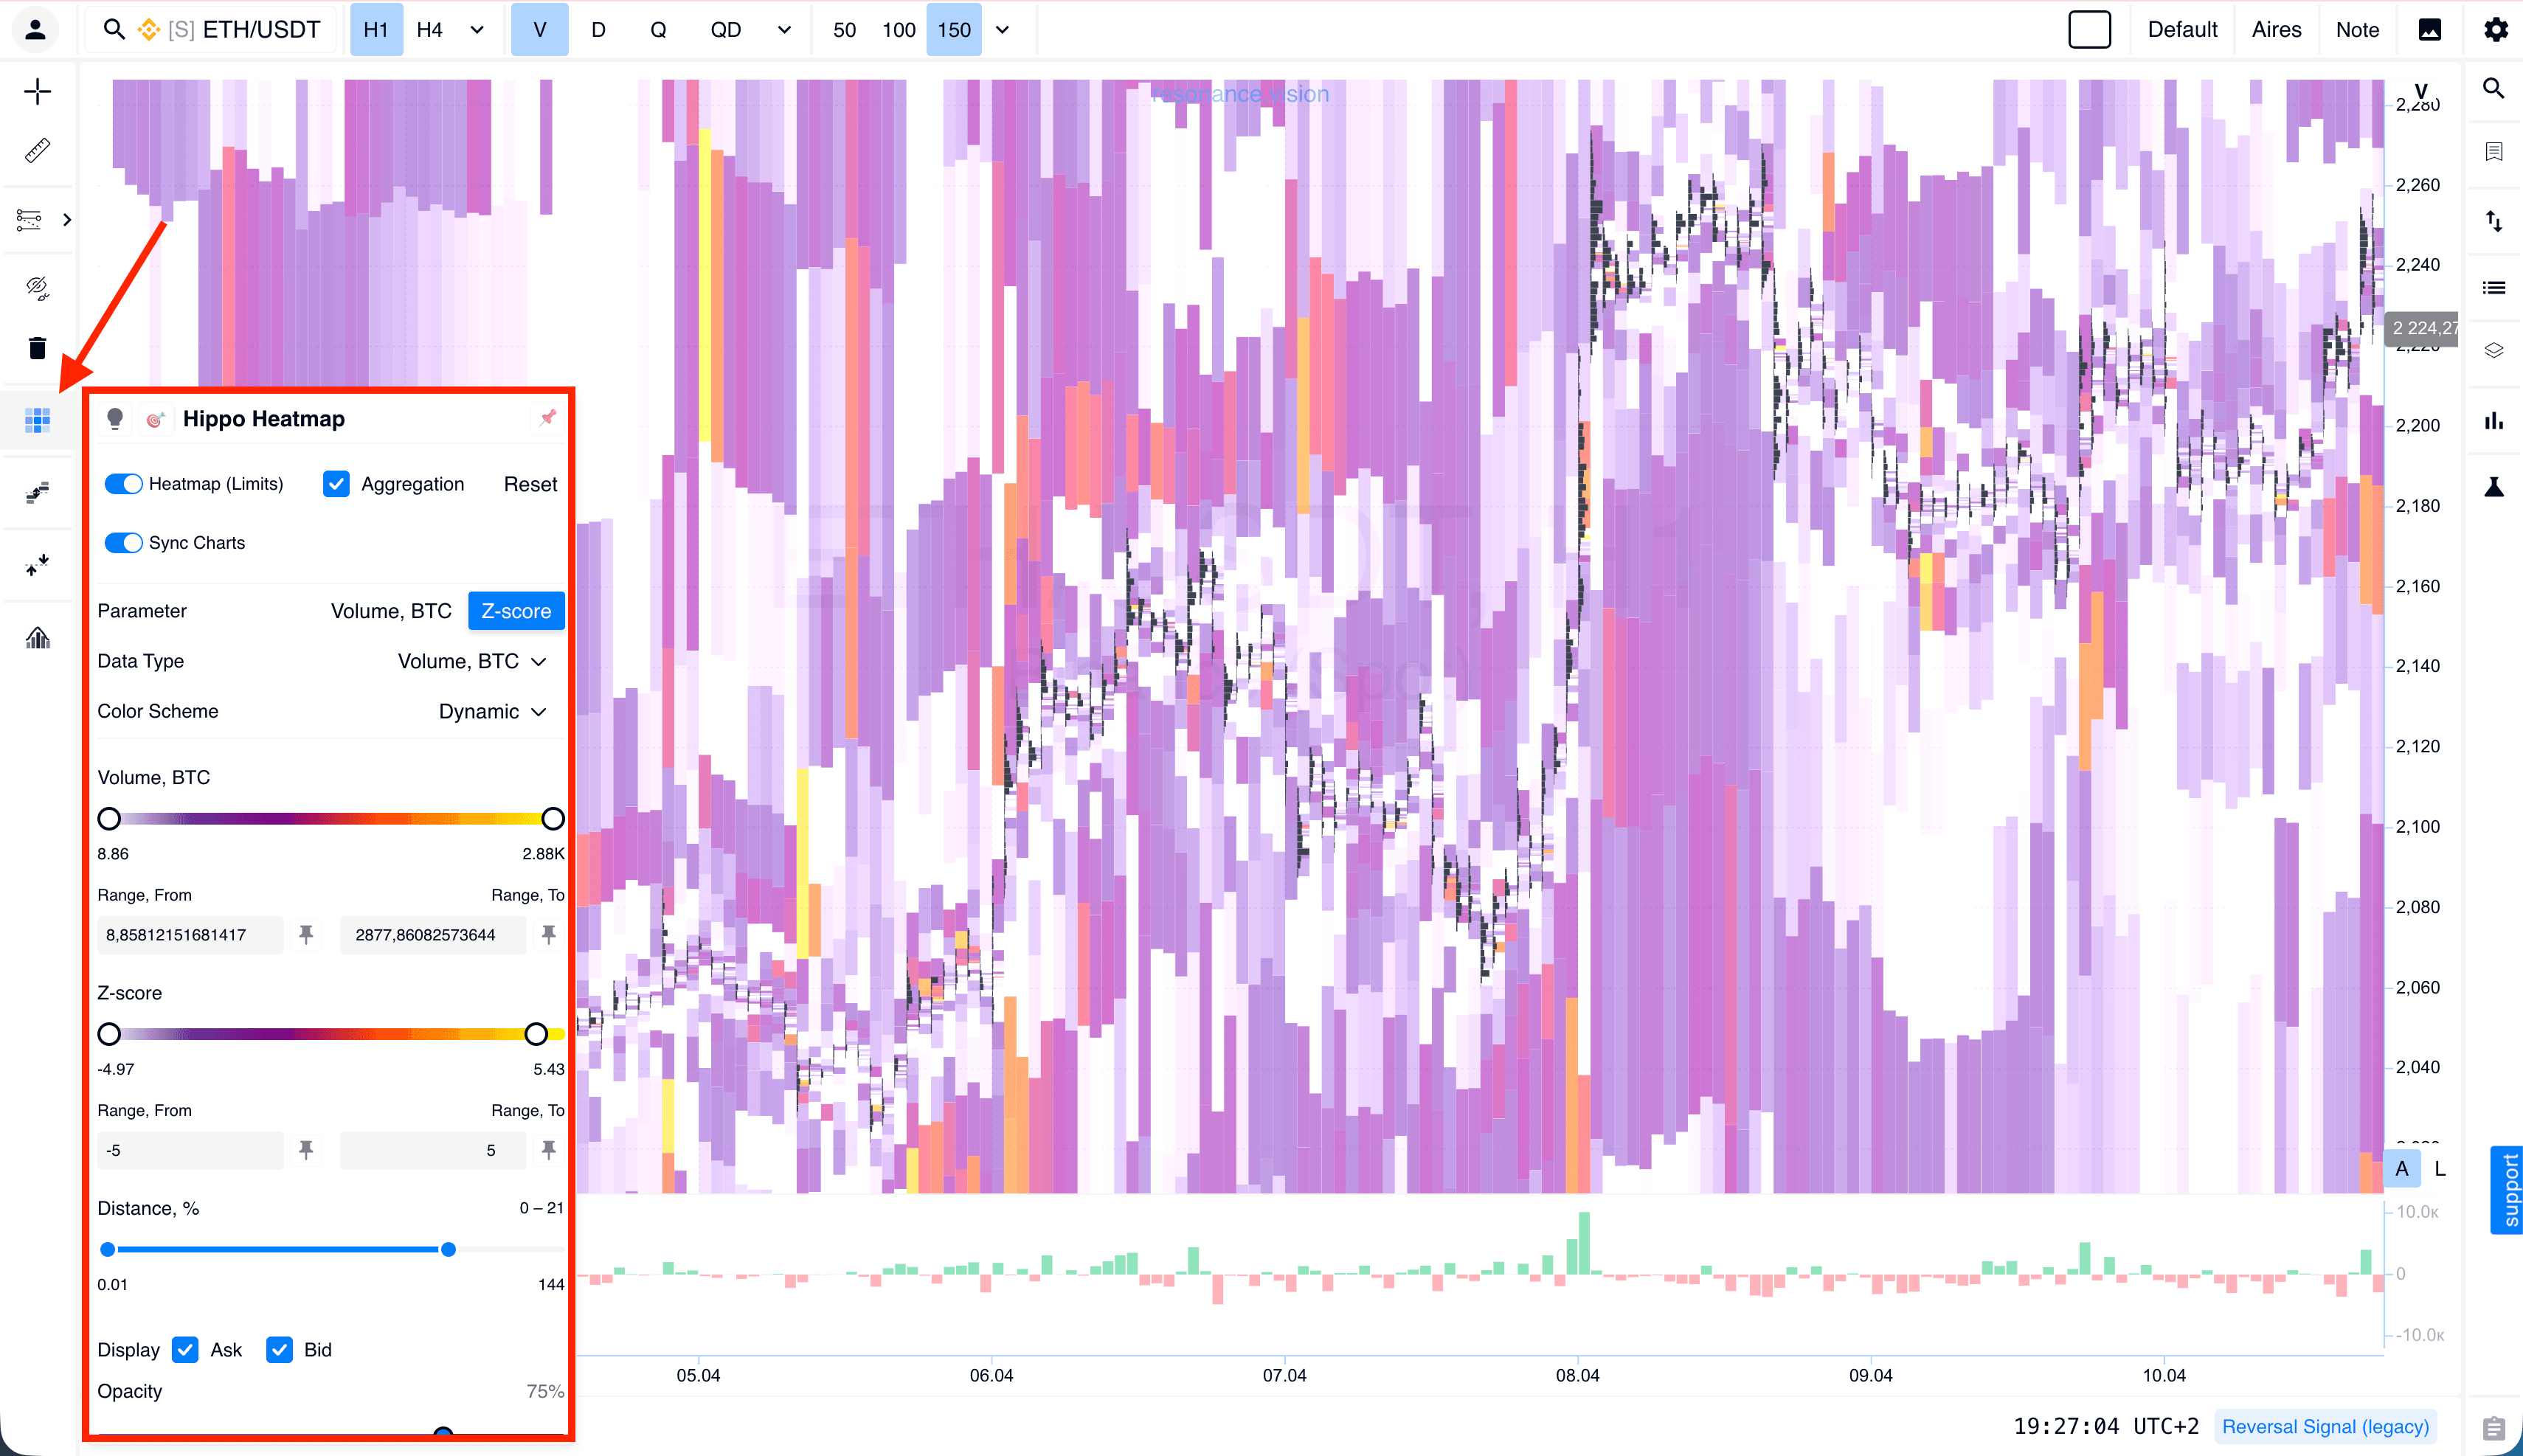
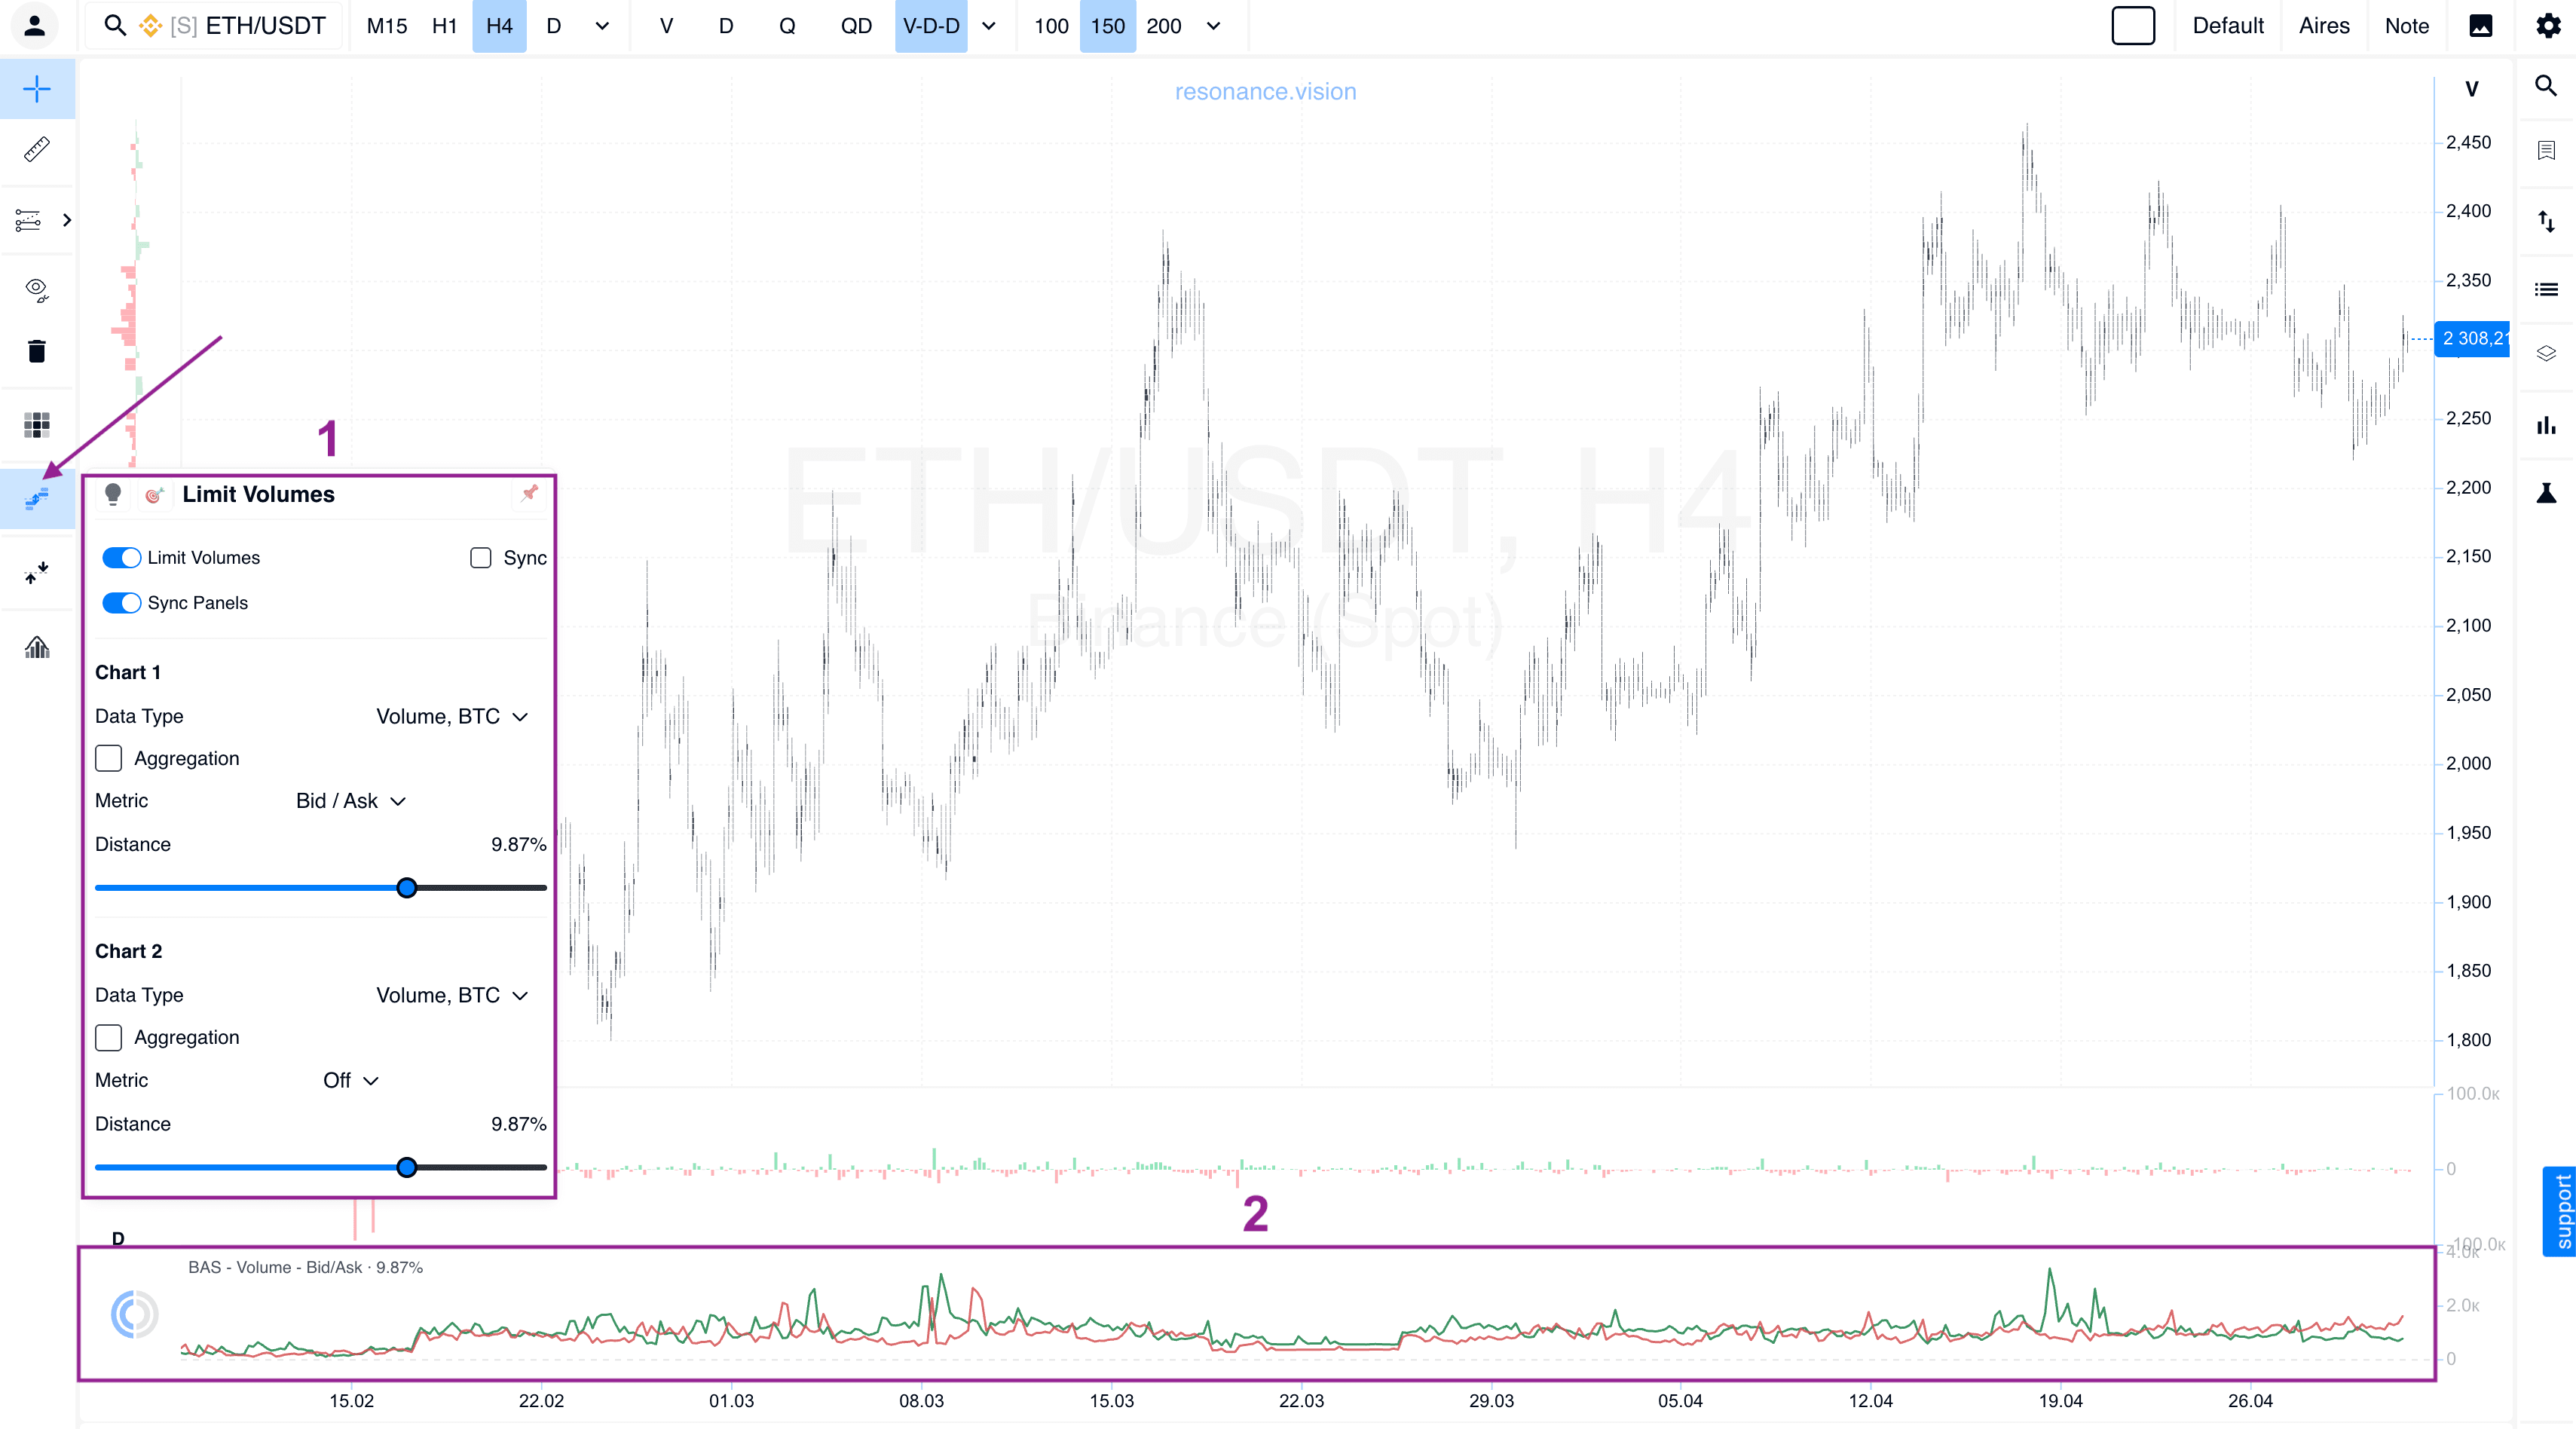
Limit Volume
Limit order data can now be integrated directly into the histogram below the cluster chart. This makes liquidity analysis even more convenient, while improved filters help remove unnecessary market noise.
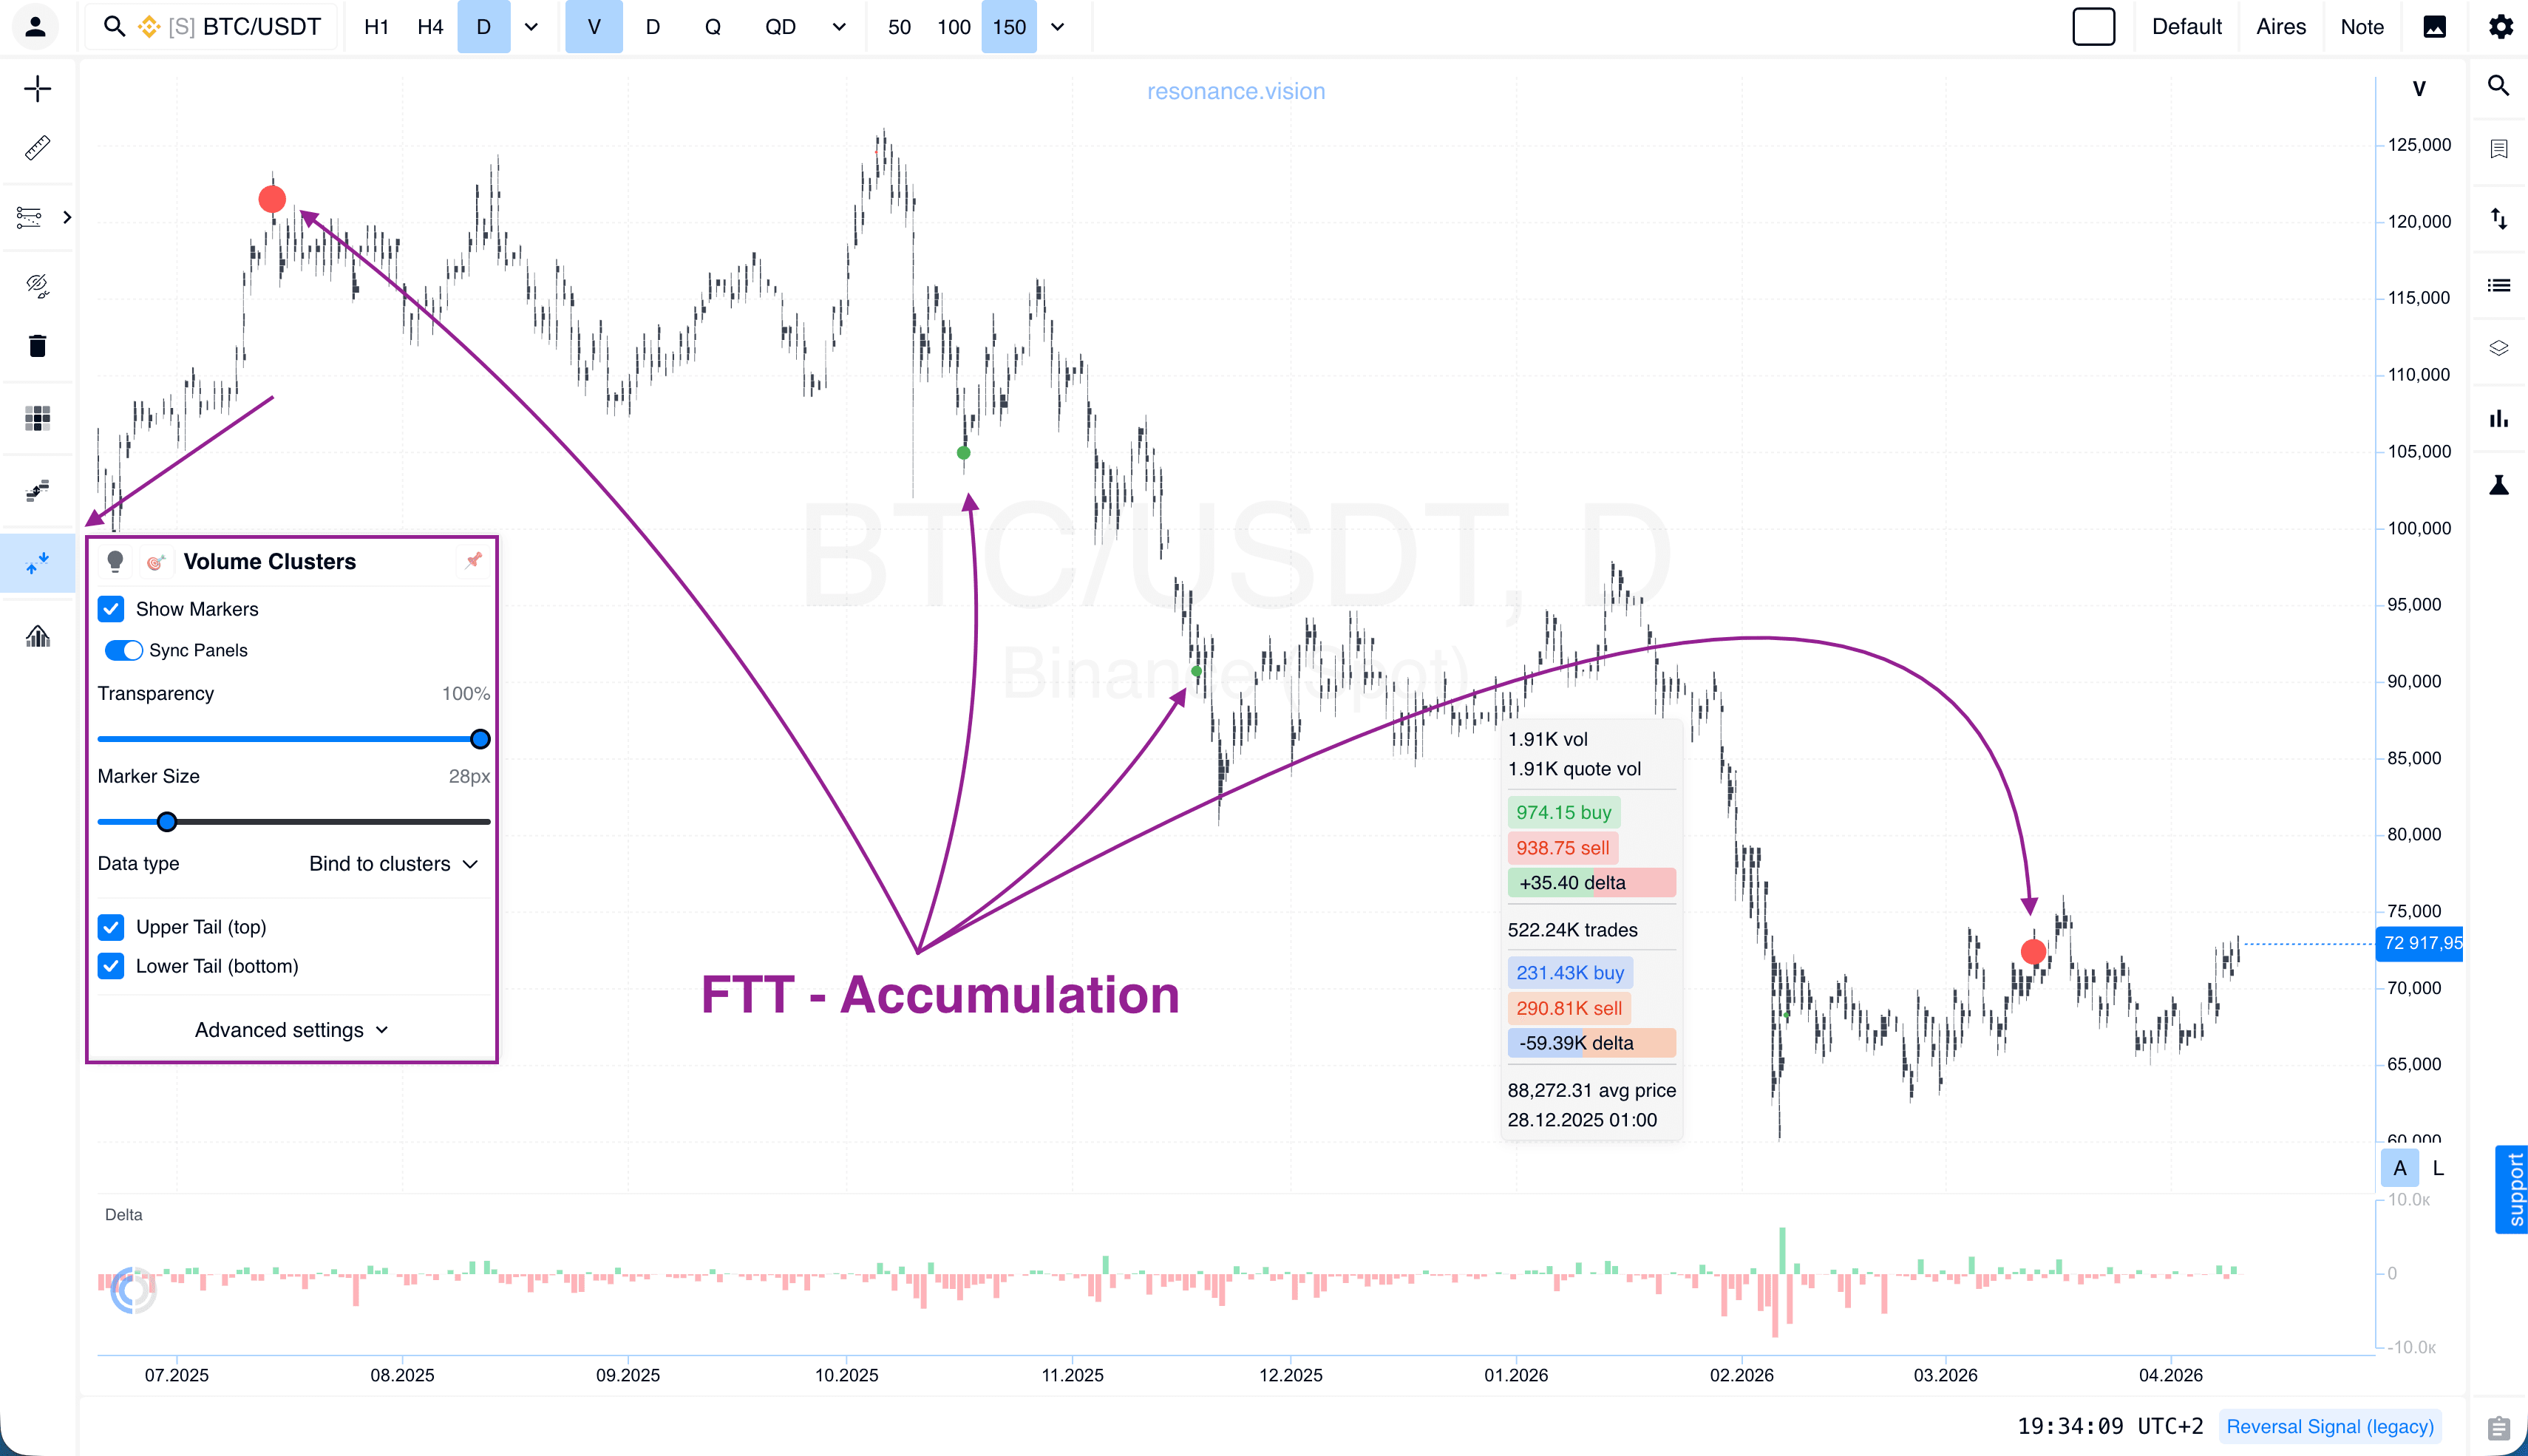
Volume Clusters
We have visually updated the display of abnormal accumulations at cluster chart extremes. Accumulation zones are now highlighted: red at the bottom and green at the top. The transparency and visibility of these zones can be adjusted individually.
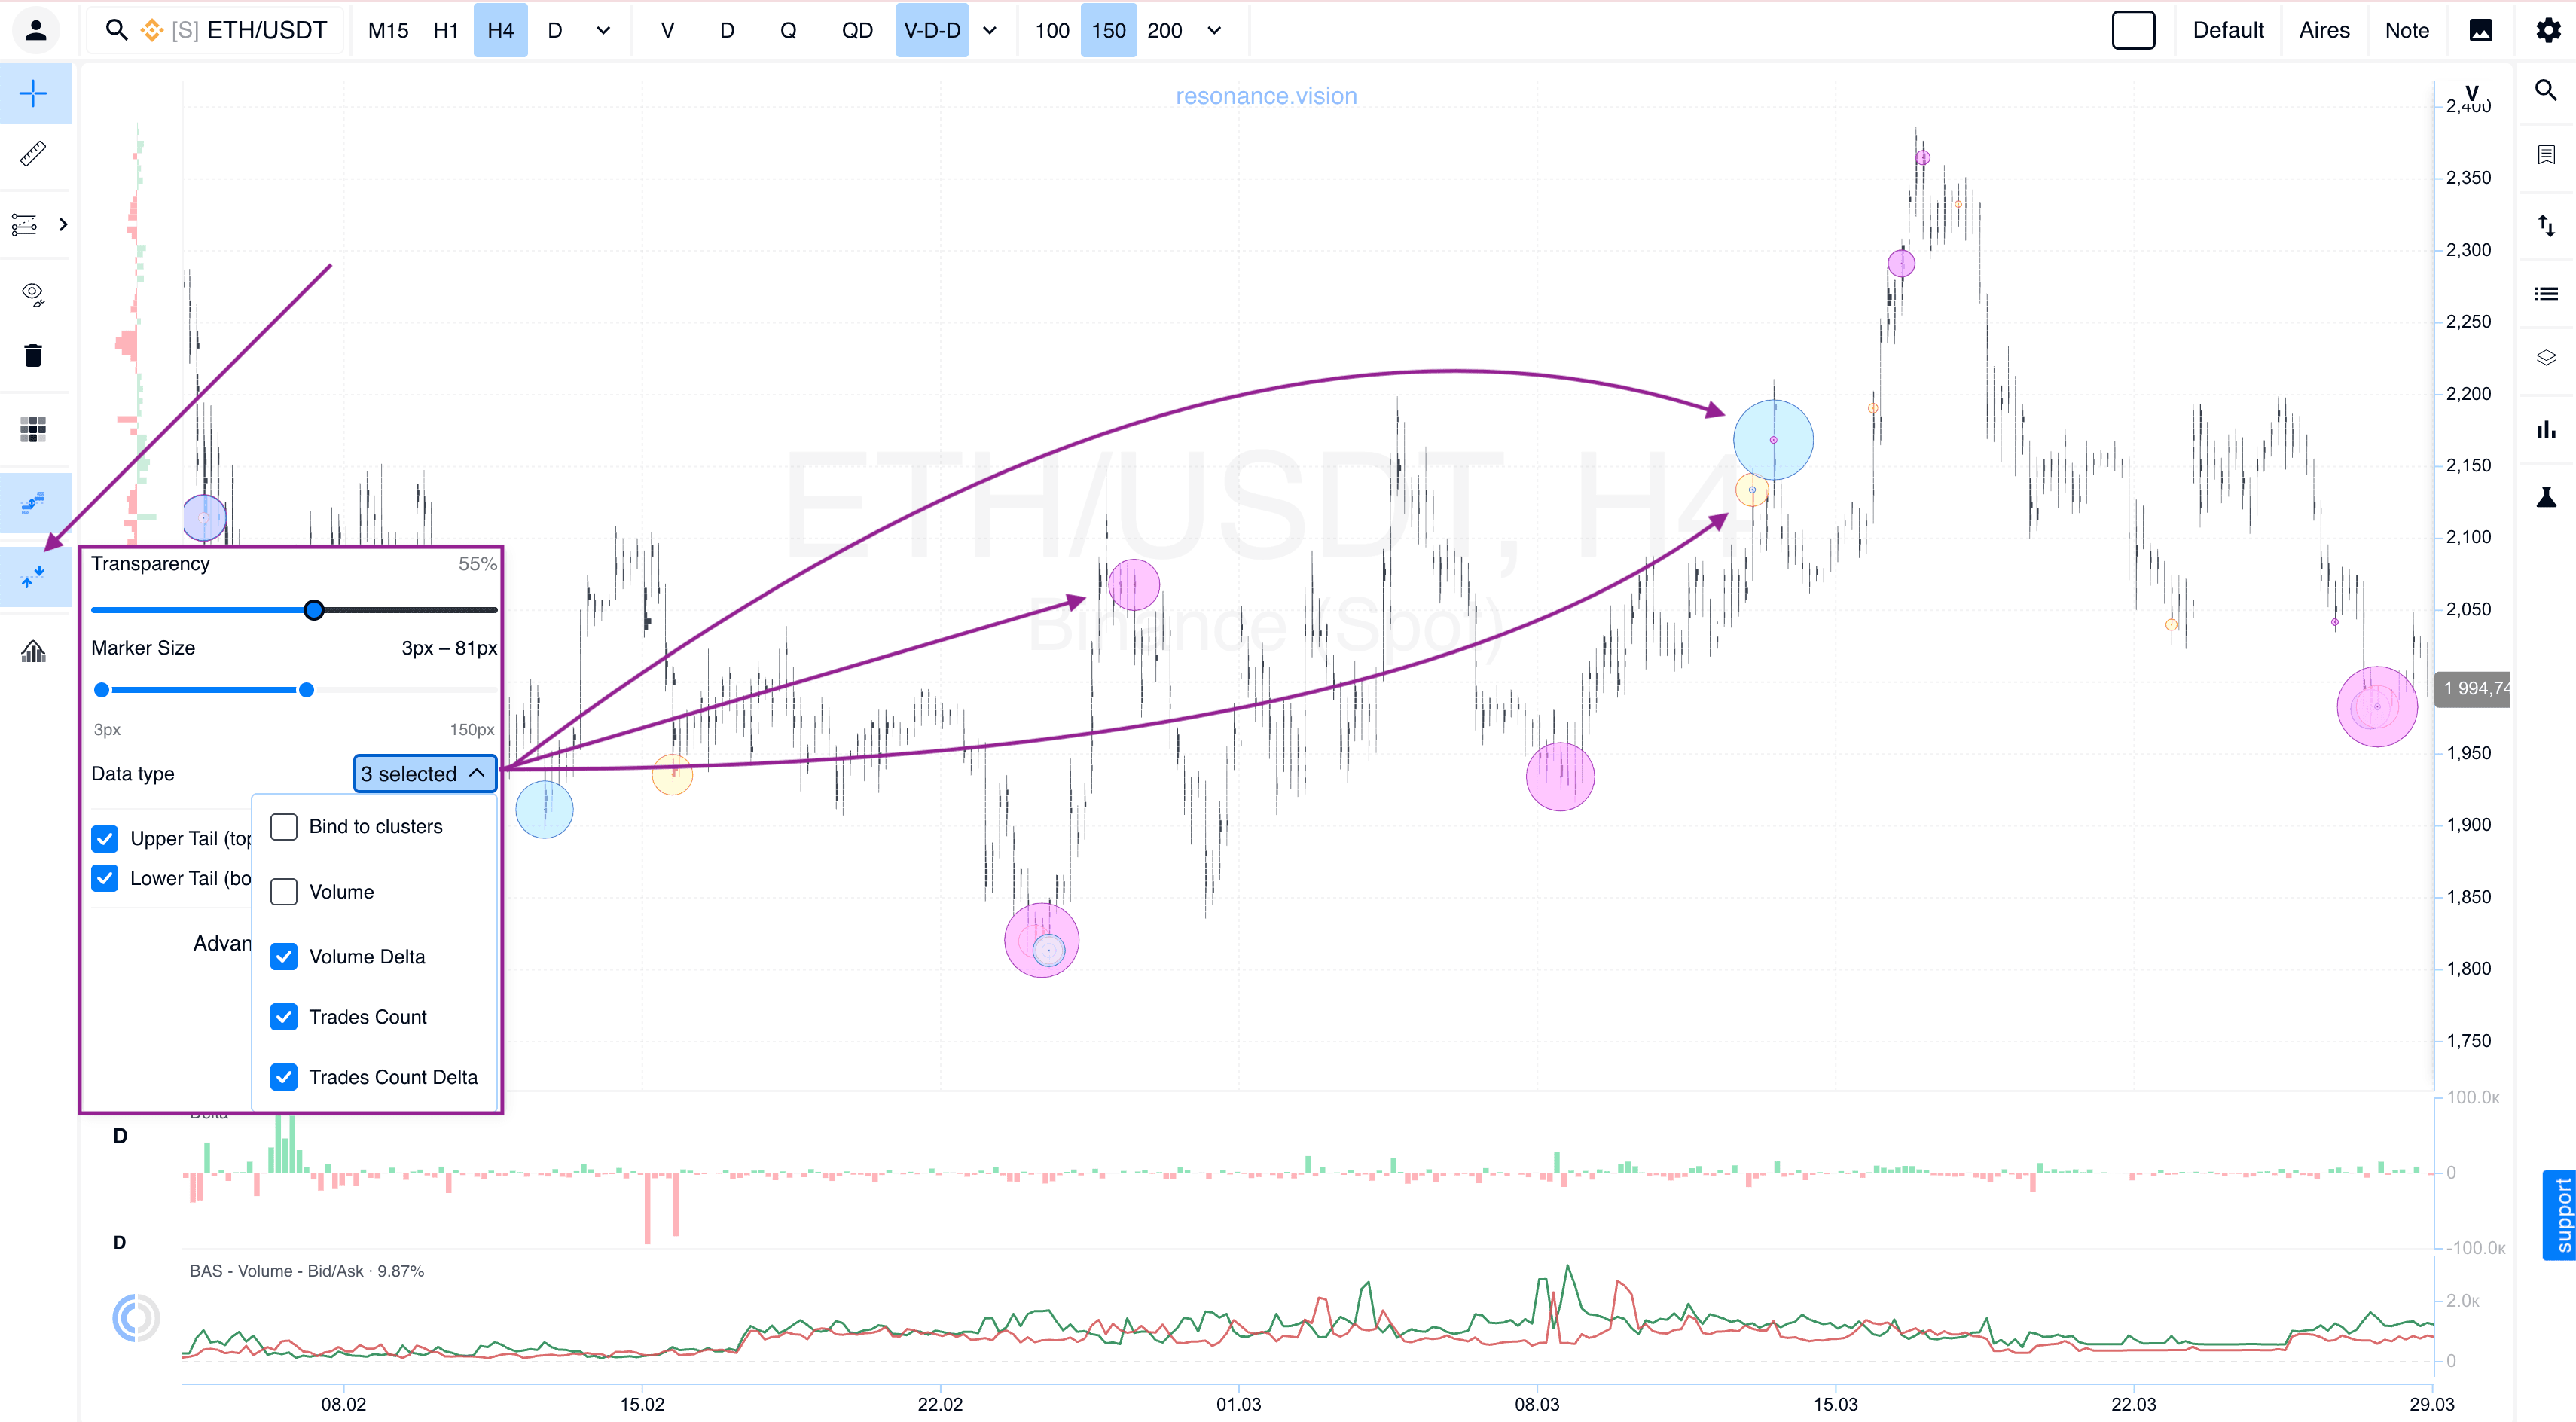
You can also display abnormal accumulations across different data types at the same time, based on your current settings, without switching to the data type where the anomaly was originally detected. Marker size and transparency can also be customized.
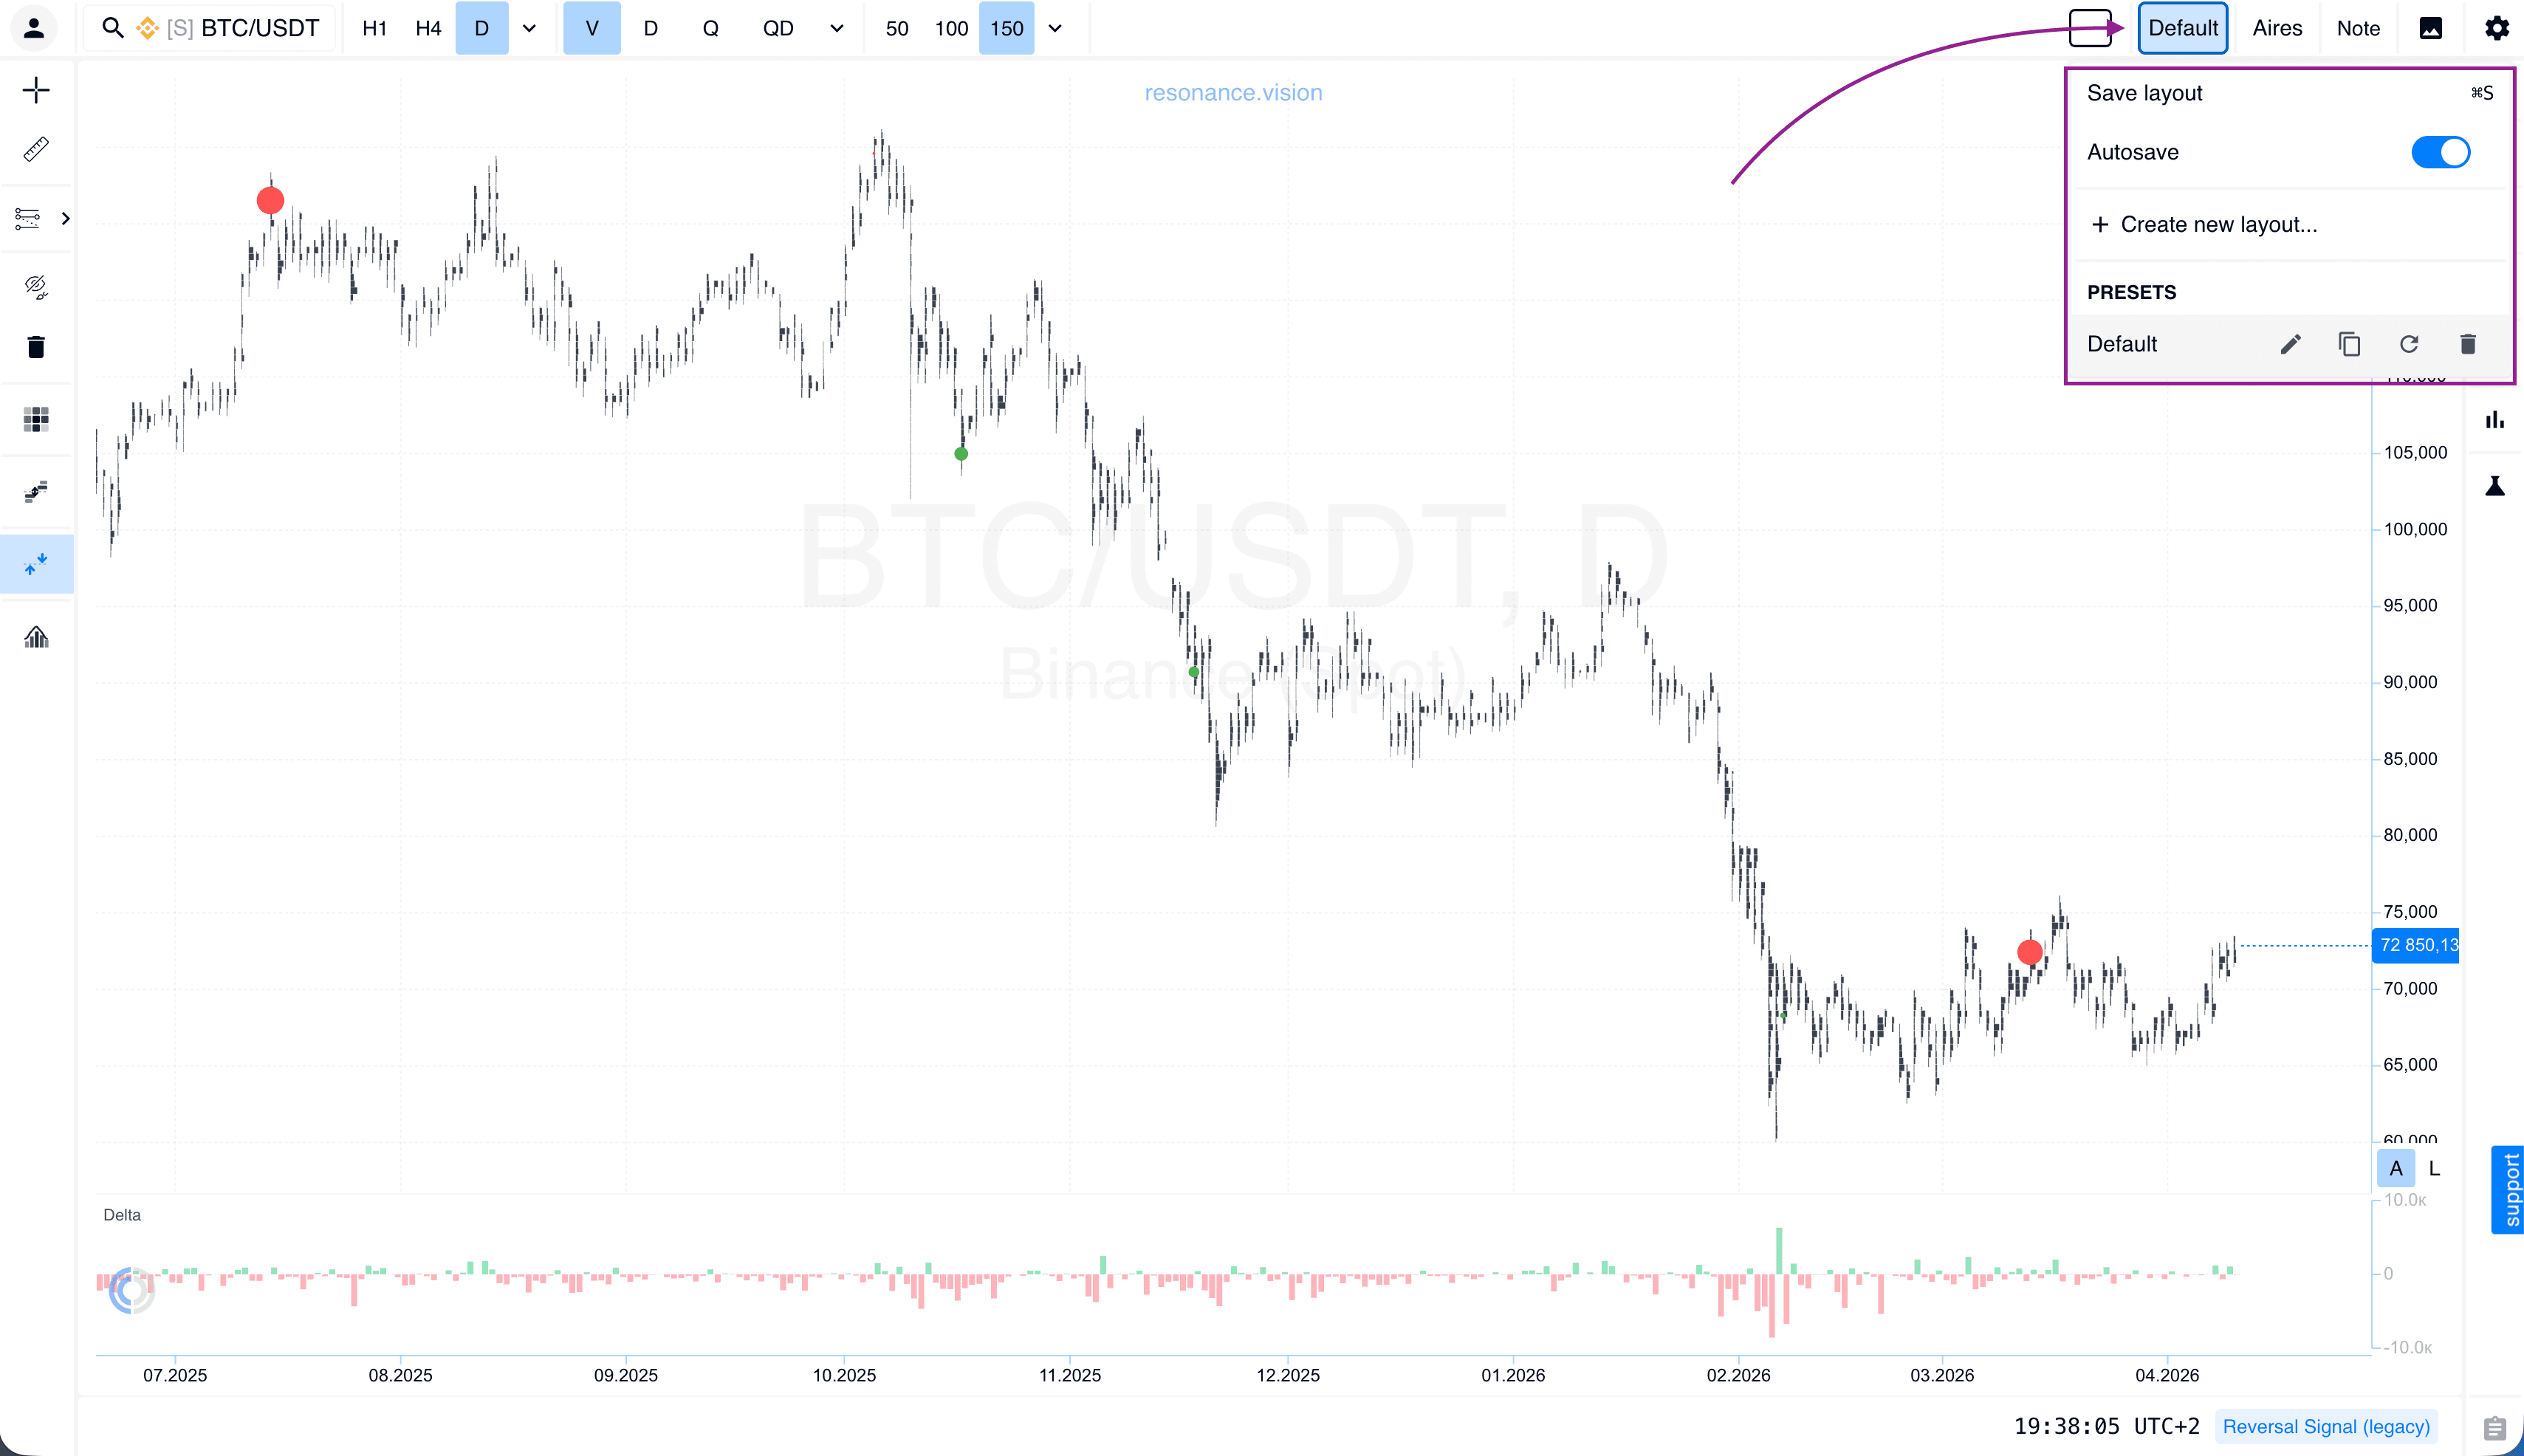
Presets
We have added an autosave feature for the active preset. It can be disabled if needed. The library already includes a large number of ready-made templates for different trading styles. You can also add a new preset while configuring your own setup.
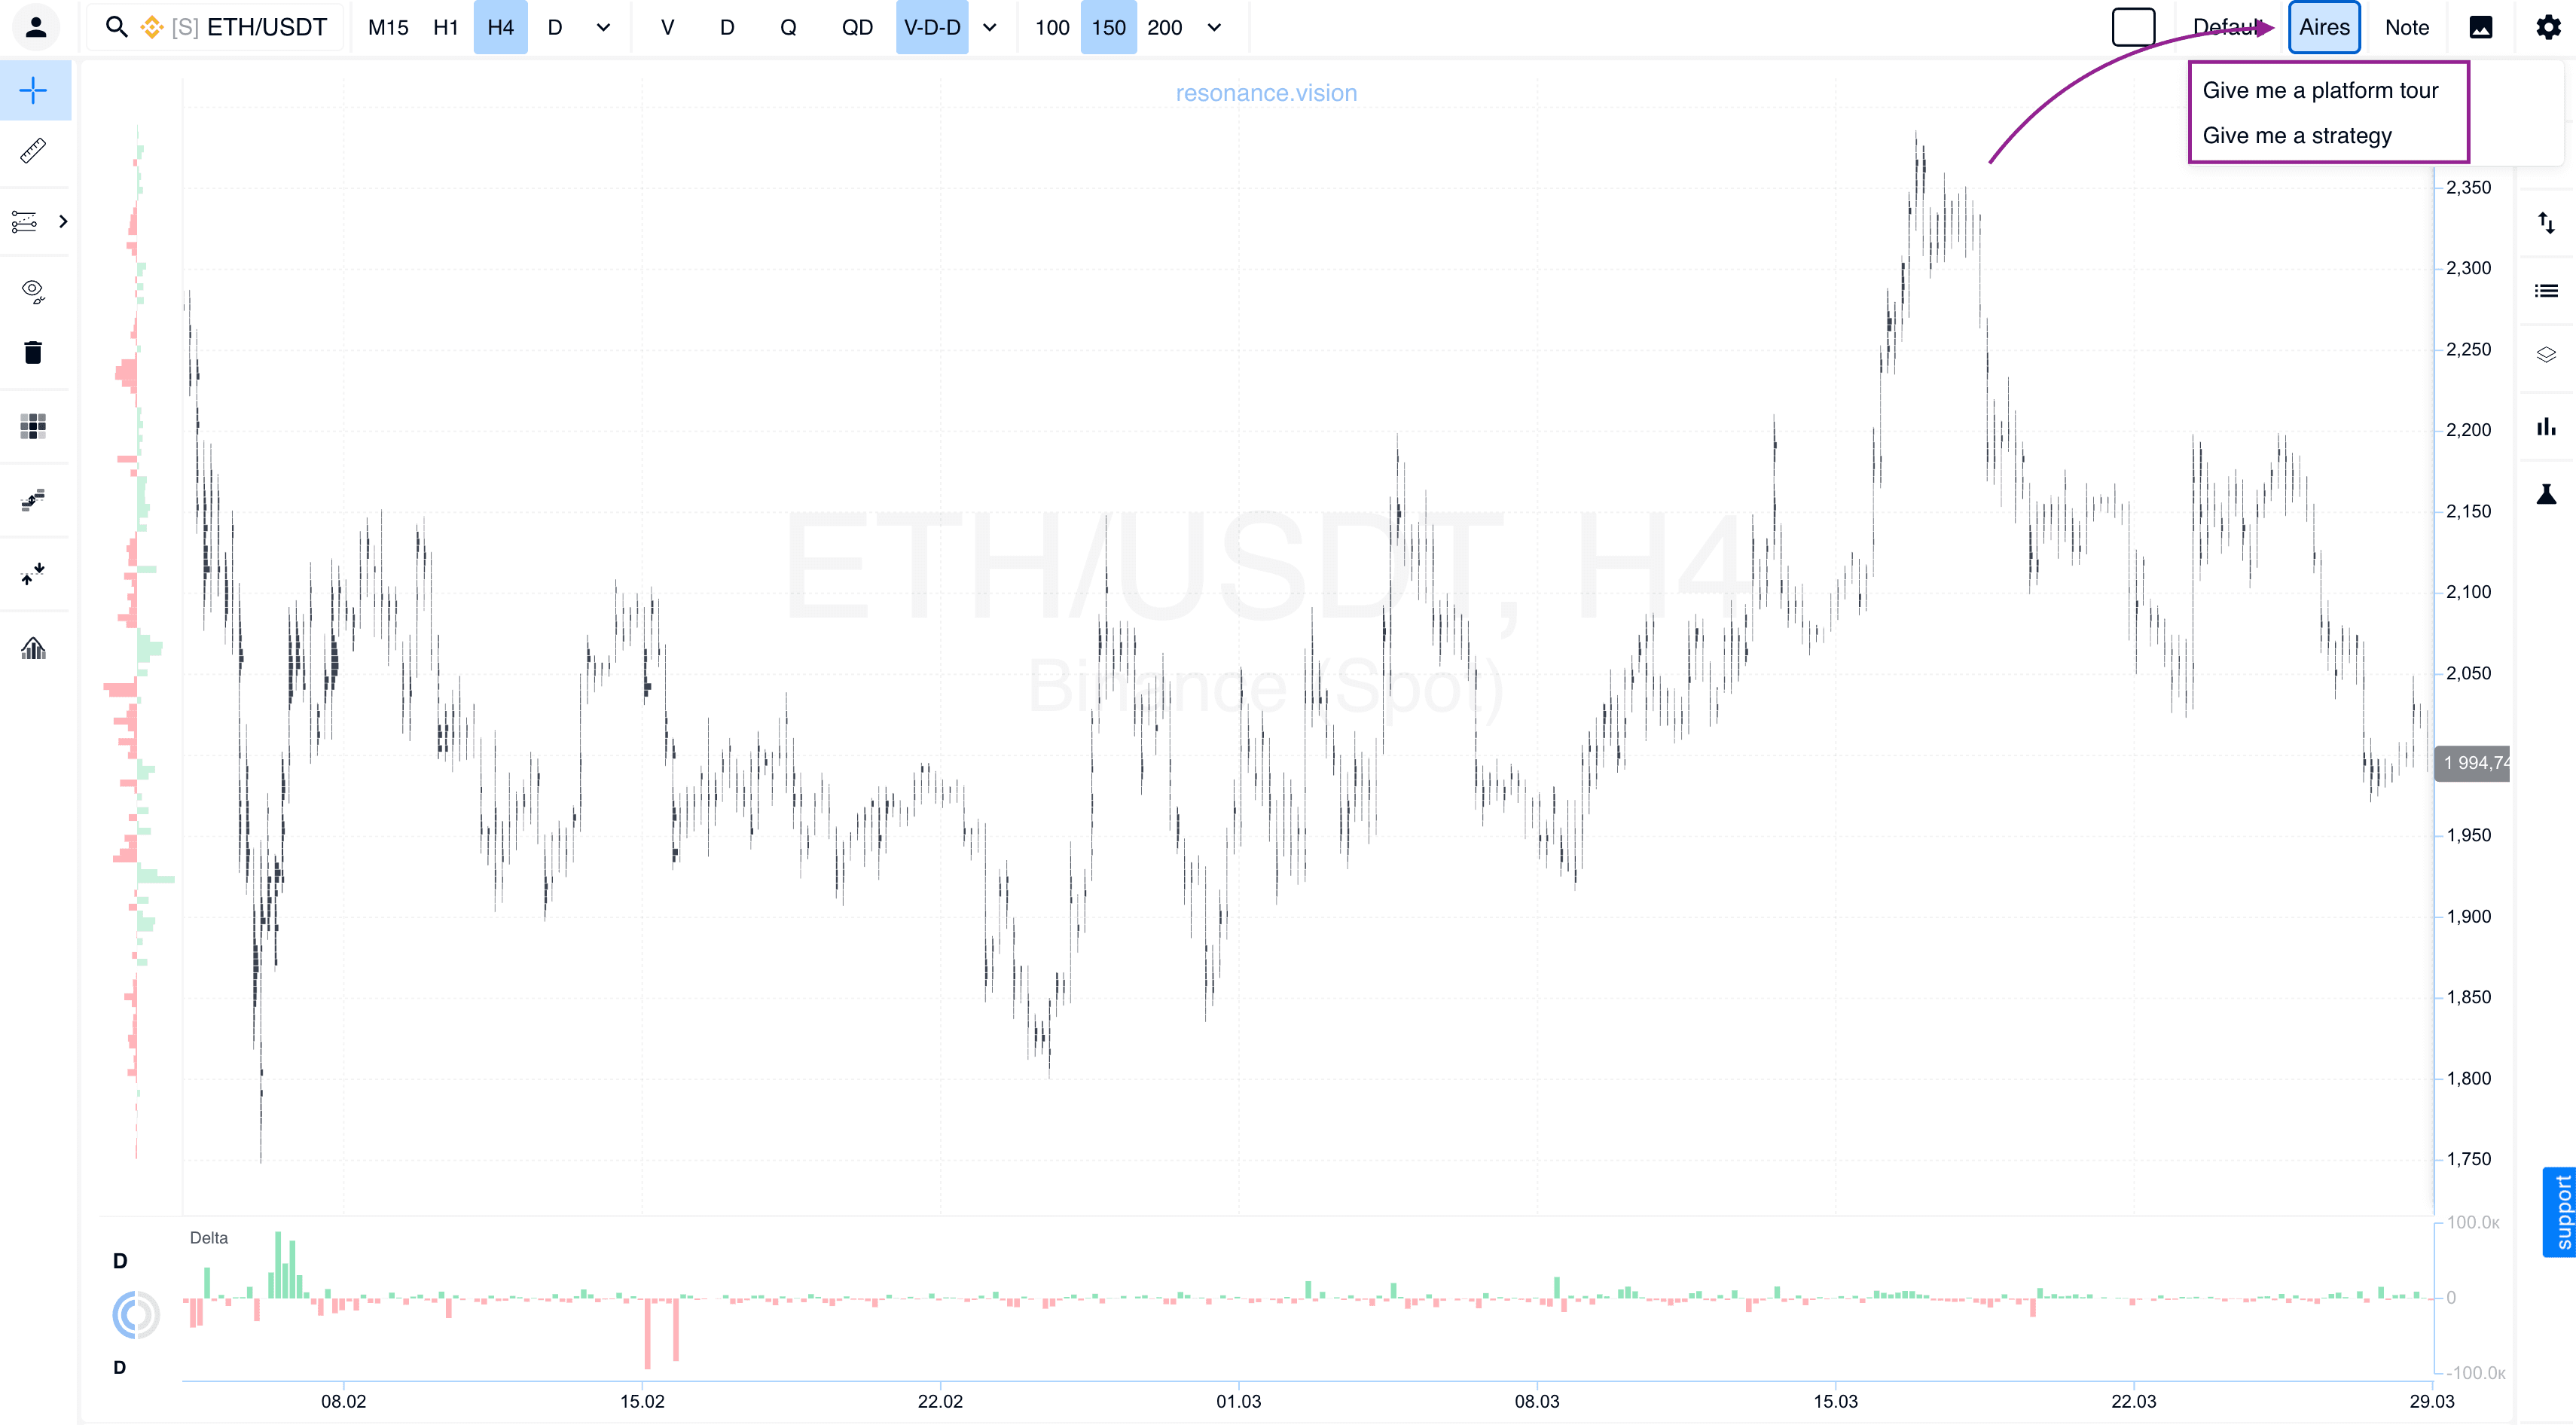
Aires: Tour and Training
Our AI assistant, Aires, has become even more functional. It can now guide you through a full introductory platform tour or suggest mini-training to help you understand market mechanics faster.
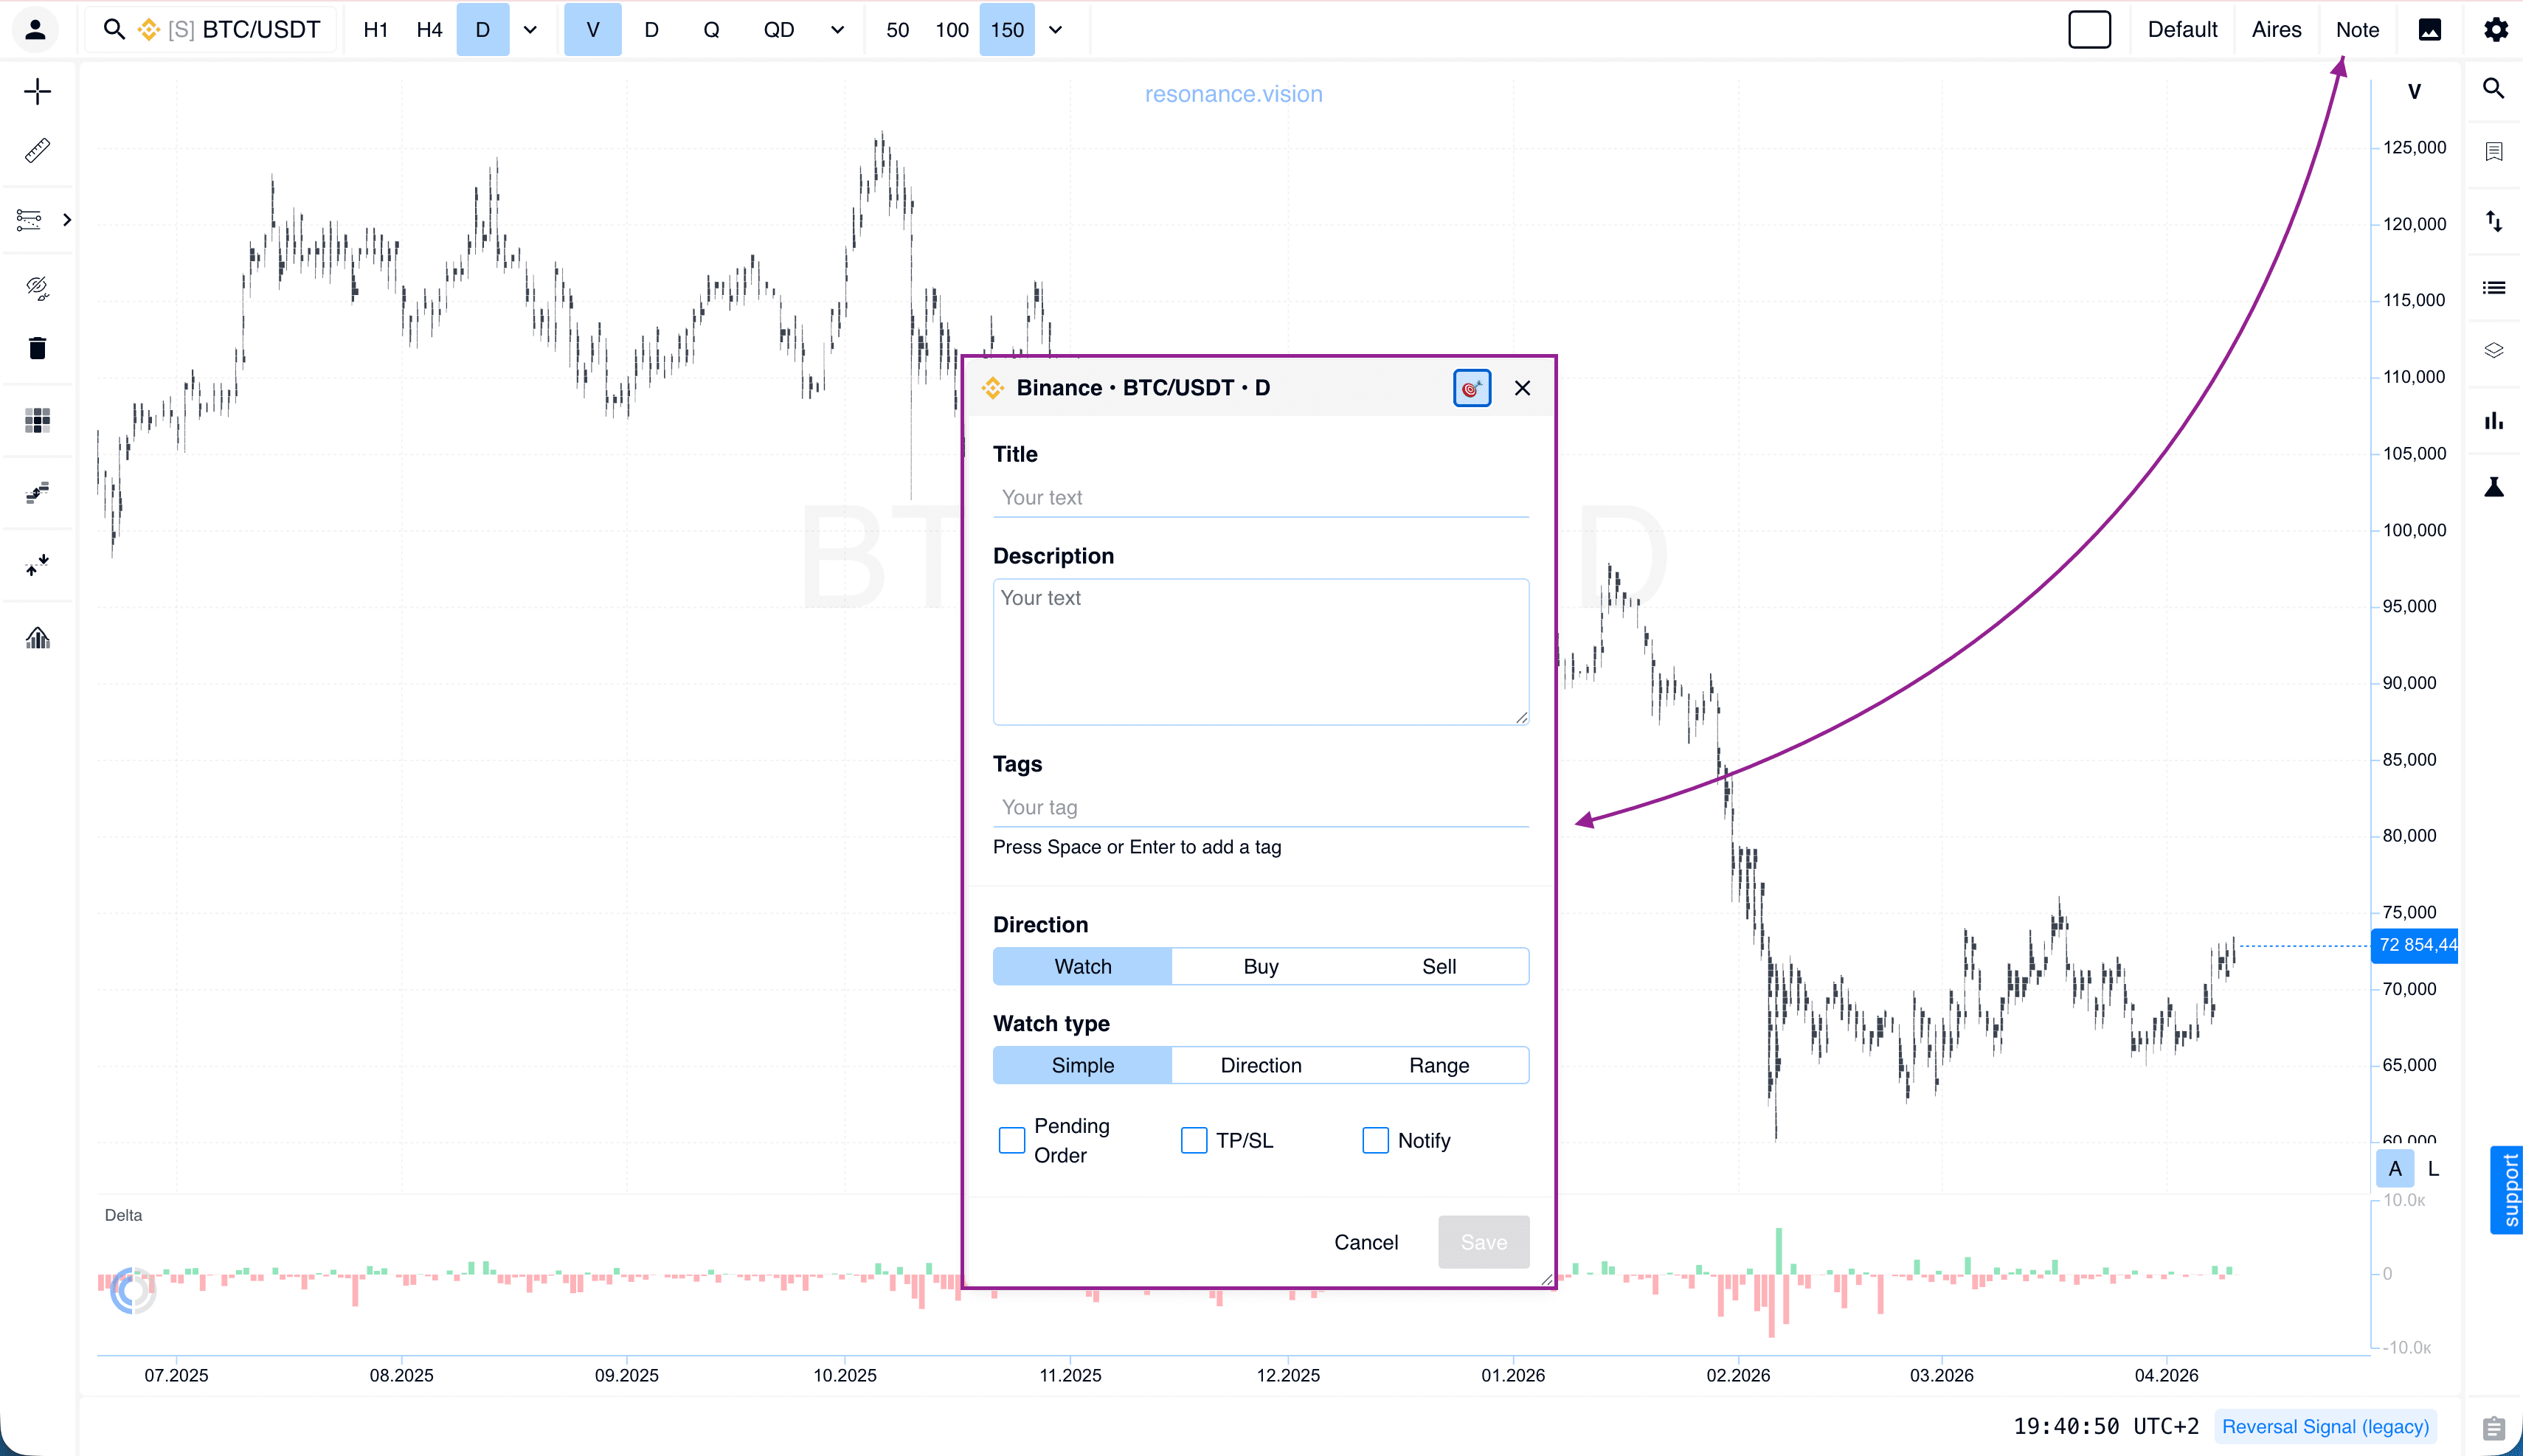
Notes
The Notes tool has become a full-featured trading journal. Each note can now have a name, description, tags, and trade direction. Most importantly, you can place a pending order with Take Profit and Stop Loss directly from a note, as well as set up notifications.
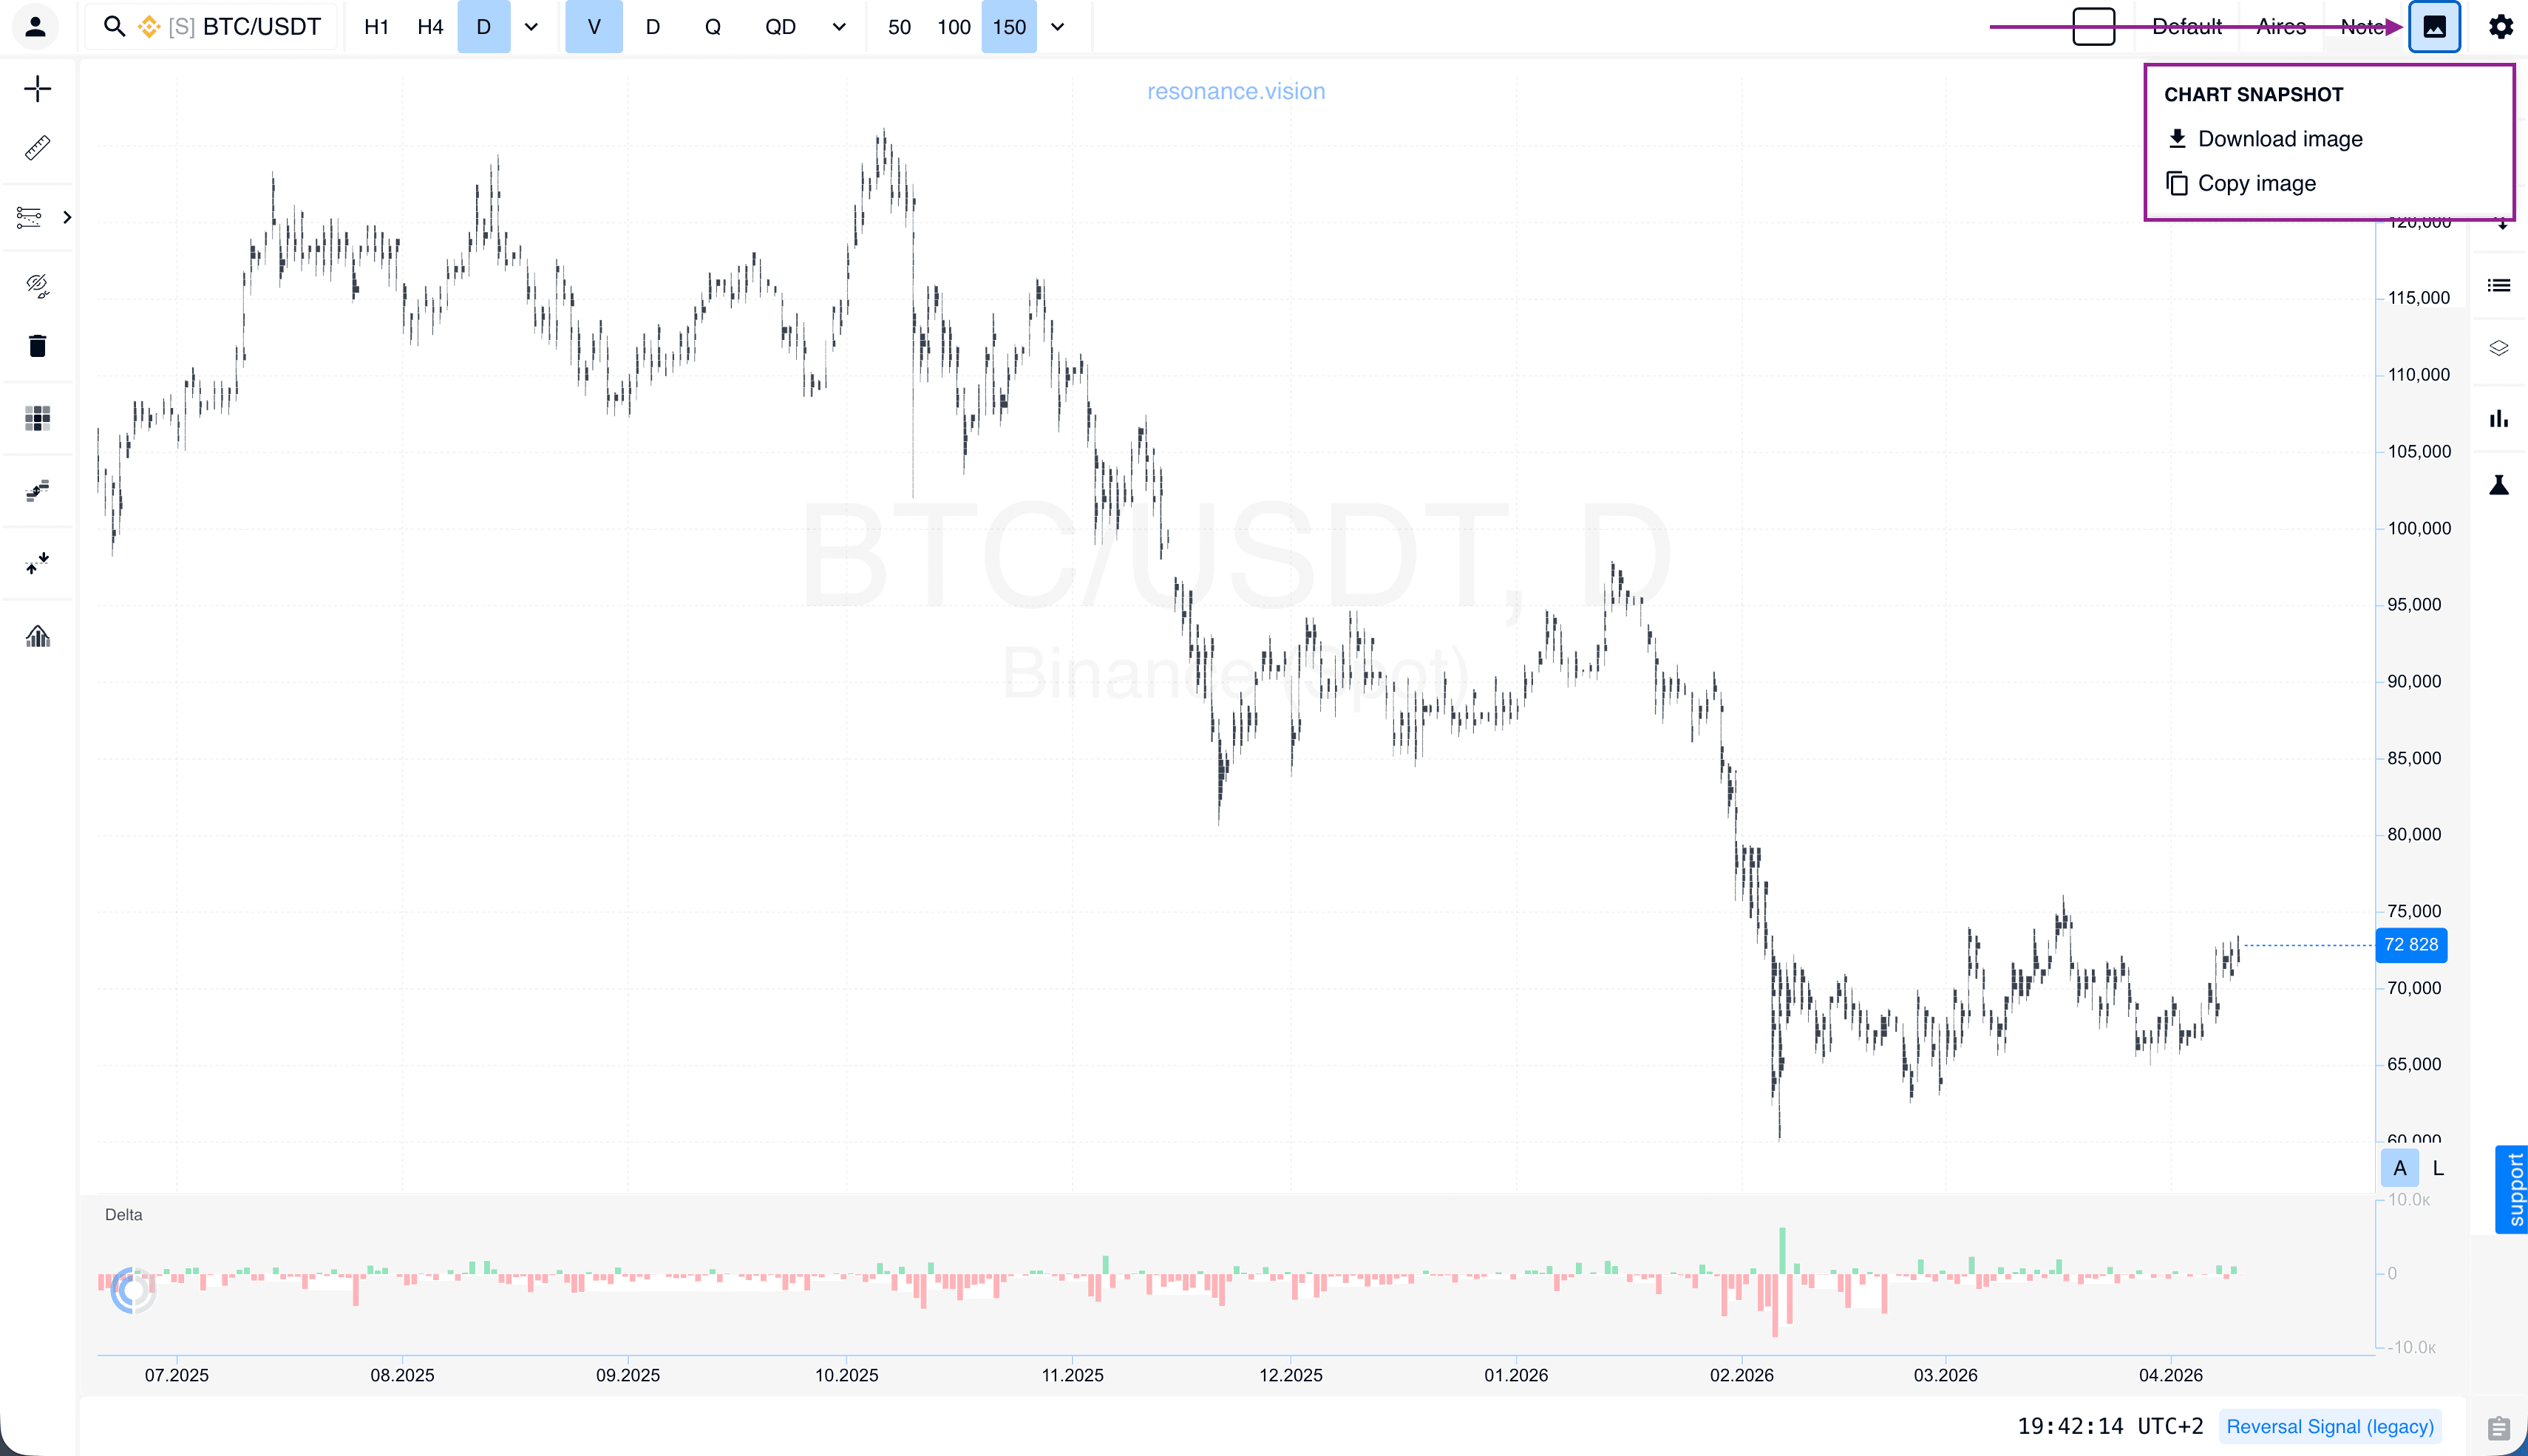
Screenshots and Sharing
Sharing your results is now easier: you can instantly create a chart screenshot or generate a direct link to it.
Favorites
The lower window now includes expanded ticker information, including the asset’s category classification.
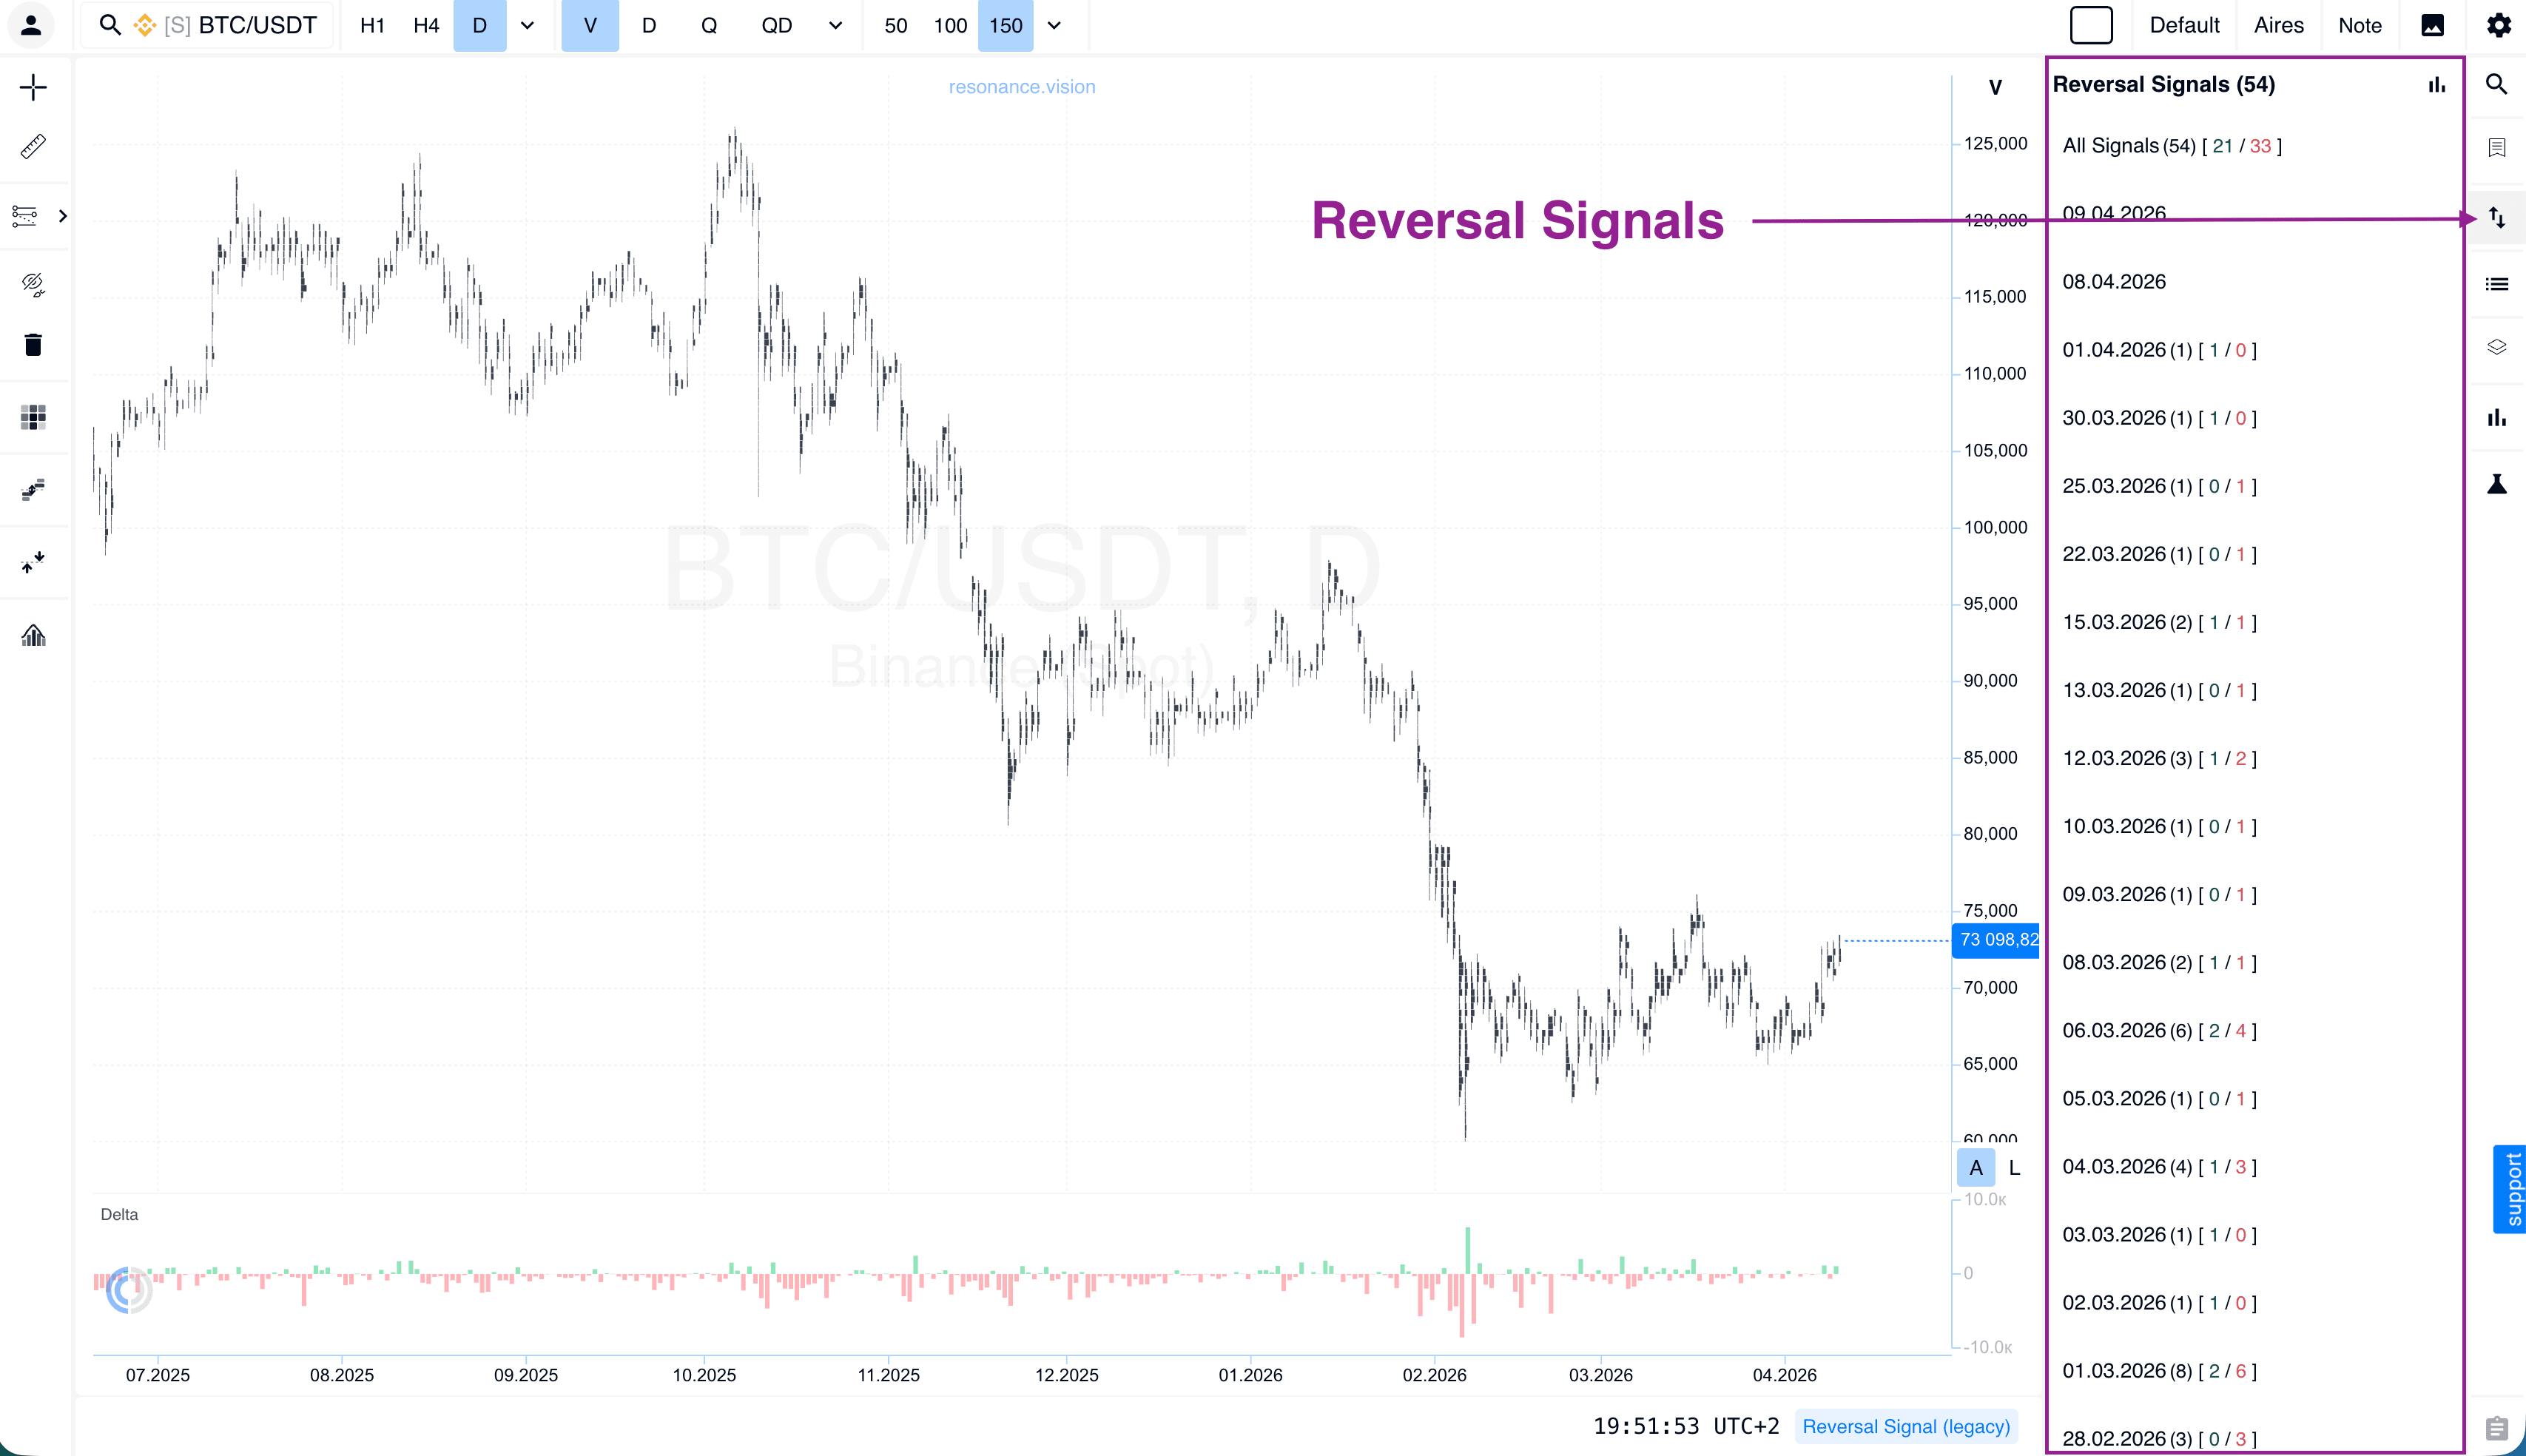
Reversal Signal
We have gathered the full list of signals in one place. You can now study their statistics directly here, without switching to other platform pages.
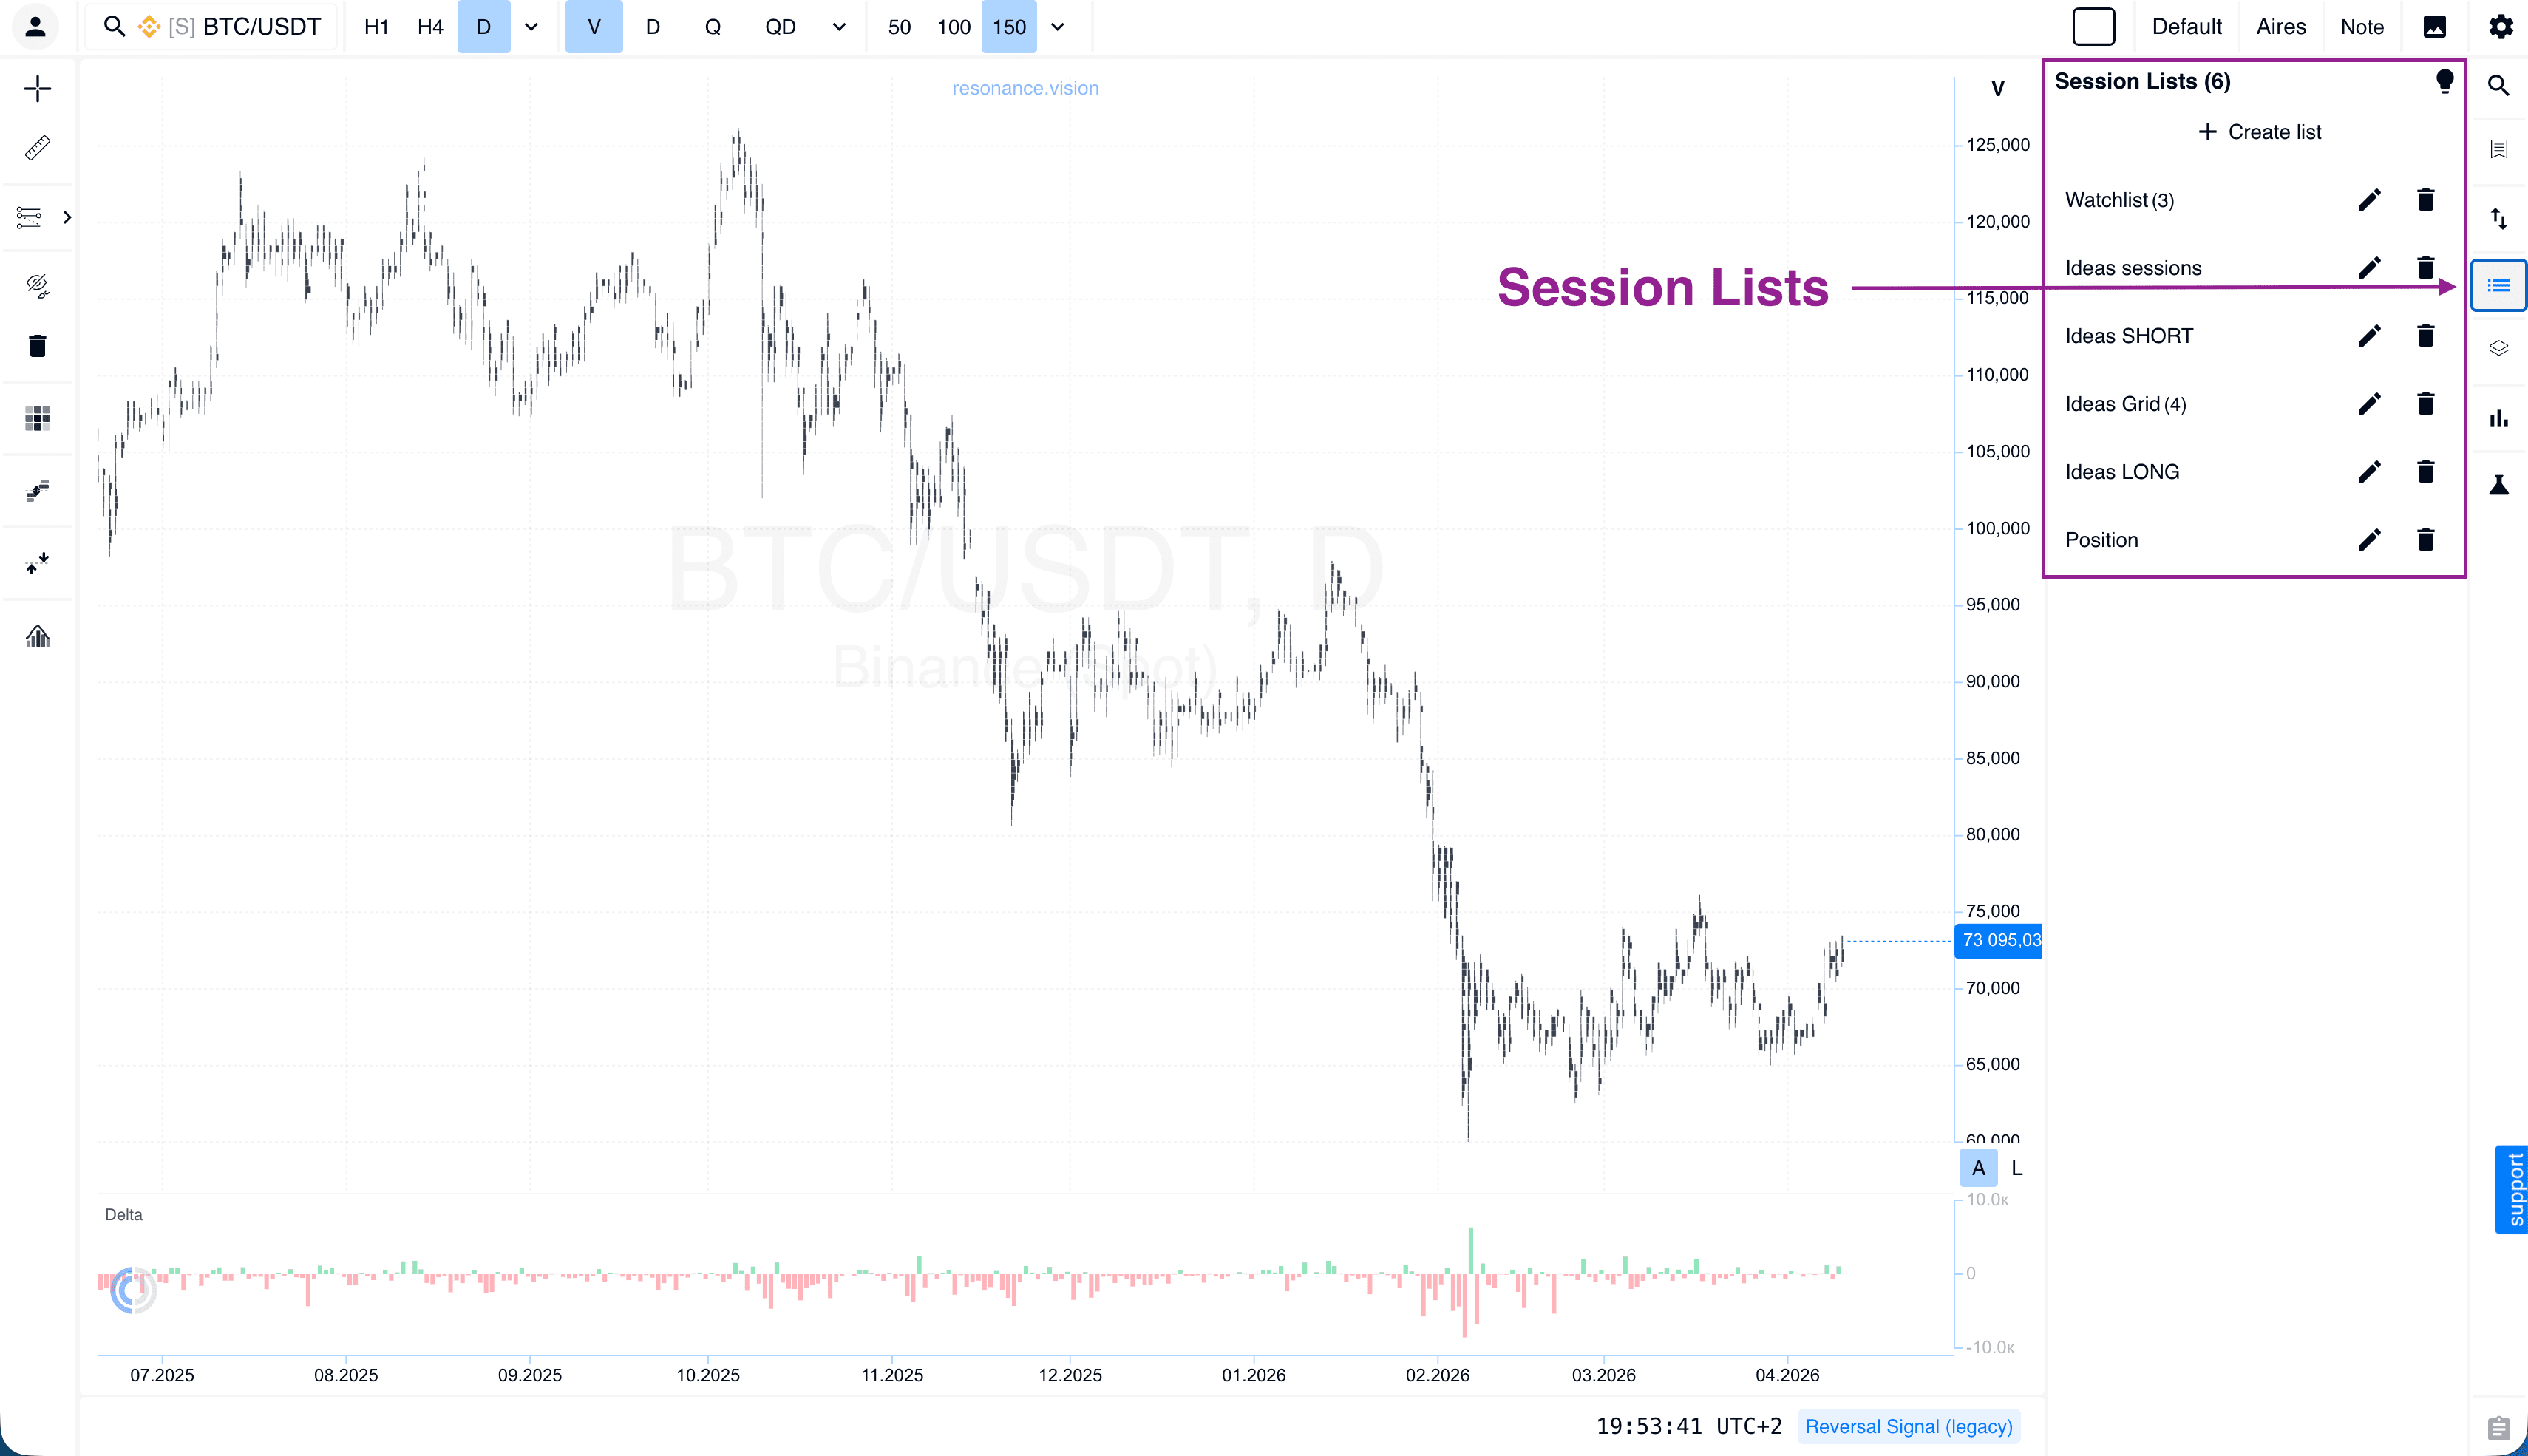
Session List
A simple and effective tool for working with your own strategies during specific trading sessions. A hint system has been added for beginners.
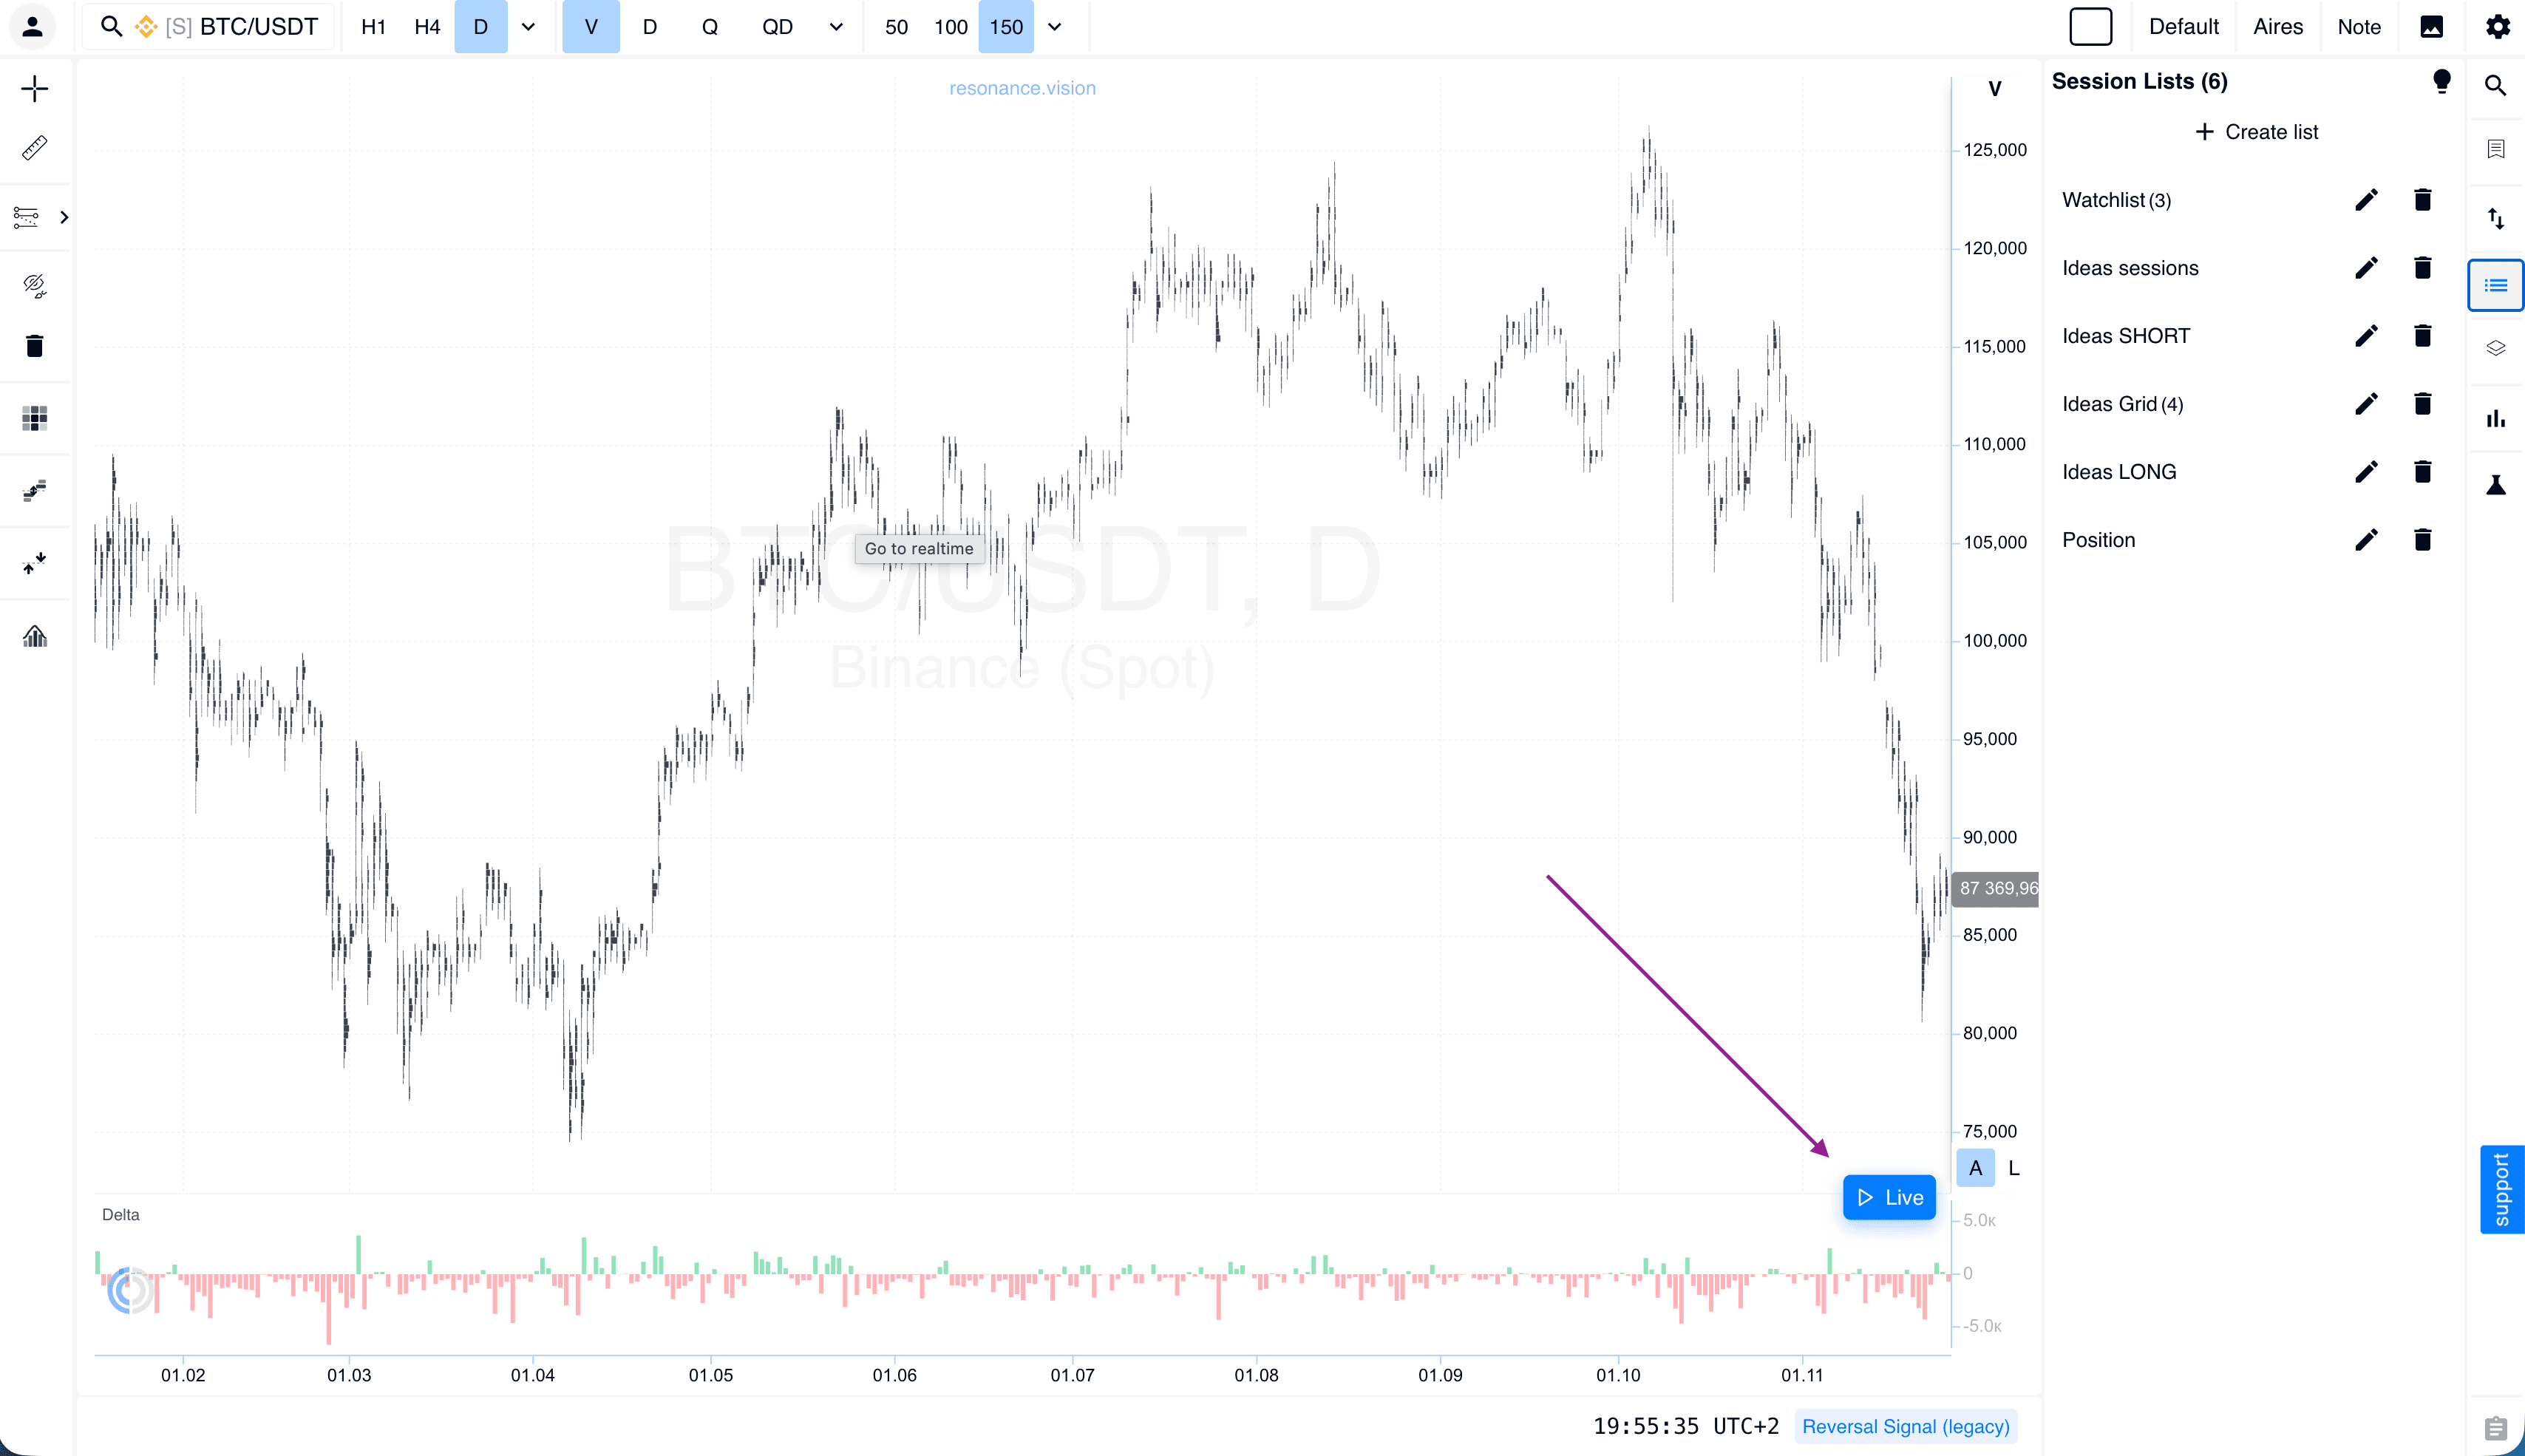
Live Mode
If you scroll far back into the chart history, a LIVE button will appear in the bottom-right corner when you hover over the chart. Click it to instantly return to real time.
Updated Mini-Training: A Fast Start in Market Mechanics
The platform’s toolkit has become more powerful. To help you use it at full capacity from day one, we have completely updated our mini-training. It is a focused guide with interactive tasks and simulator practice that helps you quickly understand supply and demand analysis.
What’s inside the updated course:
Focus on what matters: no fluff — only the foundation you need to understand volume, delta, and liquidity.
Platform integration: training takes place using the analytical tools of the Resonance platform. You immediately see how to apply theory on real cluster charts.
Practical tasks: reinforce your knowledge through a homework system that is now integrated into your personal progress on the platform.
Aires support: your AI assistant helps you navigate the materials and points out which aspects deserve your attention.
Flexibility and Accessibility
Individual Tool Purchases
We value an individual approach to trading, so we have implemented a system that allows you to purchase analytical tools separately. You no longer need to pay for a full feature package if you only use specific analysis tools. Choose and combine only the tools that are truly necessary for your strategy.
$7 Test Package
This package is for those who want to personally test the quality of the updates and try the functionality in real time. For just $7, you get full access to the platform, so you can feel the difference and evaluate all the benefits of the updated cluster chart today.
Summary: A Platform That Works for You
This update reflects our commitment to making professional trading more accessible and easier to understand. We have simplified the platform visually, strengthened its analytical capabilities, and made the interface more convenient so you can focus on what matters most: making well-grounded trading decisions.
Remember:
Everything is close at hand: use Favorites for quick and convenient access to data with your own settings.
Experiment safely: our simulator and $7 test package are designed specifically for a low-risk start.
Hints are everywhere: simply hover over any element if you have questions about how to use it. Each tool also has a step-by-step tour with detailed explanations.
We believe that trading should be technological, but also intuitive and supported by effective analytical tools for analyzing supply and demand in the cryptocurrency market. Go to the platform, open the charts, and experience a new level of analysis and comfort.
Follow new insights in our telegram channel.
No need to invent complex schemes and look for the "grail". Use the Resonance platform tools.
Register via the link — get a bonus and start earning:
OKX | BingX | KuCoin.
Promo code TOPBLOG gives you a 10% discount on any Resonance tariff plan.
Recommended articles


