How Trading Simulator Works
Trading Simulator is an educational Resonance tool for practising trading decisions, developing trading skills and analysing simulation results.
Table of contents
What Is Trading Simulator?
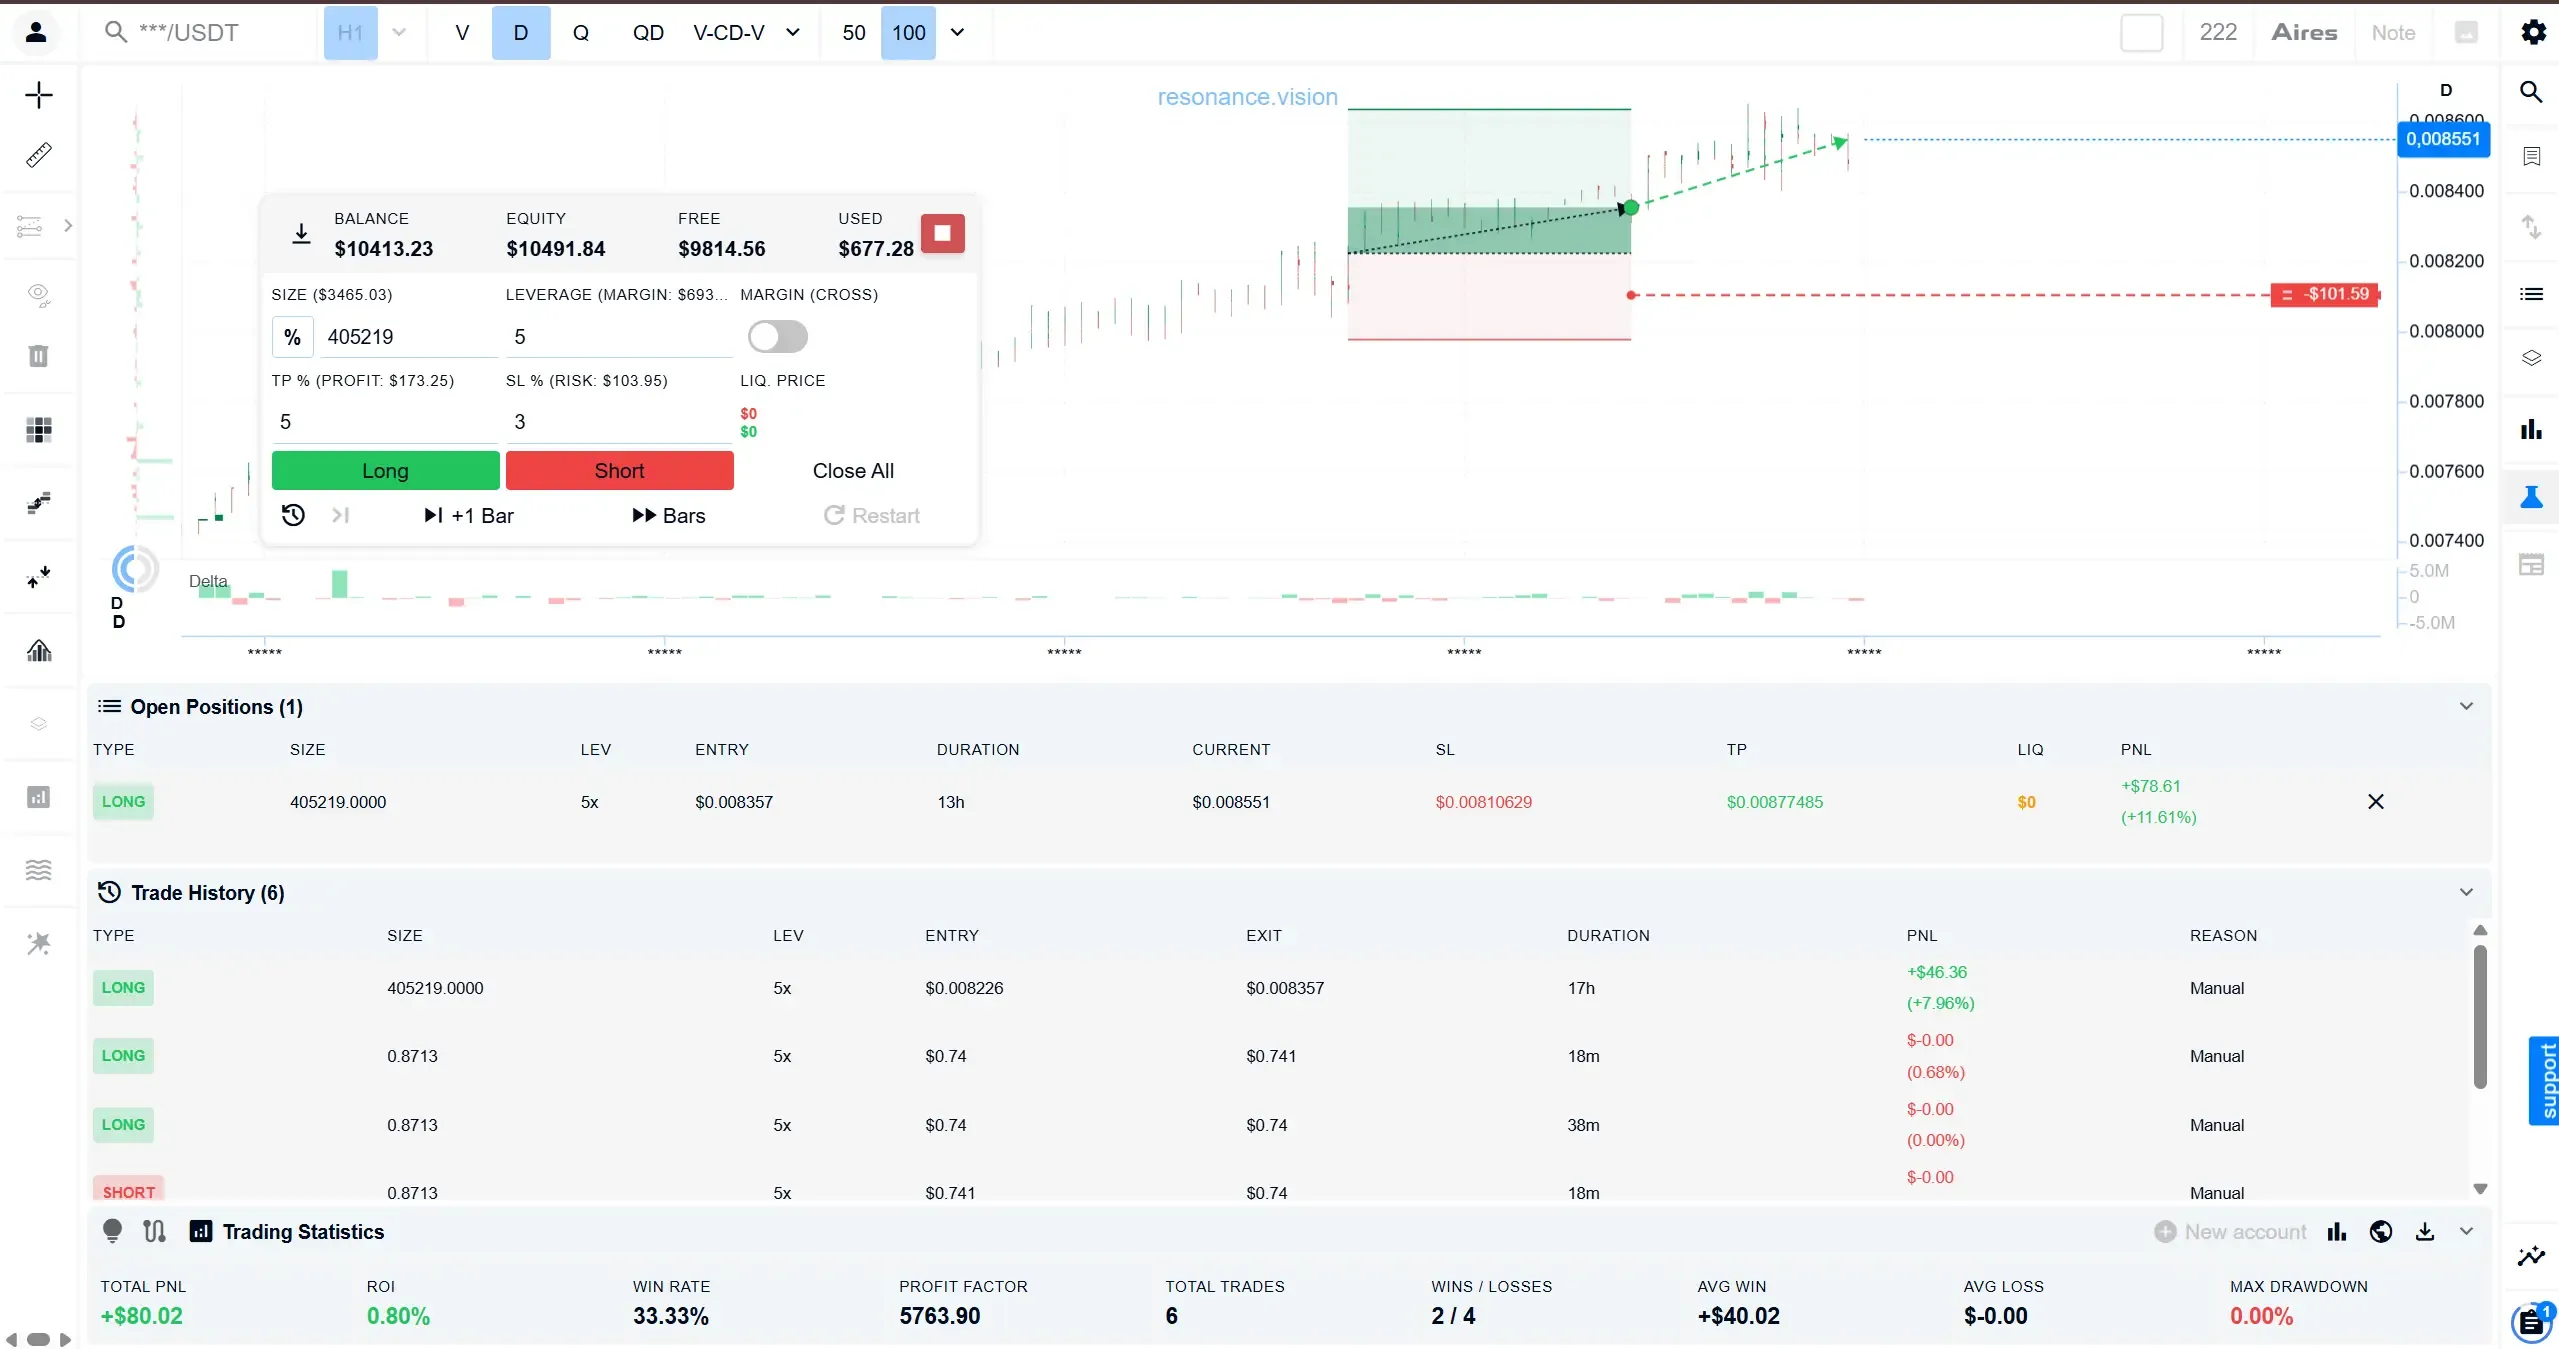
Trading Simulator is a tool within the Resonance platform that lets users practise making trading decisions using real historical cryptocurrency market data, without using real money. Instead of a real balance, the user works with a virtual account (balance, equity, free and used funds are displayed in the same way as on a real trading panel), while instead of the asset’s live market price, Simulator uses a historical chart and presents it as if the market were unfolding right now.
The key difference between Simulator and simply viewing a historical chart is that the future part of the price movement is not shown in advance. When you look at a historical chart of any asset, you can see the entire history at once: what happened before and what happened next. In Simulator, the chart displays only the cluster bars up to the current point in the simulation. Anything that has not yet “happened” simply does not appear on the chart. The trader must decide whether to go Long or Short before knowing where the price will move next. This turns historical chart review into practice that more closely resembles real-world trading decision-making.
What Types of Training Are Available in Simulator?
Training in Simulator is divided into two fundamentally different categories.
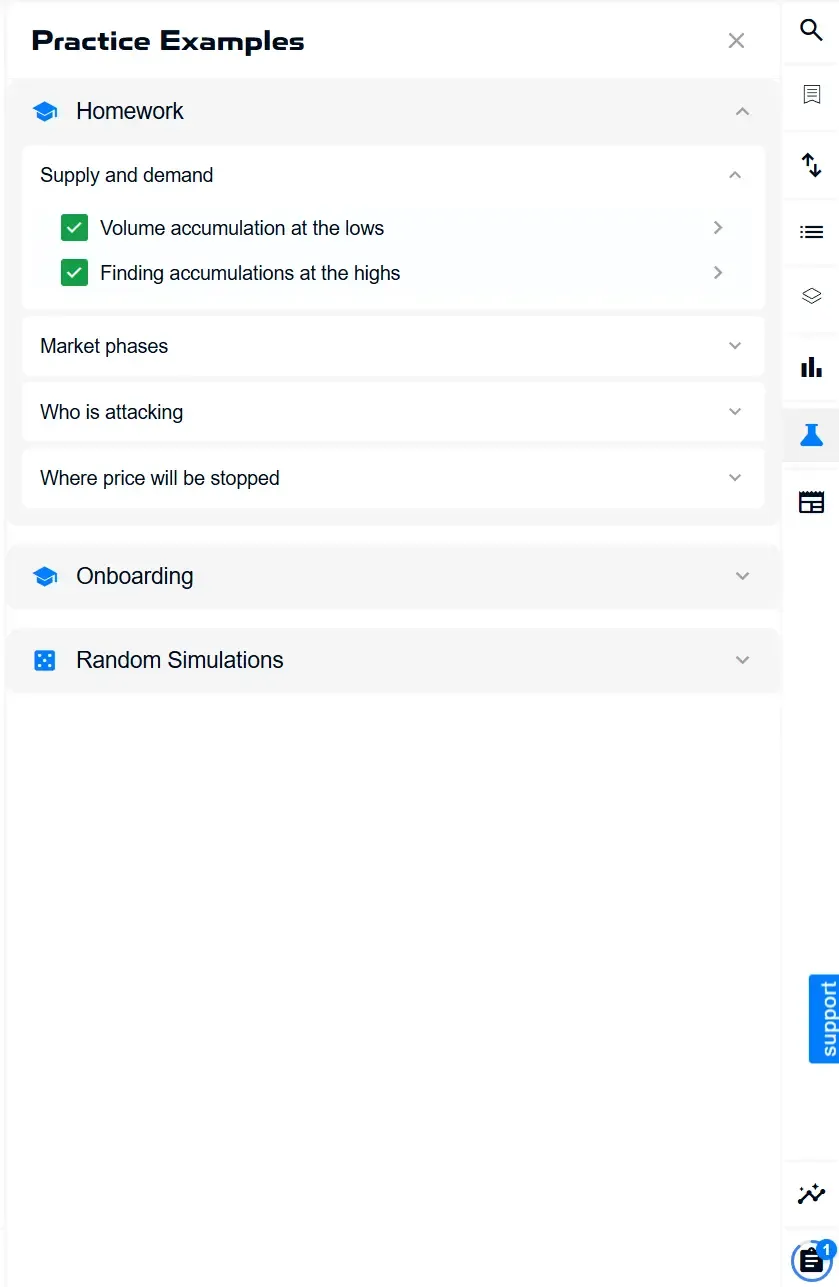
The first is guided learning. This includes onboarding — short introductory scenarios that introduce users to the product logic — and homework assignments: sets of examples grouped by topics such as “Supply and Demand”, “Market Phases”, “Who Is Attacking?” and “Where Will the Price Be Stopped?”. Each assignment has a specific learning objective, an explanation and feedback. Completed assignments are marked with a tick.
The second category is Random Simulations. Unlike Mini-Learning homework assignments, there is no pre-prepared “correct answer”. The platform selects a random historical segment for a randomly selected asset. The user then makes trading decisions independently, based solely on their own analysis.
Put simply, a guided scenario is an assignment with feedback, while a random simulation is independent practice in conditions closer to real trading. Random simulations within Simulator are also divided into Classic and Aires, but this is covered separately in Classic and Aires in Trading Simulator: What’s the Difference?
How Does Simulator Hide the Future?
Technically, the hidden-future mechanism works by gradually revealing chart bars. The “+1 Bar” button adds exactly one new cluster bar to the right, while “▶▶ Bars” automatically reveals several subsequent bars in sequence. There is no hidden or masked future data on the chart: bars that have not yet occurred within the logic of the simulation are simply absent from the screen until the user progresses further.
The main idea is simple: at any given point, the user works only with the information that would have been available at that moment under real market conditions. This is the fundamental difference between training in Simulator and simply reviewing a chart with the benefit of hindsight.
What Can You Do During a Simulation?
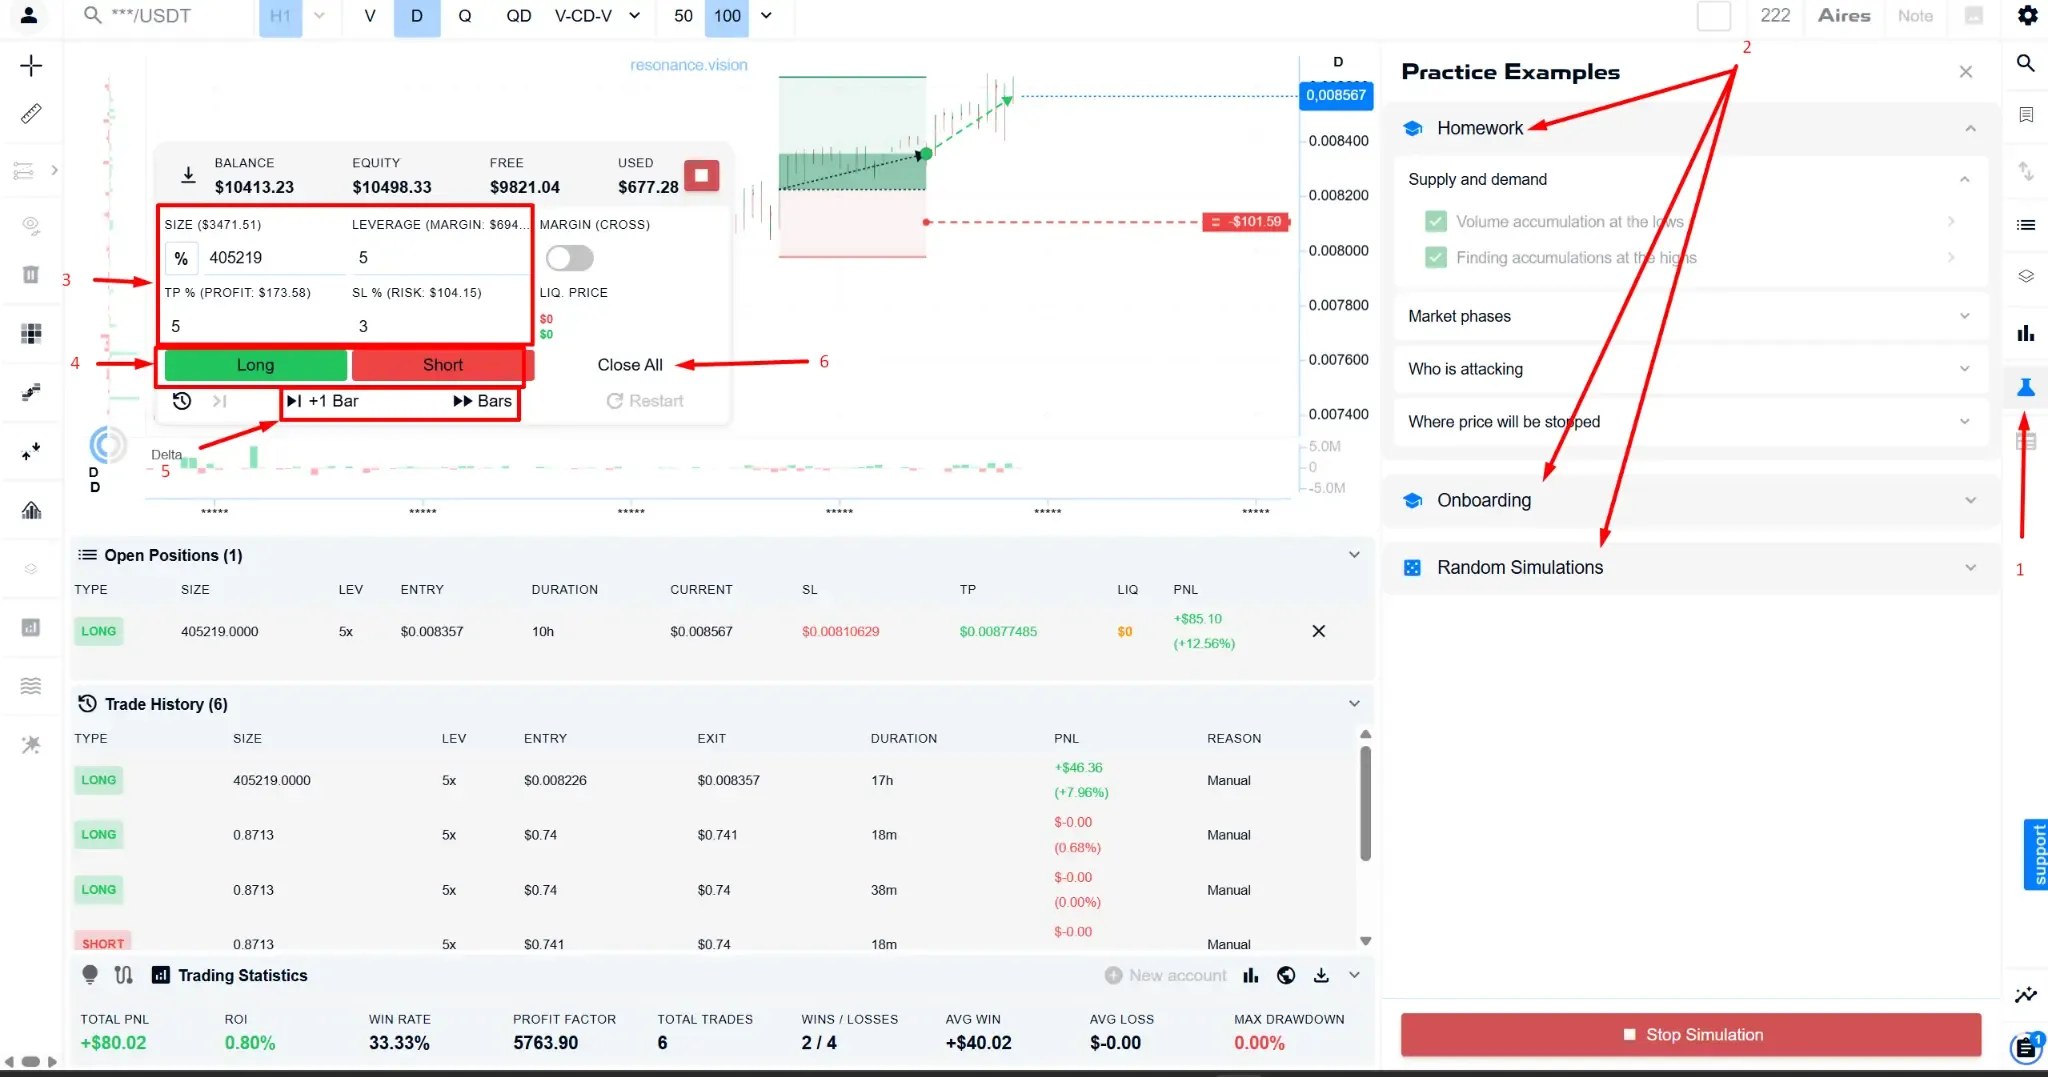
During a simulation, users can perform the following core trading actions:
- open a Long or Short position;
- set the position size, either as a percentage of the balance or manually;
- select leverage, with the corresponding margin immediately recalculated in dollars;
- set Take Profit and Stop Loss as percentages — the corresponding price levels are automatically calculated in dollars and displayed directly on the chart as horizontal lines relative to the entry point;
- see the estimated liquidation price for the current position parameters;
- monitor an open position as the simulation progresses, including holding time, the current simulated price and PnL, which updates as the simulation advances;
- close an individual position manually or close all positions at once.
If the price reaches the TP or SL level on the chart, the position is closed automatically. A notification then appears on the screen — for example, “Stop Loss triggered. Loss: –$100.00” — showing the result of the trade, while the account balance is updated immediately.
What Happens After a Trade?
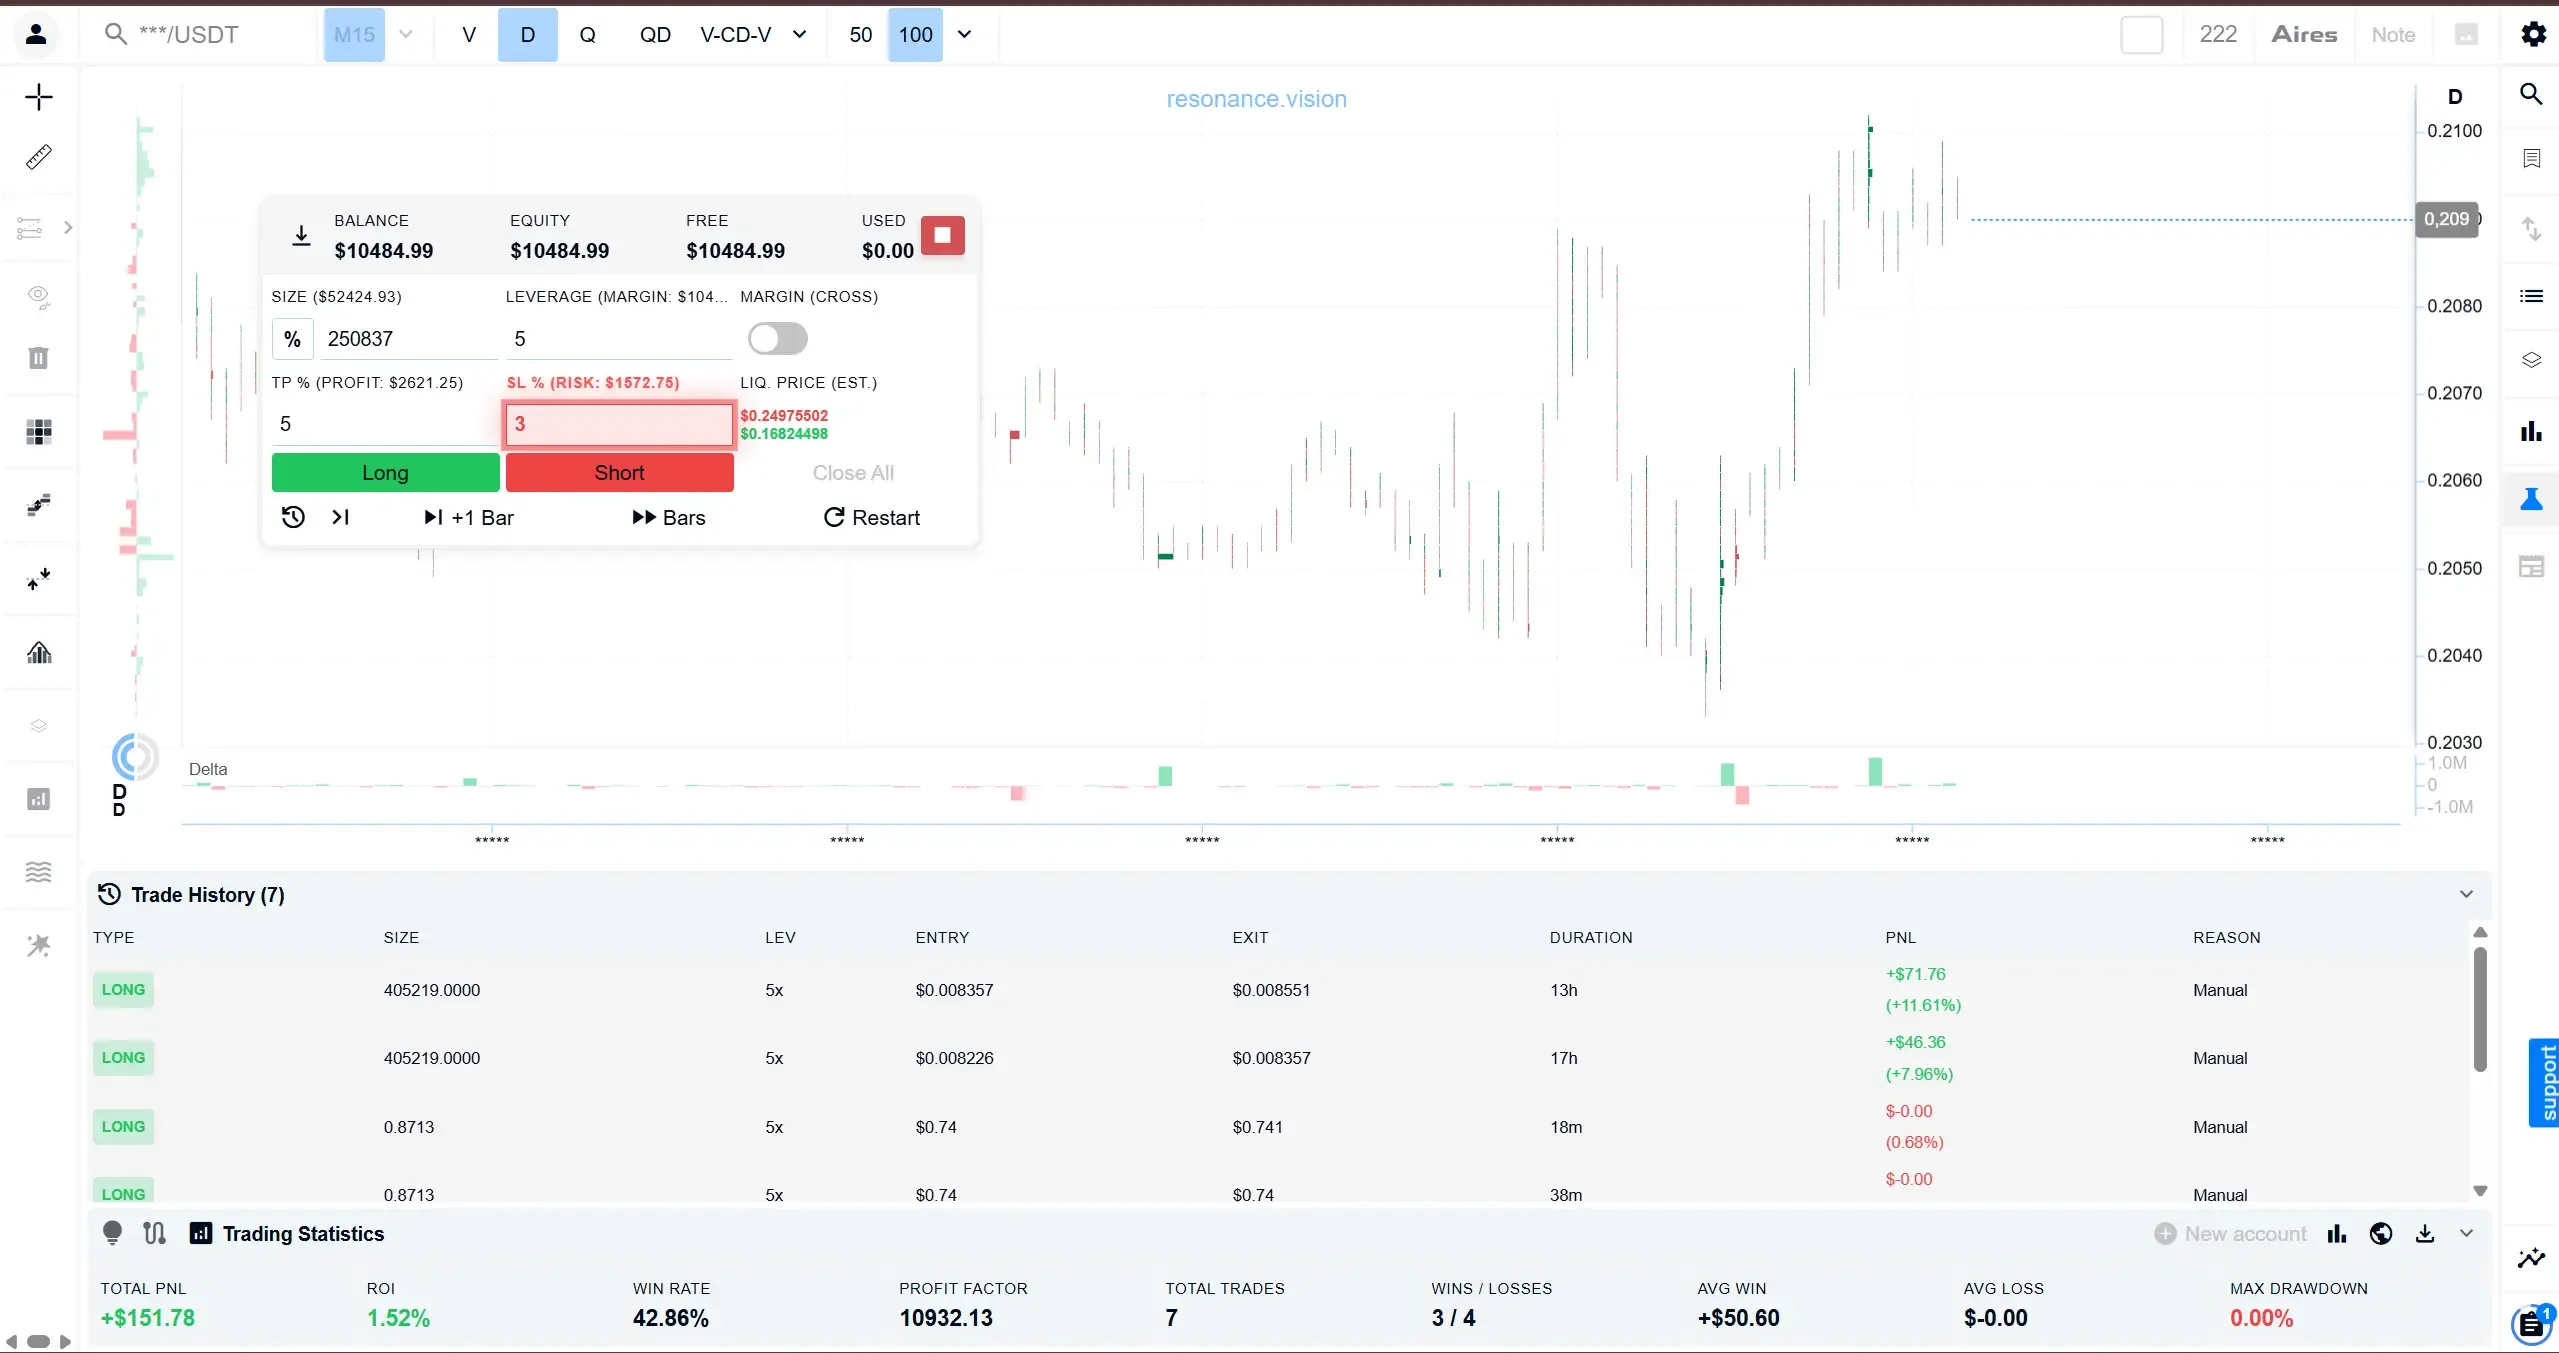
Every closed trade is added to the trade history. It includes the position type (Long/Short), size, leverage, entry and exit prices, holding time, result in dollars and percentages, and the reason for closing, such as “Manual” or an SL/TP trigger.
At the same time, trading statistics are accumulated for the current trading session, including total PnL, ROI, Win Rate, Profit Factor, total number of trades, the ratio of profitable to losing trades, average profit, average loss and maximum drawdown. Together, these metrics make it possible to evaluate not only an individual trade but also the results of trading decisions throughout the entire simulation. For a detailed explanation of each metric, see How to Read Trading Simulator Statistics.

What Analytical Tools Are Available?
The level of analytics available in Simulator is not the same for every user or every type of simulation. It depends both on the subscription plan and on the training mode. Detailed comparisons are available in Simulator and Simulator PRO: What’s the Difference? and Classic and Aires in Trading Simulator: What’s the Difference?, which explain the differences in access in more detail.
What Does Simulator Not Replicate?
Trading Simulator is a training environment built on real historical market data, not a full emulation of an exchange matching engine. It does not guarantee an exact reproduction of real-world slippage, does not display an exchange order book, and does not emulate every detail of order execution as it occurs on a real exchange during live trading.
Simulator is designed for practising decision-making while future price movements remain hidden. However, its results should not be treated as an exact prediction of how the same trade would have played out on a real exchange with real market liquidity.
How to Get Started
- Open the Simulator section using the flask icon on the right-hand panel of the cluster chart.
- Choose a training type: a homework assignment, onboarding or a random simulation.
- Set the position size and leverage and, if needed, TP and SL. The corresponding levels will appear on the chart immediately.
- Open a Long or Short position.
- Move the simulation forwards bar by bar using “+1 Bar” or “▶▶ Bars” and observe how the market situation develops.
- Close the position — or wait for TP or SL to trigger automatically — and review the result in the trade history and trading statistics.
Follow new insights in our Telegram channel.
There is no need to invent complex schemes or look for the “grail”. Use the Resonance platform tools for market analysis and trading practice.
Trading Simulator is a tool for practising trading decisions and analysing simulation results in a simulated trading environment.
Register via the link and explore the Resonance platform:
OKX | BingX | KuCoin.
Promo code TOPBLOG gives you a 10% discount on any Resonance tariff plan.
Recommended articles