Which Charts and Indicators to Use in Crypto Trading

Why don’t popular indicators bring consistent profits? In this article, we break down the main myths and explain why classic indicators tend to lag. This material is for those ready to move beyond “all-in signals” and toward a trading system that actually works.
Table of contents
- 01Do Indicators Really Work?
- 02What Are Charts in Crypto Trading and Why Are They Not All Equal?
- 03Why Beginners Obsess Over Indicators
- 04Why Indicators Don't Work
- 05What About Trading Bots?
- 06Is the "Naked" Chart a Solution?
- 07What Actually Works?
- 08How Not to Drown in Indicators
- 09Conclusion
- 10What’s Next?

Do Indicators Really Work?
Maybe this situation sounds familiar. You see yet another ad for a channel promising professional crypto trading or analysis. You click the link and find yourself in a world of bold claims: "+250% from one trade" "$1,000 in a week", "One trade = 200% profit". All of it backed by green screenshots, mysterious chart lines, and secret indicators promising easy money.
But… after just a few weeks, your deposit noticeably shrinks thanks to this magic indicator. And you start looking for other approaches. It’s a vicious cycle.
You’re here? Welcome — that alone is the first step toward understanding the real mechanics of the market. What follows is honest, sometimes painful, but to the point.
What Are Charts in Crypto Trading and Why Are They Not All Equal?
Every chart has two axes: horizontal — time, vertical — price. Sounds simple, but there are many ways to visualize them.
The simplest charts for crypto trading are tick or line charts.
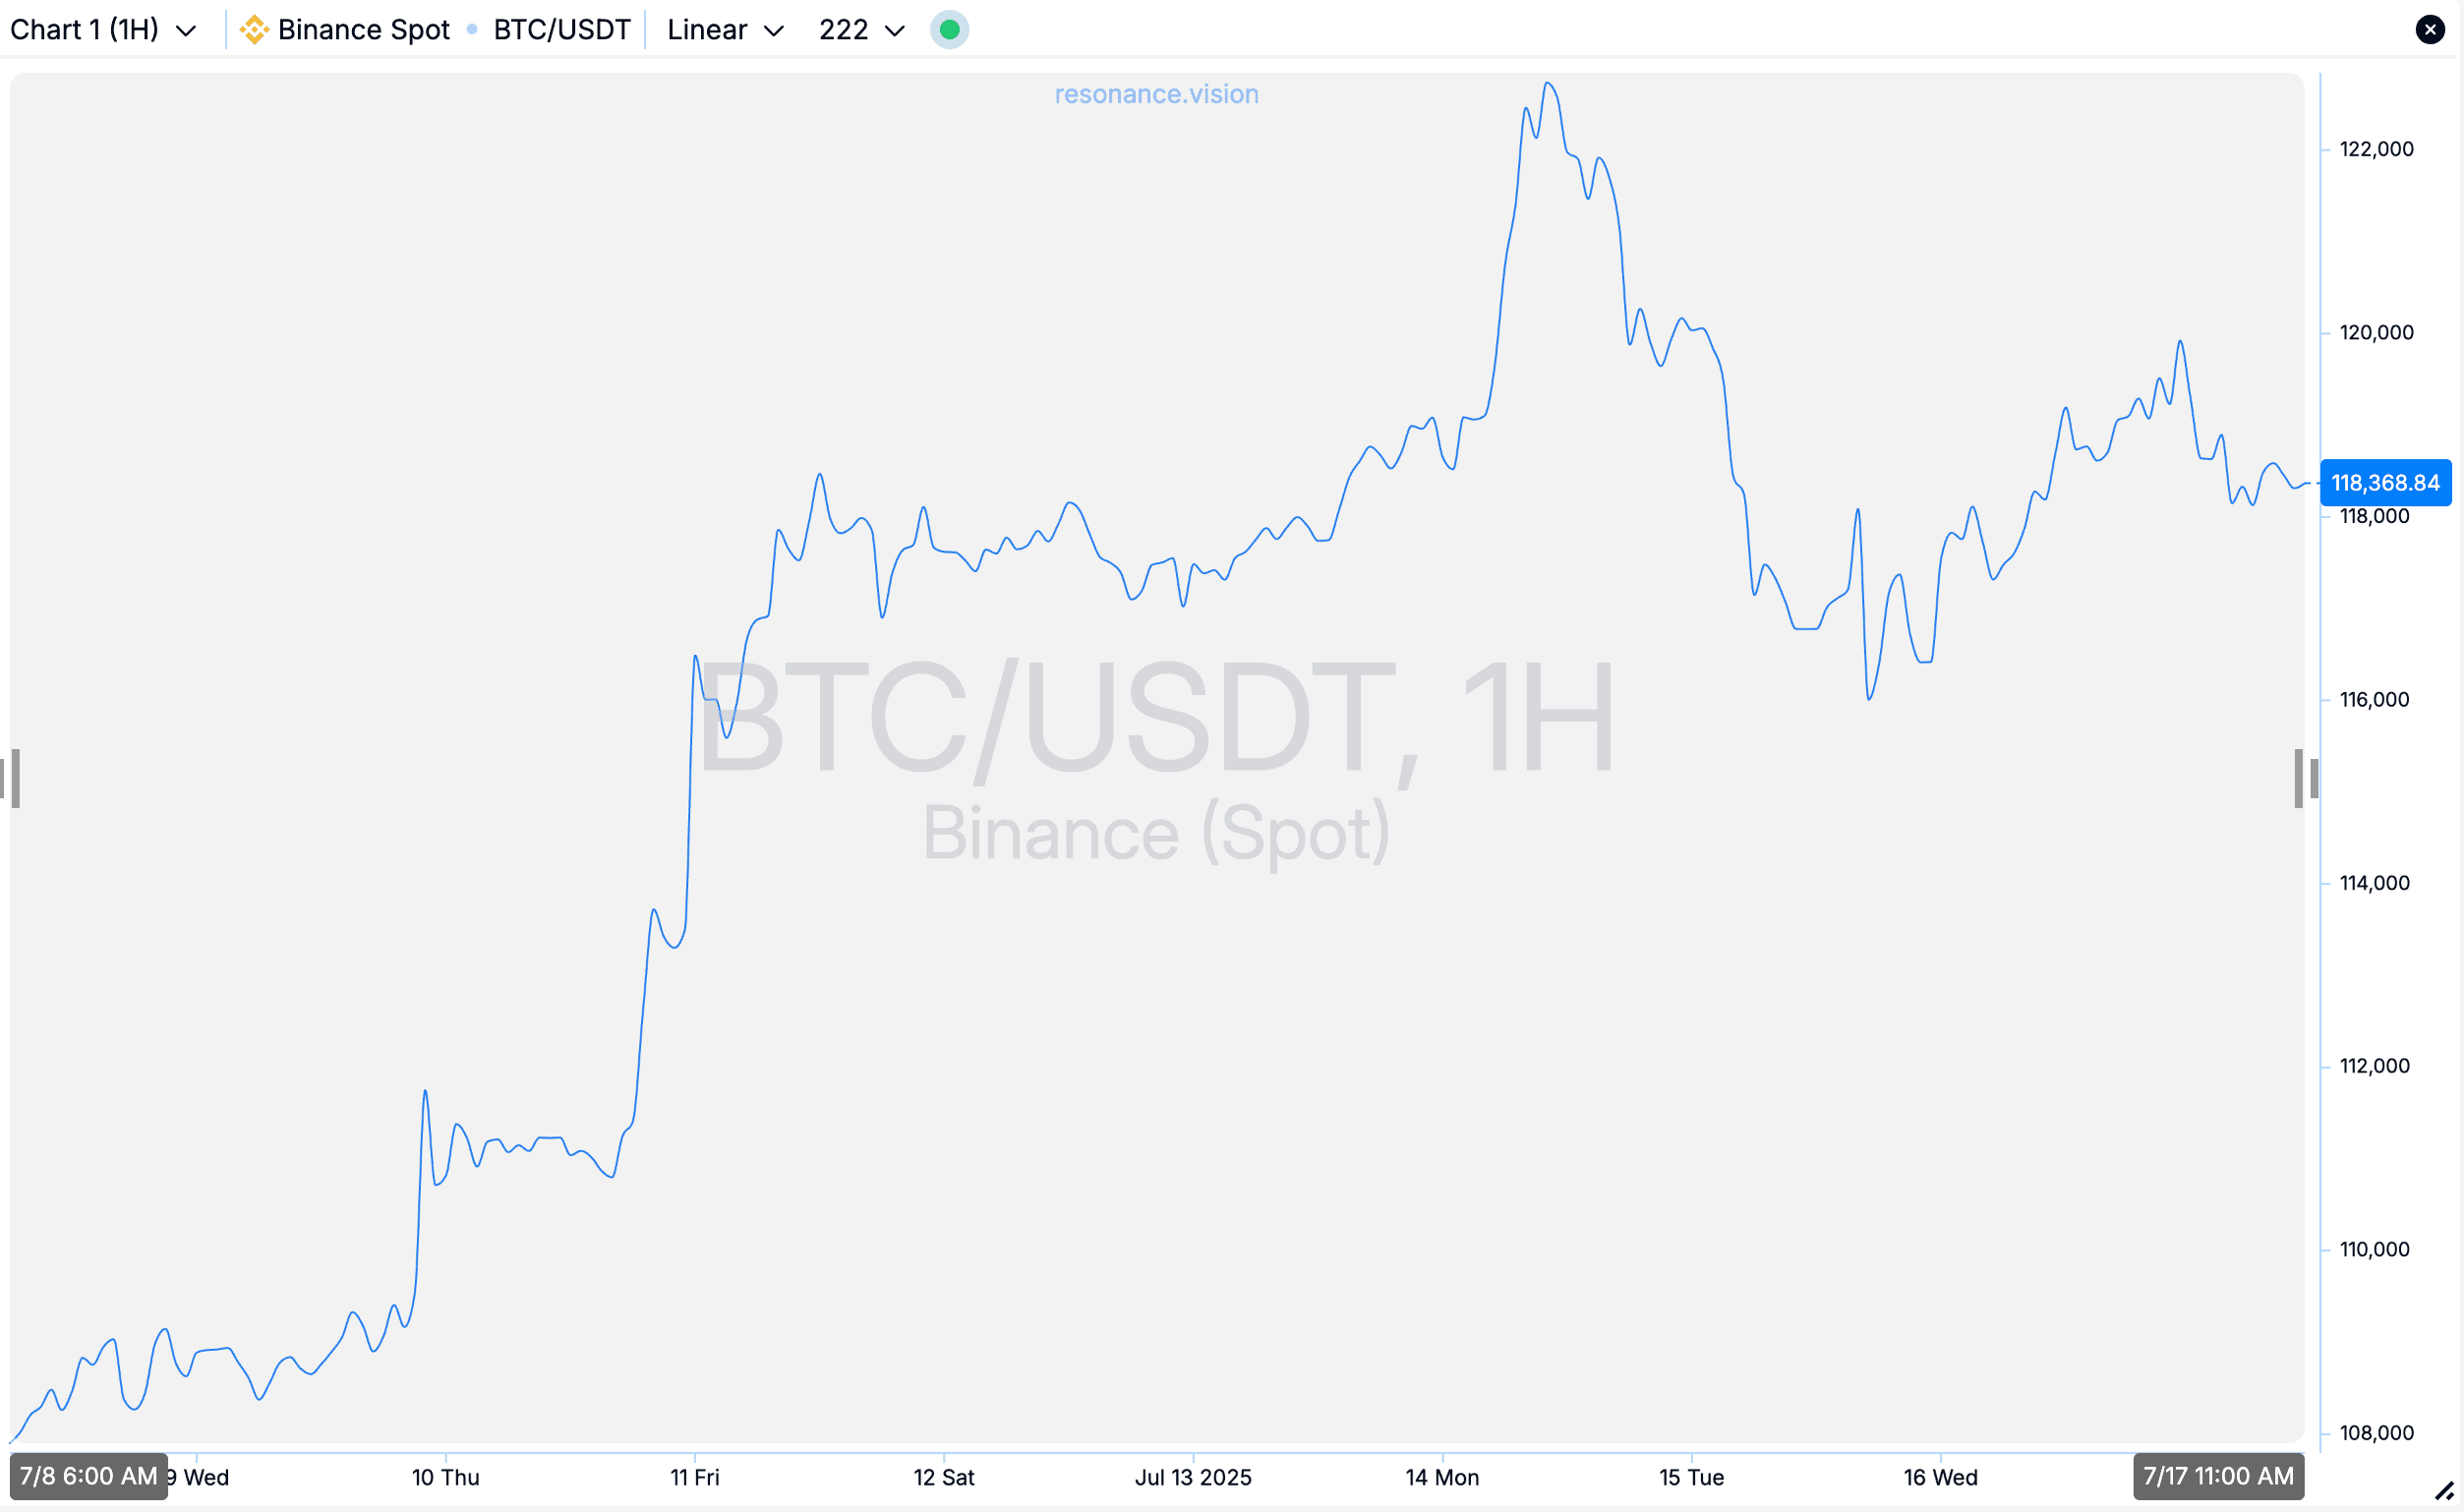
They show price change over time.
But the most popular charts are bar and candlestick charts, which group ticks into time-based candles. These are where most beginners start.
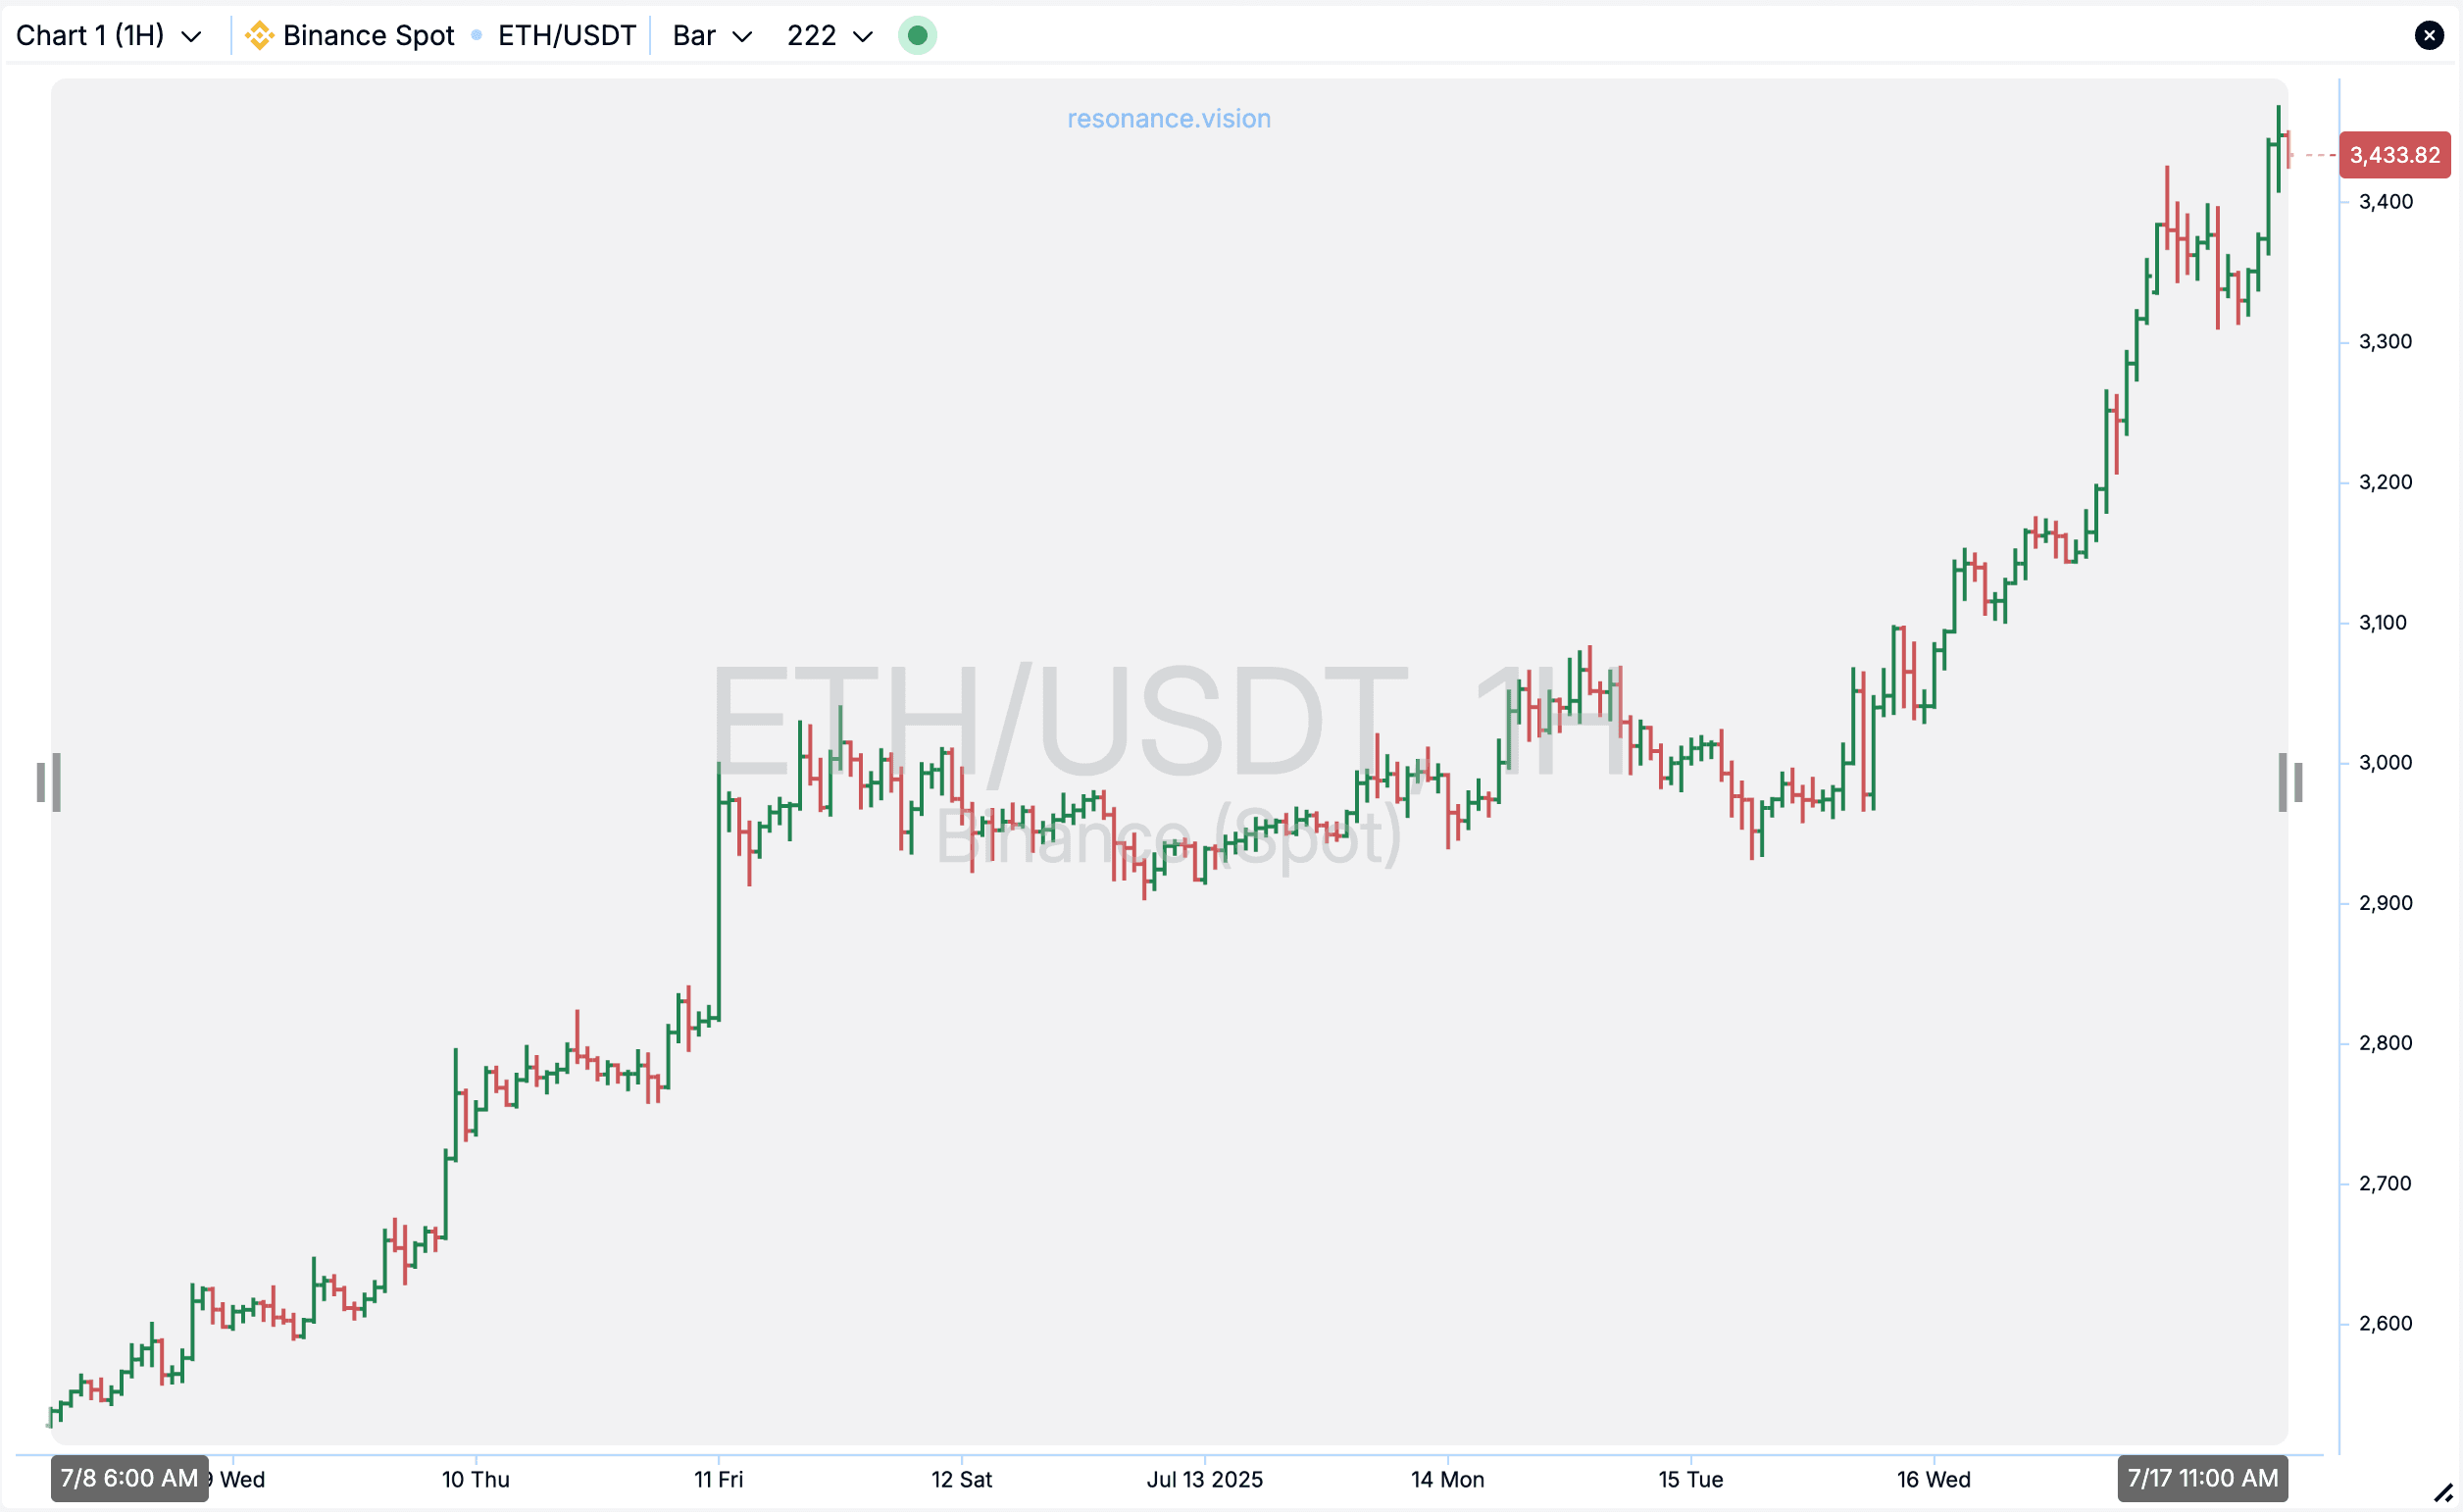
However, those who are not new to the market know that this isn’t enough.
Experienced traders use volume-based cluster charts that display traded volume and its distribution over a specific time interval.
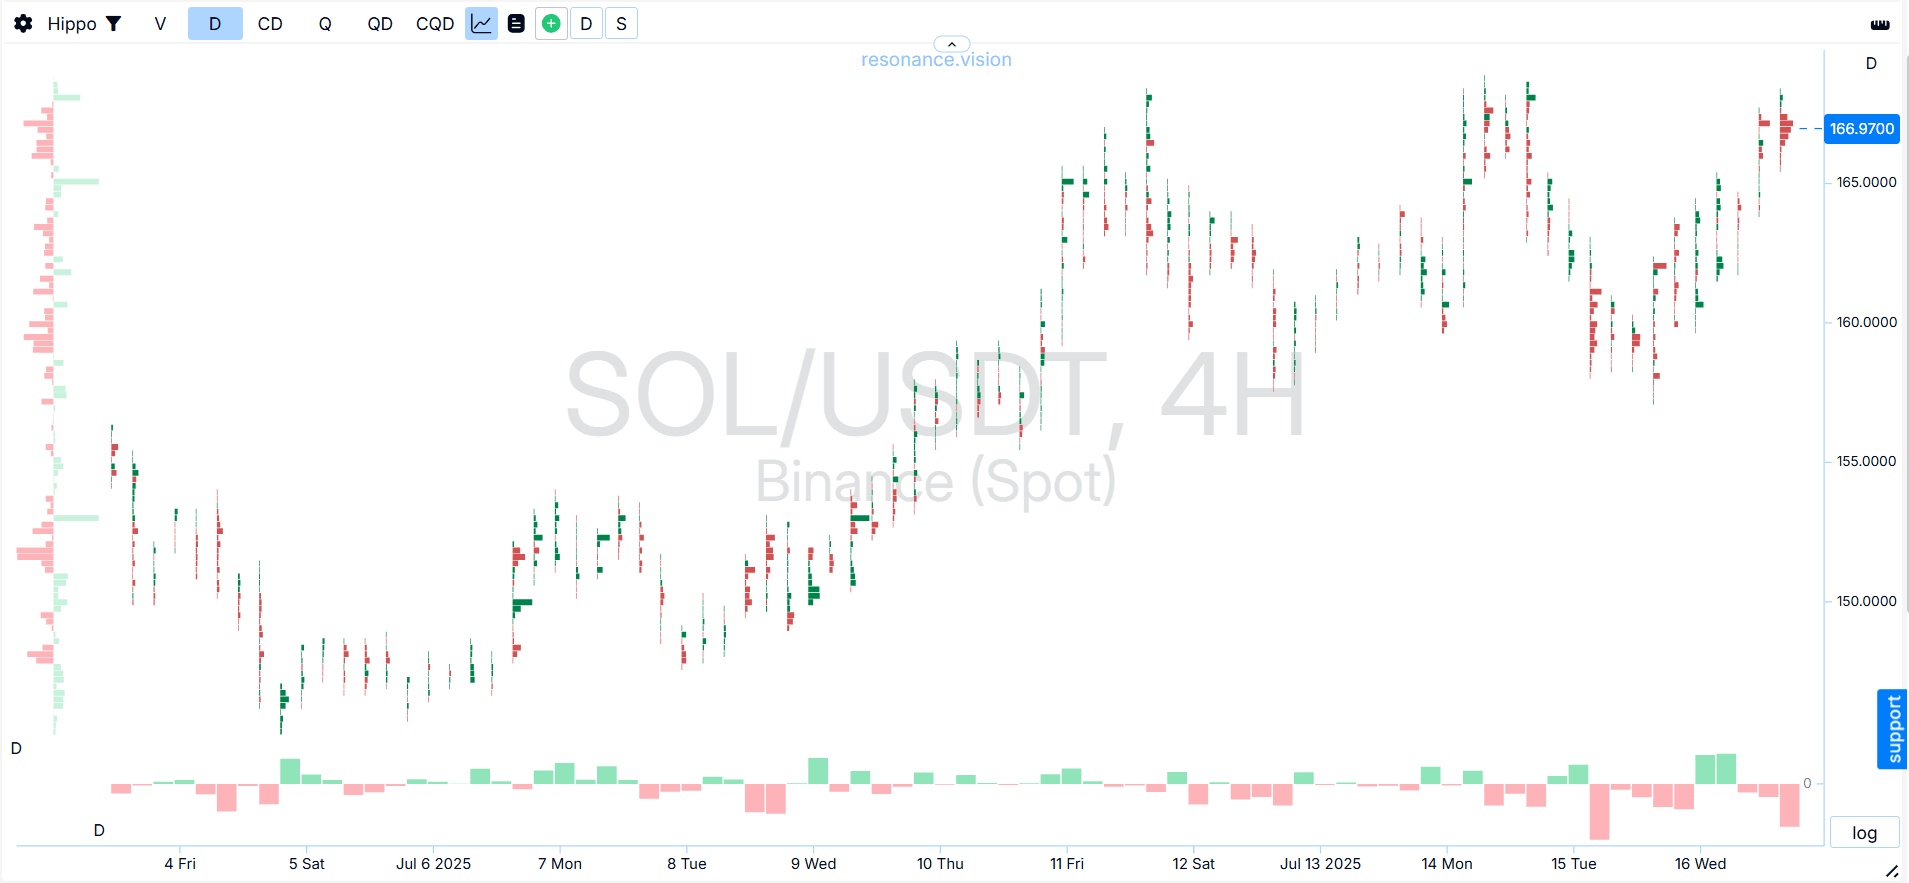
This is a different level of market understanding.
Why Beginners Obsess Over Indicators
Even after completing dozens of online courses, novice traders are left with many questions:
- How to draw a trendline correctly?
- How to interpret a technical pattern on the chart?
- Where is the entry and exit point for a trade?
At this point, a new hope appears: indicators! They seem like ready-made tools that take all responsibility off your shoulders.
The best indicators for crypto trading for scalping or swing trading often look like a “holy grail.” You find “your” settings — and everything seems to work. But as soon as the market changes — everything falls apart. You tweak the settings again. And again comes failure.
Why Indicators Don’t Work
Every indicator is a formula created by some author. But there are questions:
- What data is used?
- Why were these parameters chosen?
- What timeframe was it designed for?
- What risks are there, and are they considered?
Here’s an example of one of the top indicators — the RSI:
- the first signal was to buy, but the price continued to fall
- the second was to sell, but the market chose otherwise — the price kept rising
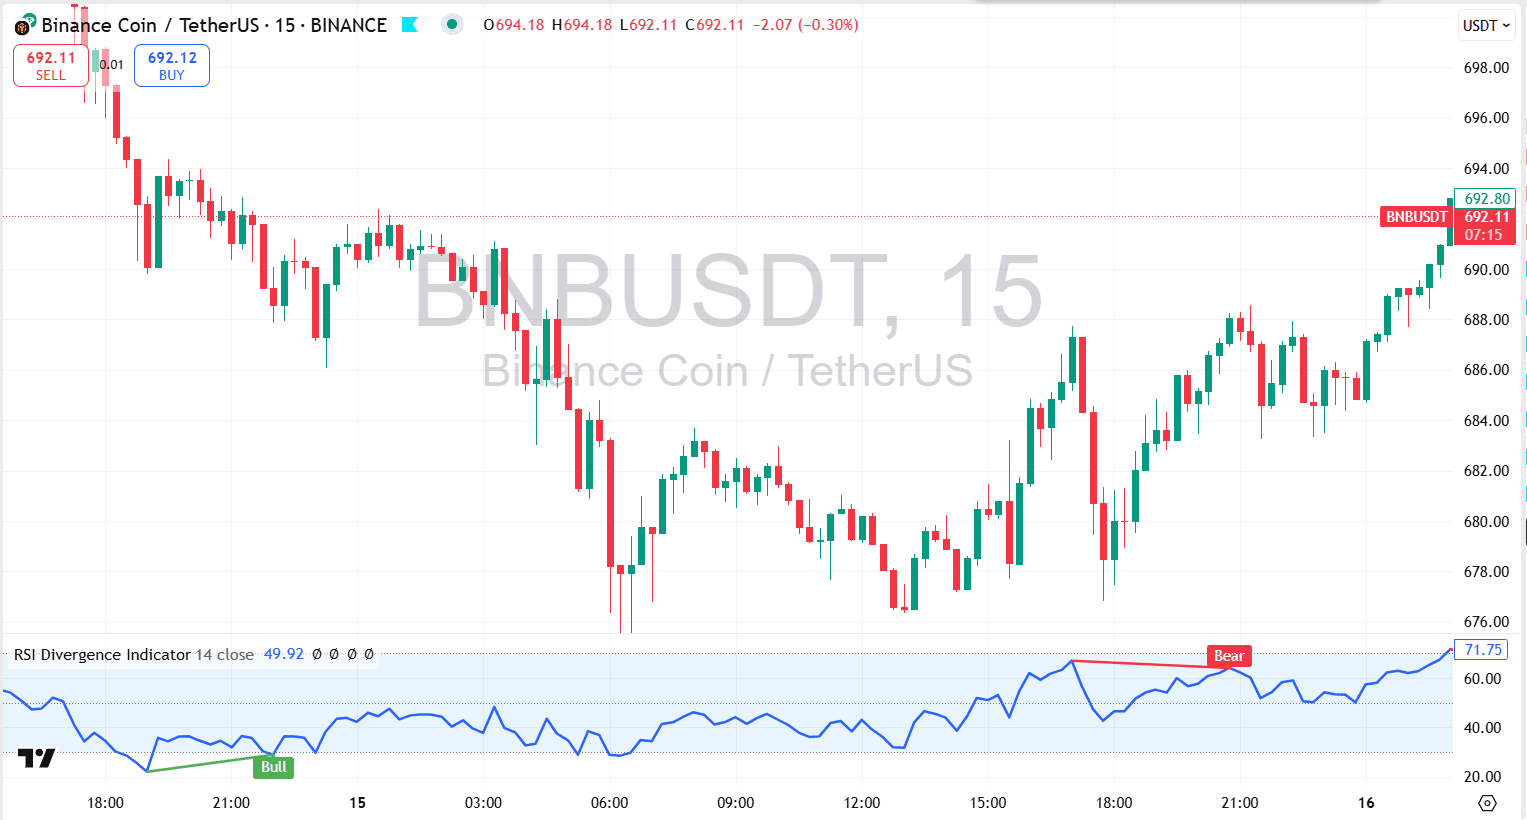
So, can you really make consistent profits with indicators? Doubtful. Because none of them reflect actual market balance — they interpret past events.
Indicators are not predictive tools. They interpret the past, mainly based on price movement.
Does this have anything to do with real market mechanics — supply and demand? No. The market doesn’t care about popular indicators like MACD, RSI, Fibonacci, or moving averages. What drives the market is liquidity.
By the way, we explore this in detail in the article "What’s Wrong with Technical Analysis."
What About Trading Bots?
After manual day trading failures, many want to buy a bot. A soulless machine that doesn’t fear making trades because it has no emotions. Just a dry algorithm.
But bots have the same problems. They don’t account for market phases and also often rely on indicators — with the same efficiency. Sure, the result might be slightly better, but the core issue remains.
A trading bot is just automation. Nothing more. In the article “Algorithmic Trading: Automating Market Profits,” our trusted author shares his experience. Check it out and draw your own conclusions.
Is the “Naked” Chart a Solution?
Another extreme — throw out everything and leave just the price. “Price reflects everything!” say pure chart advocates.
But do we really see the full picture by looking at price alone?
That’s like trying to complete a puzzle without the right pieces. But what if you could see total volume, pressure zones from buyers or sellers, and price reaction to their moves? That’s when things become clearer.
What Actually Works?
Yes, there are professional tools that really help — especially those that highlight volume imbalance on the market. We explored this in our article "How to Spot Deficit and Surplus."
These tools help assess:
- Traded volume by market participants
- Delta — the difference between buys and sells
- Limit orders — passive interest in the asset
But this too requires professional knowledge: what to look at and how to work with it. A mini-course from Aires can help — a foundation in supply and demand dynamics.
And this is exactly where Resonance platform tools come into play. They’re not your average indicators. They’re a system of metrics that show:
- Pressure intensity in the market
- Balance between buyers and sellers
- Liquidity inefficiencies
- Market phase transitions
This is what experienced traders use to see the market in the now and act in the moment.
How Not to Drown in Indicators
We often see beginners call BAS, Market Delta, FTT, Balance Index “indicators.” But that’s a misperception. These tools aren’t about “red” or “green” signals. They’re about analyzing market structure.
If you want to grow — learn to see deeper than any standard exchange indicator allows.
Conclusion
Crypto trading is primarily about analytics, not indicator signals.
Indicators are attractive because they’re easy. But if you want to make real money in the crypto market, you need more.
Want better results? Choose better tools, study the best practices, work with top resources. And most importantly — don’t look for easy wins. The market isn’t about ease. It’s about logic, supply and demand.
What’s Next?
Want to see the market like a professional day trader or investor?
Start with the online tools from Resonance. Use cluster charts, analyze delta, view real-time volume — and you’ll realize this is another level.
This isn’t another promise of “quick cash.” It’s the best approach to crypto trading — based on logic, data, and true understanding.
P.S. Want to master deep market analysis? Check out our online courses, where we teach step-by-step how to earn stable profits in crypto trading, how our tools work, and how they support informed trading decisions.
Follow new insights in our telegram channel.
No need to invent complex schemes and look for the "grail". Use the Resonance platform tools.
Register via the link — get a bonus and start earning:
OKX | BingX | KuCoin.
Promo code TOPBLOG gives you a 10% discount on any Resonance tariff plan.
If you still rely on indicators alone, remember: even the best indicators for crypto trading won’t save a strategy built on guessing. The market moves because of liquidity and real volume, not because a script flashes a green arrow. That’s why learning to trade using charts correctly — through volume, delta and market balance — is far more important than blindly following technical indicators.
And while many beginners search for the top indicators for crypto trading, professionals focus on supply-and-demand behaviour in real time. This shift in mindset is the most important step toward stable performance.
Recommended articles


