Fundamental analysis in trading: what it is and how to apply it

Get to know what fundamental analysis in trading is and how to apply it in the world of cryptocurrency. The article discusses macro and micro factors that affect asset value, examples from the market, and why this type of analysis is indispensable in crypto trading for long-term investors.
Table of contents

Intro
The methodology of evaluating a company based on different micro- and macroeconomic conditions originated in the stock market. Any public project in which people invest is a business, and it has a lot of indicators that need to be evaluated. The way to evaluate these indicators is called “fundamental analysis”.
_The “father” of this modern type of market analysis is Benjamin Graham, who published his Security Analysis back in 1934. This book is considered the Bible for investors all over the world thus far. His most brilliant follower is Warren Buffett, who has long been at the top of the richest people in the world.
Since the middle of the 20th century, the market has changed; not only the types of analysis have transformed, but also the assets being analyzed. Therefore, today the fundamental analysis of stocks is applicable not only to commodity and stock markets but also to the crypto trading space and the cryptocurrency market in general.
Fundamental analysis of crypto assets
Let’s take a look at how to analyze stocks and cryptocurrency to determine whether or not to invest in an asset.
Macro level
At the macro level, there are the following three areas of study within financial and crypto trading analysis:
- Current global news, the general economic and political background, the favorability of the investment climate.
- Status of industries, determination of the greatest interest in a particular industry.
- Researching the news background of the company, from current reporting to transactions of various scales.
Micro level
At the micro level, the following indicators must be noted:
- Tokenomics (business model, methods of using a crypto asset, blockchain activity)
- The project development team (and other internal factors)
- Economic situation in the world
- User interest in cryptocurrency (demand among market participants)
- News background and economic forecasts
Let’s delve into each indicator and its meaning.
- Financial metrics, i.e. data on how the asset is currently traded, as well as what its liquidity and distribution patterns are.
- The number of transactions as an indicator of chain activity. The more transactions, the greater the need for this project. However, you have to be careful with this indicator: even one user using multiple wallets can create artificial volume.
- Information about the number of transactions within the blockchain. An increase in this indicator indicates an increase in interest in the coin.
- The development team is a group of specialists who undertake the development and promotion of a given product to the masses. Here you can take note of the team member’s background, the presence of successful cases in the past, how the community looks like on GitHub, and what the activity is like. A coin, the development of which has never stopped, may be more attractive than one, the repository of which has not been updated over two years.
- User interest, i.e. in what way the developer’s project will be useful to an average user, whether there is something in their project that can really interest, and whether there’s a solid using case in the future.
It is very important to know how much money has been spent on development and marketing in order to understand how long the project will last and what its market value is. You also need to know if the project has investors. Why is this so important? When funds run out, new investments are made by selling coins on the market. This additional supply lowers the coin price.
Remember that no project team will ever say anything bad about itself, and some projects may even hide certain information from their users. When the project is listed on the exchange, most investors will simply dump their tokens, which will further lower the asset price.
Let’s look at some real market examples.
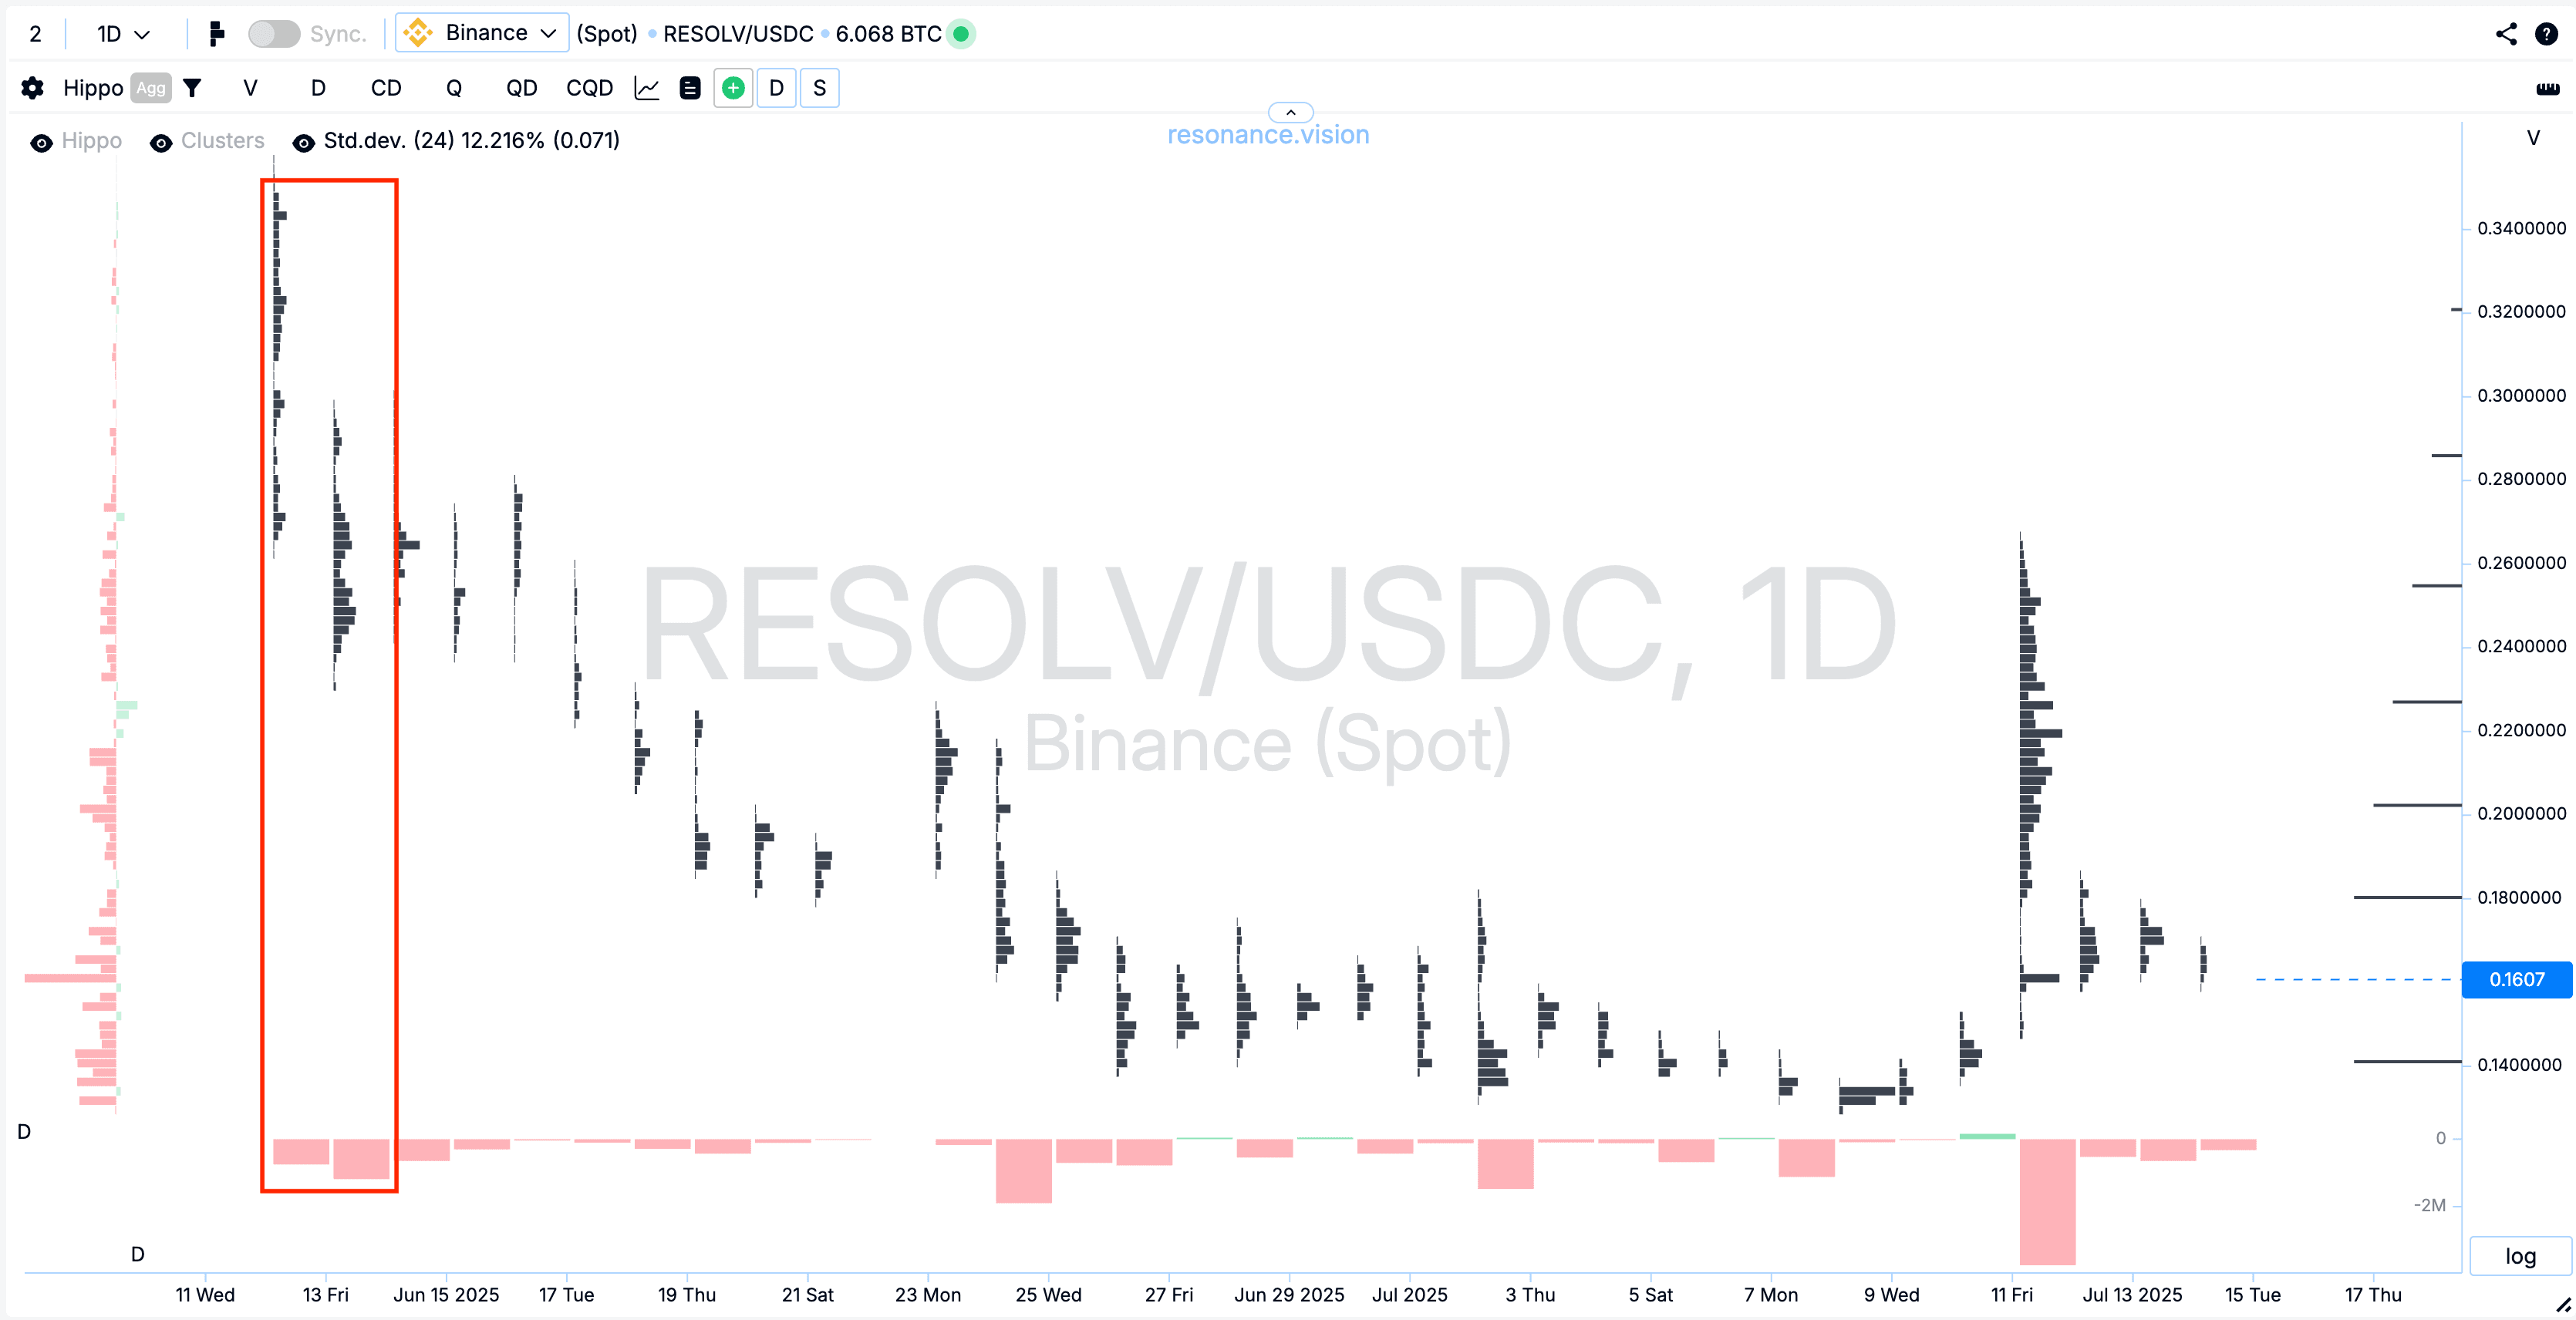
Example 1:
In this example, we see some players dumping the asset once it was listed on the exchange, thus lowering the token price.
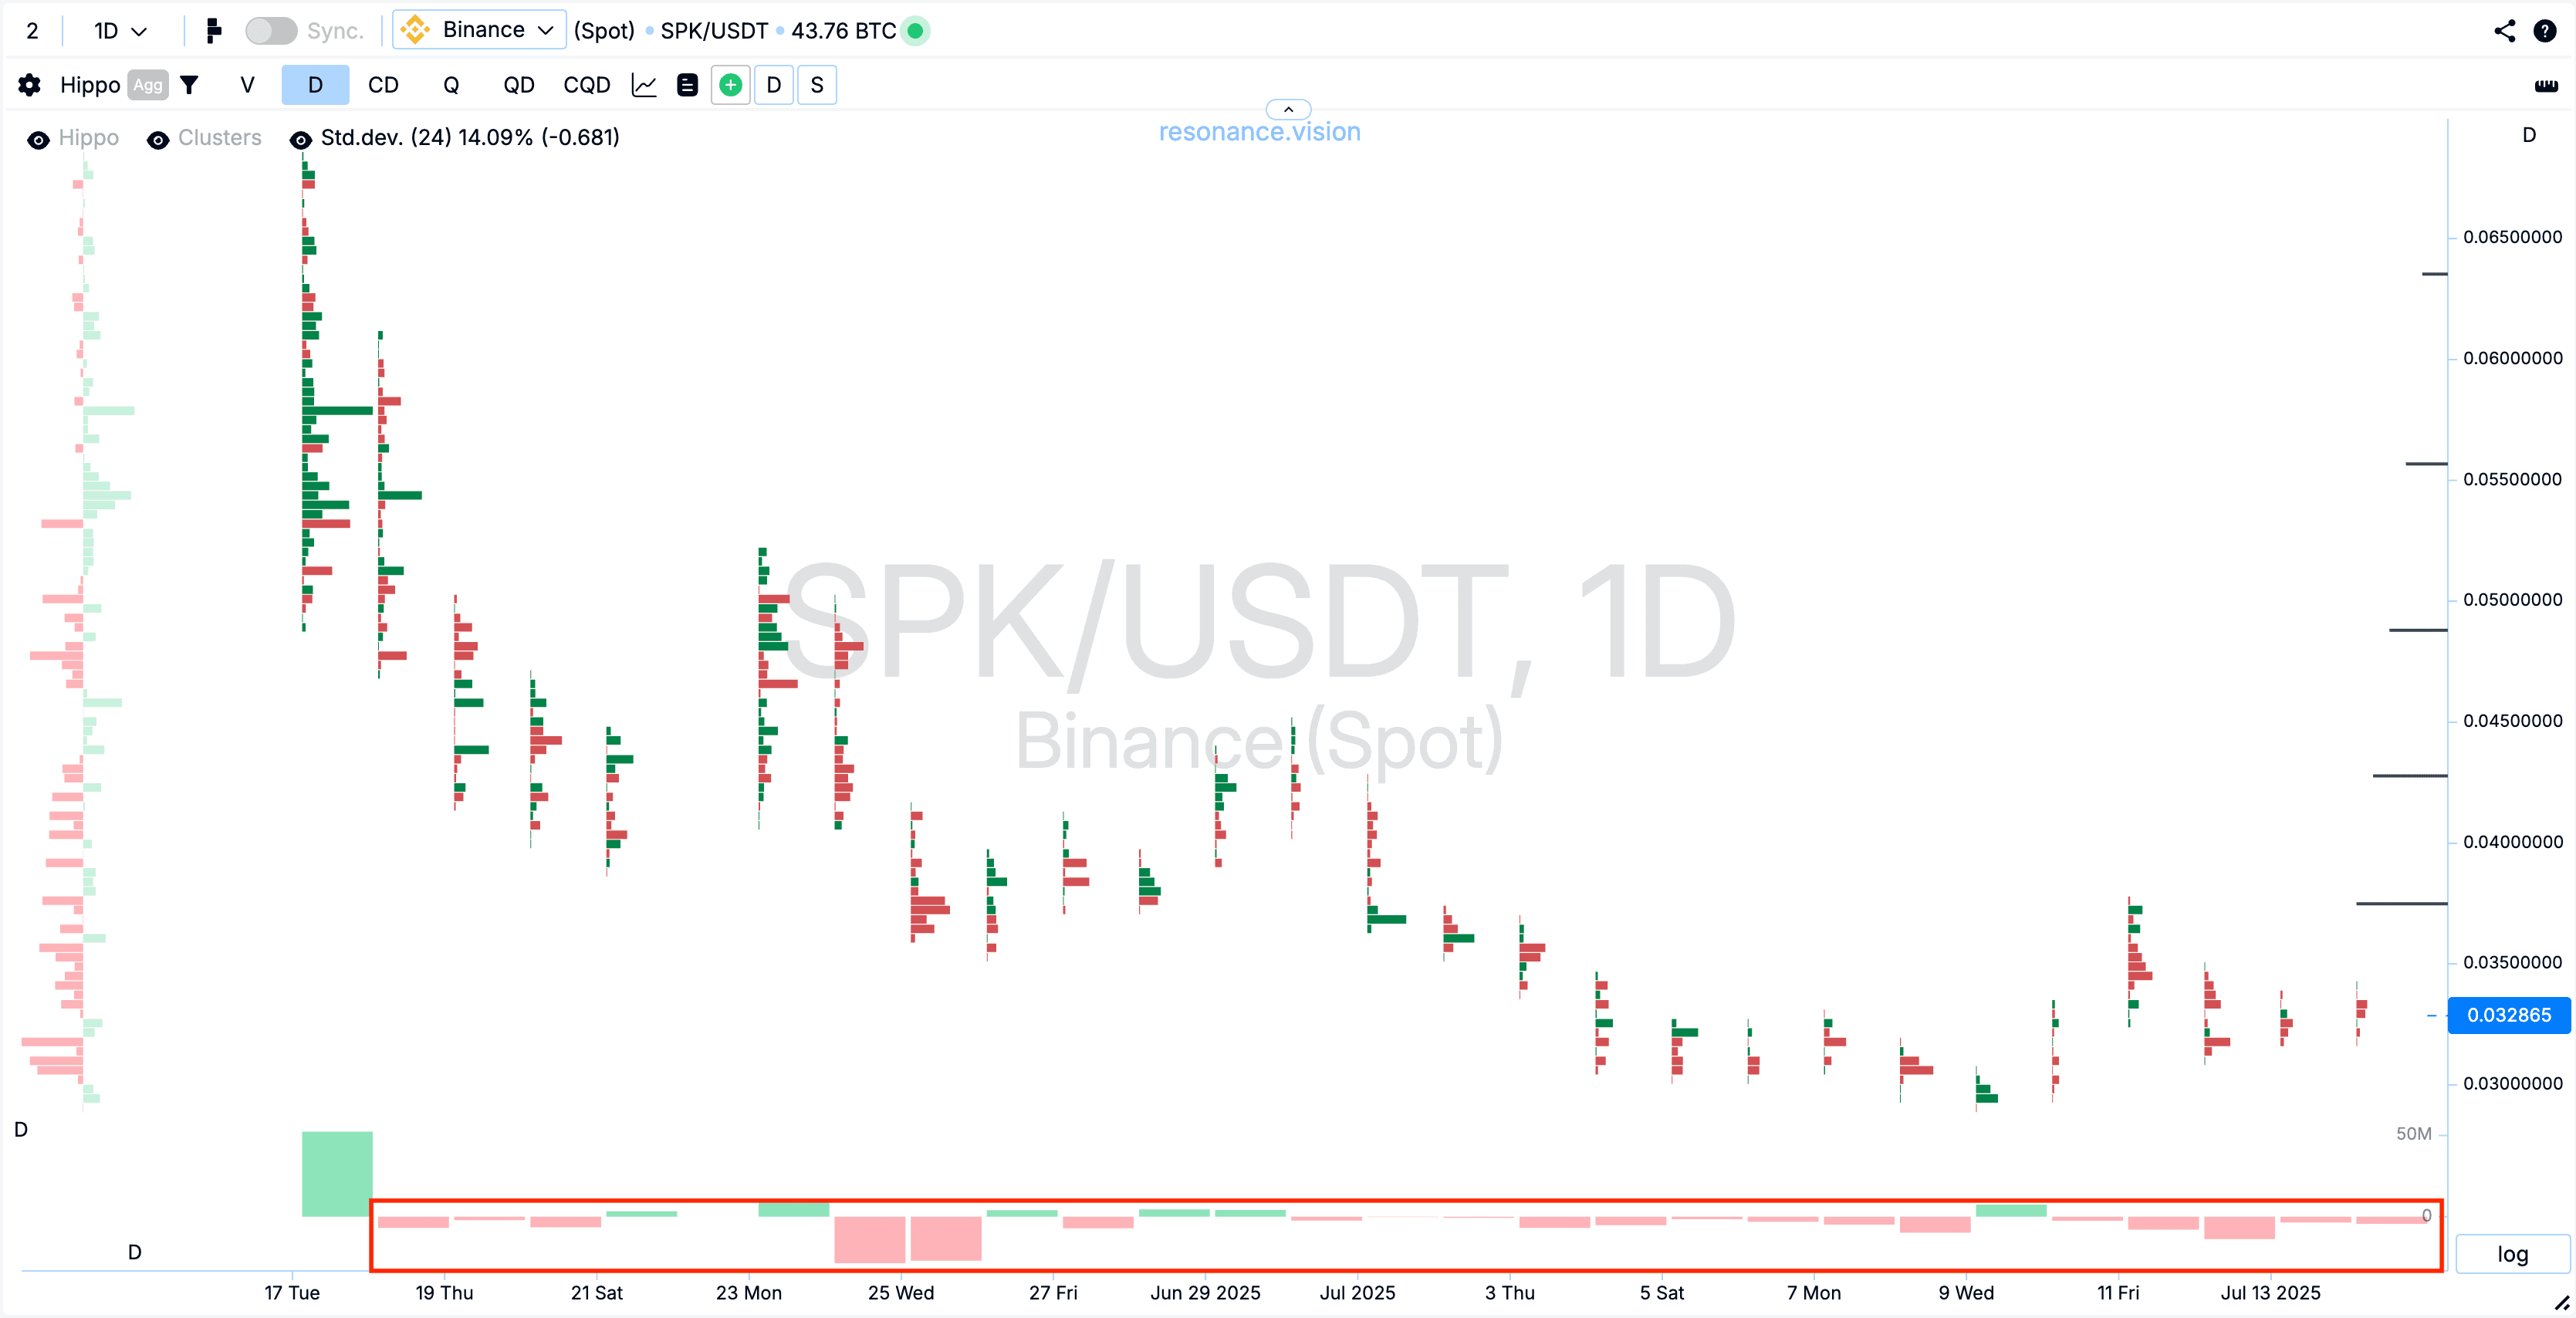
Here is an example №2 of big players dumping right after a listing:
Why should a trader analyze the financial market?
It is important to study and apply fundamental analysis in trading if:
- You feel that you understand nothing at all about the tokenomics of the project you want to invest in.
- You’re scared or worried about price fluctuations and want to understand the basics.
- You’re diversifying your assets, and you’re looking at buying assets over the medium to long term.
It is important to note that the analysis investment is mainly used by medium and long-term investors. In short-term fundamental trading, there is no point and no time to perform a full-fledged in-depth fundamental analysis.
When you know what a cryptocurrency project is, what the underlying idea is, and what team is working on it you may speculate about how big this project will grow. However, in our article “What’s wrong with technical analysis” we told you that “speculating” and “guessing” won’t do any good. The key difference between fundamental and technical analysis is that unlike technical analysis, which is focused on historical data and volumes of the cryptocurrency market focuses more on qualitative factors. That said, neither method is a grail that will tell you 100% for sure which asset will bring you profit.
The fundamental analysis in trading is the top of the iceberg, and your task is to delve deep into the ocean. The decision to buy an asset should be made on the basis of objective facts only, and objective factors are supply and demand, which can be observed on the Resonance cluster chart. Study them and thereafter make a decision whether to buy/sell an asset in the future.
Conclusion
Comparing fundamental vs technical analysis, the first one focuses on deep structural factors and is best for long-term investors rather than short-term traders…
The true crypto trading insight comes not only from theory but also from watching how supply and demand play out in real-time. This is why using cluster charts and the advanced tools on the Resonance platform are crucial for professional decision-making.
You can learn more about fundamental investing and company valuation techniques in the “Fundamental Analysis” lesson in our online university. Go for it and build a smarter investing strategy!
Follow new articles in our telegram channel.
No need to invent complex schemes and look for the "grail". Use the Resonance platform tools.
Register via the link — get a bonus and start earning:
OKX | BingX | KuCoin.
Promo code TOPBLOG gives you a 10% discount on any Resonance tariff plan.
If you want to trade using fundamental analysis, remember that long-term decisions must rely not on guesses but on measurable facts. Proper fundamental analysis in crypto trading helps you filter hype, understand real project value and avoid emotional moves that hurt your cryptocurrency trading results. This method teaches you to evaluate teams, tokenomics, liquidity, demand and market behaviour and make informed decisions supported by volume data on the Resonance cluster charts.
Recommended articles


