Crypto trading sessions: how trading session time affects the market

We explain how crypto trading sessions work, why trading session time influences the market, and at what hours volatility reaches its maximum. The article covers the differences between asian, euro, and american sessions, and how to use their features in trading.
Table of contents
Many people believe that since the crypto market operates 24/7, the concept of sessions does not matter. In fact, it is not so. Crypto trading sessions still play an important role because participant activity strongly depends on the time of day and time zones. By understanding the schedule of world markets, a trader gets hints about when to expect volatility spikes and when the market is likely to be calmer.
Why consider time
Although cryptocurrencies are traded without breaks, the dynamics of trading are uneven. Different regions of the world enter the market at different times, and this forms the nature of price movements. When Europe and the USA are active simultaneously, prices move faster, while at night in UTC, when some are already asleep and others have not yet started trading, the market becomes quieter.
If you look at statistics, you can see that at certain hours stable patterns appear: volume peaks, rises, or falls in volatility. For an intraday trader, this is practically a free indicator that helps to choose the optimal moment for a deal.
Main sessions and their features
Traditionally, three major blocks are distinguished:
- Asian — approximately from 0:00 to 8:00 Greenwich Mean Time (UTC).
- Euro — from 7:00 to 16:00 UTC.
- American — from 13:00 to 22:00 UTC.
These boundaries are conditional but help to understand the general schedule of activity.
Asian session
From midnight UTC, Japan, Korea, Singapore enter the market. In the first hours, there may be a noticeable surge in movement, but overall trading in Asia is calmer. Volatility is lower, and the market more often remains in a range.
Euro session
Around 7–8 a.m. UTC, London and Frankfurt open. From this moment, the market becomes more active: volumes increase. The open of Europe forms the basis of the day. For traders, this means increased crypto market activity and stronger price movements.
American session
From 13:00 UTC, new york funds and traders come to the market. This is the most powerful flow of capital. Here the main trends of the day are formed, and volatility reaches its maximum. Many consider the american phase the main one because it sets the direction for the coming day.
Session overlap: when the market “wakes up”
The most interesting hours are the overlap of Europe and the USA. From about 13:00 to 16:00 UTC, both sessions are open, and liquidity peaks. It is during this period that strong movements most often occur. If, for example, a scalper is looking for fast active trades, the best time is the overlap of the american and euro phases.
After 16:00 UTC, when London closes, dynamics gradually decrease, although the USA continues to trade actively.
Time of silence
There are also opposite periods — when the market almost falls asleep. Usually, this is 2:00–6:00 UTC, when Asia is already heading into the night and Europe has not yet woken up. At these hours, the cryptocurrency market price movements are not so pronounced, as volatility decreases. For scalpers and day traders, this is more of a waiting time than work.
How to use trading sessions on the exchange
It is worth considering the schedule for everyone — both beginners and experienced traders. Regardless of which trading session your work falls into (asian, euro, or american), it is important to remember: even if the market works 24/7, the temporal rhythms remain.
But it is still worth understanding: the market is moved not by the hours of activity themselves, but by the volumes of money. To rely only on trading sessions is not enough. Real trend price movements are formed by states of deficit and surplus. Therefore, the key task of a trader is not just to know when the market is more active, but to analyze how exactly volumes affect the price.
For this, special tools are needed. On the Resonance platform, you can not only see statistics on trading, but also:
- analyze trades (past deals) using cluster charts;
- track participant intentions through data in order books, determining where large limit orders are concentrated.
This approach allows you to make more balanced decisions: not just focusing on the time of day, but seeing the real picture of supply and demand balance on which the movement of cryptocurrencies is built.
Conclusions
Crypto trading sessions help to understand when the market is most active and when trading goes in a calm mode. Maximum dynamics are observed at the intersection of the euro and american phases (approximately 13:00–16:00 UTC), minimum — in the quiet hours of deep night. The ability to take this schedule into account gives the trader an advantage in planning trades.
However, it is important to remember: the market is driven primarily by capital volumes, not by the trading sessions on the exchange themselves. The time of day plays a role, but the key indicator remains the balance of supply and demand. Therefore, relying only on hours of activity is not enough — you need to analyze the market more deeply.
This is where the analytical tools of the Resonance platform help. With their help, you can not only study past trading, but also see participant intentions through order books, understand where the main liquidity zones are concentrated. This approach allows you to make truly balanced decisions, rather than relying solely on the schedule of sessions.
We recommend taking mini-training on a directed trading strategy if you want to turn the understanding of crypto market patterns into a practical decision-making system.
No need to invent complex schemes or hunt for the “grail”. Use the tools of the Resonance platform.
Sign up on exchanges via our links and get bonuses:
OKX | BingX | KuCoin.
Prop firm — trade with the company’s capital: Kraken.
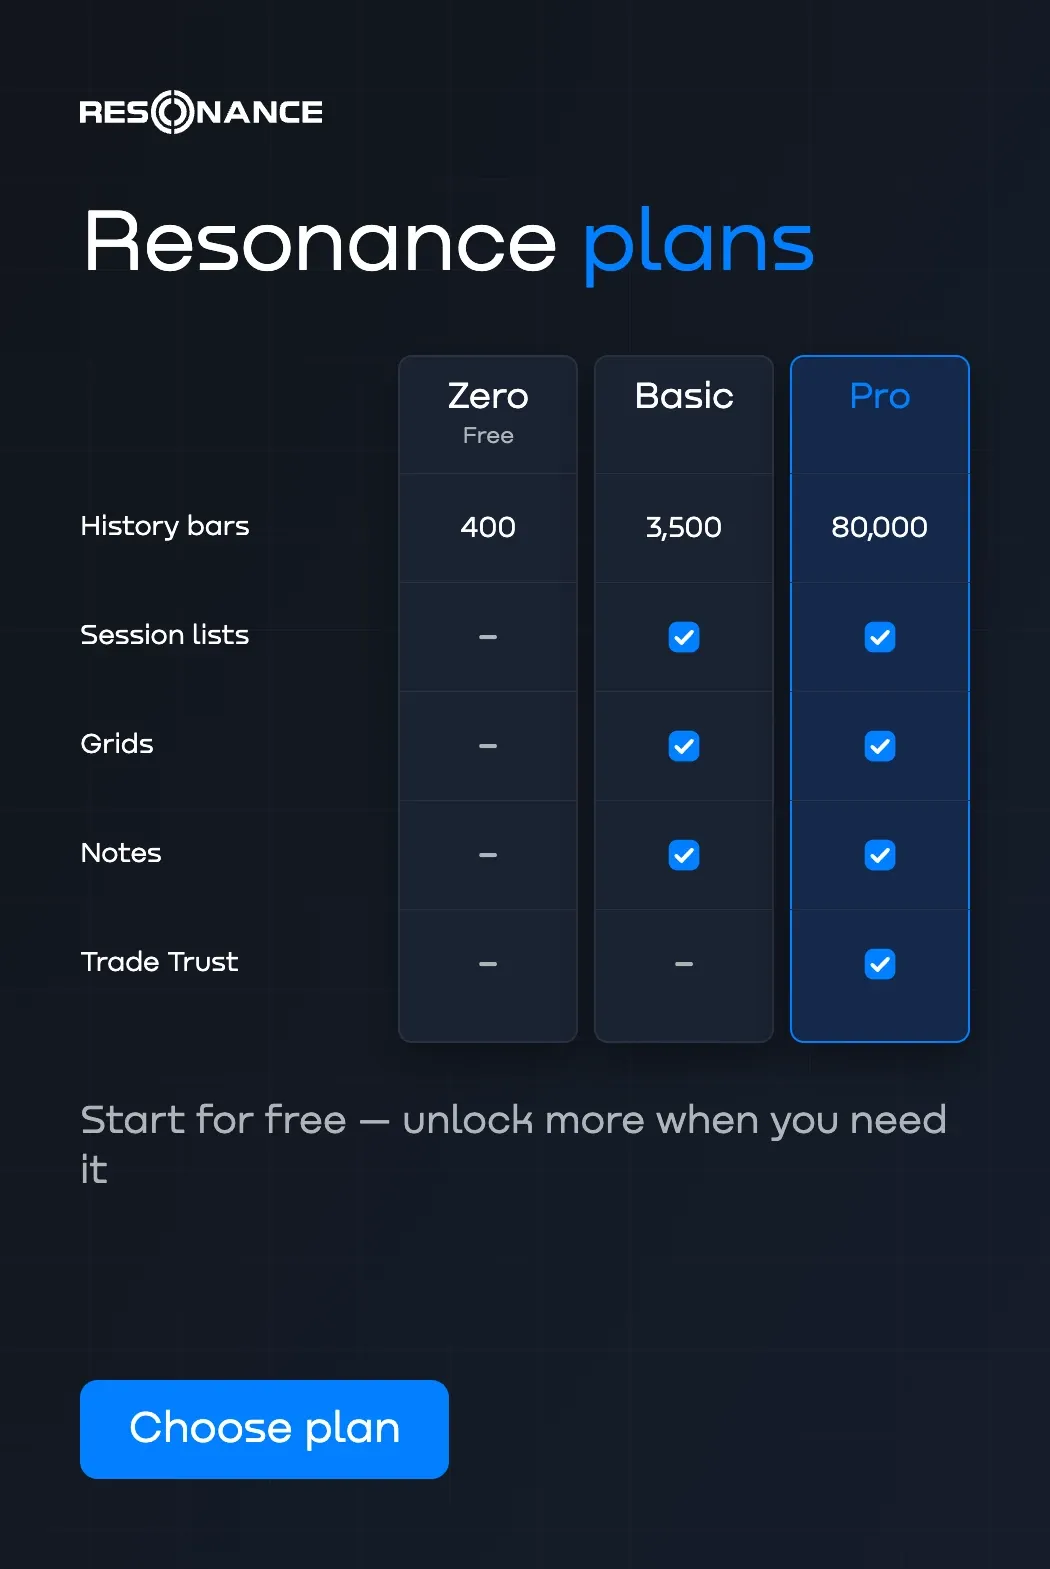
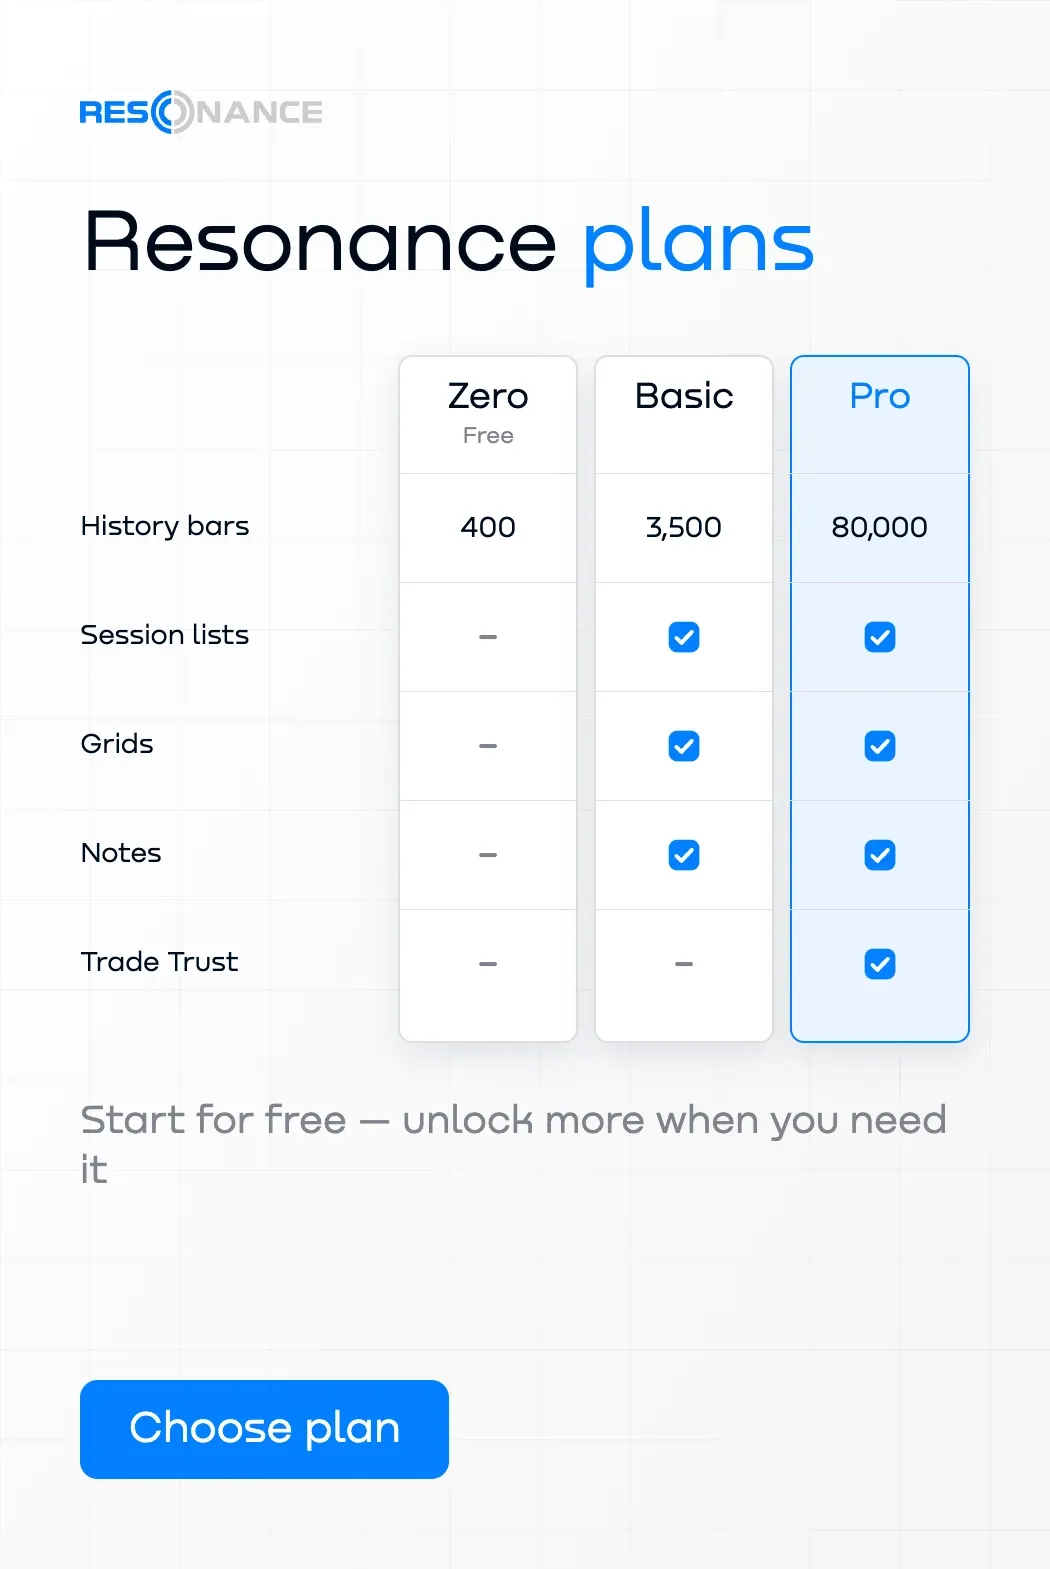
Promo code TOPBLOG gives you 10% off any Resonance plan.
Recommended articles