Стратегия статистического арбитража: как автоматизация и вычисления работают на вас

Статистический арбитраж криптовалют — это стратегия, которая позволяет трейдерам зарабатывать независимо от движения рынка. В материале мы объясняем, как работает парный трейдинг, что такое корреляция, бета-коэффициент, кросс-курс и Z-score, а также показываем практический пример с использованием инструментов платформы Resonance. Вы узнаете, как сложные расчеты помогают трейдерам принимать более точные решения.
Содержание

Вступление
Трейдеры постоянно ищут стратегии, которые позволяют снизить риски и стабильно зарабатывать даже на высоковолатильном рынке, таком как рынок крипты. Одной из таких стратегий считается статистический арбитраж криптовалют. По сути, это парный трейдинг, где трейдер работает не с трендом, а с математикой и историческими данными.
Суть парного трейдинга: выбираются два актива, которые исторически двигаются синхронно. Когда цены на монеты временно расходятся, то открываются разнонаправленные позиции. Когда цены возвращаются к среднему значению, трейдер фиксирует прибыль.
Такая стратегия получила популярность потому, что она относительно нейтральна к направлению рынка: можно зарабатывать как на росте, так и на падении.
Как работает статистический арбитраж на рынке криптовалют
Статистический арбитраж криптовалют - это стратегия, которая построена на использовании временных расхождений в ценах двух активов, которые исторически двигались синхронно и имеют высокую корреляцию.
Корреляция показывает, насколько синхронно движутся две криптовалюты. Значение измеряется от –1 до +1.**
- +1 означает полное совпадение движений.
- 0 — отсутствует связь.
- –1 — активы двигаются в противоположных направлениях.
Для статистического арбитража важна высокая положительная корреляция (0,7 и выше).
Выбор связки активов для статистического арбитража криптовалют
Первый шаг — подобрать подходящую связку монет. Как правило, это монеты из одного сектора (например, DeFi-проекты, AI-сектор, блокчейны-конкуренты и т.д.), у которых есть логическая фундаментальная связь: без нее вероятность разрыва корреляции сильно возрастает.
Подбор правильных связок монет — ключ к успеху стратегии. Обычно трейдеры берут активы:
- из одного сектора с похожей бизнес-моделью
- с высокой ликвидностью
- со схожими рыночными драйверами.
Например, возьмем пару SUI/SEI. Эти монеты можно рассматривать как связку для статистического арбитража, так как это две близкие по фундаменталу монеты с высокой корреляцией.
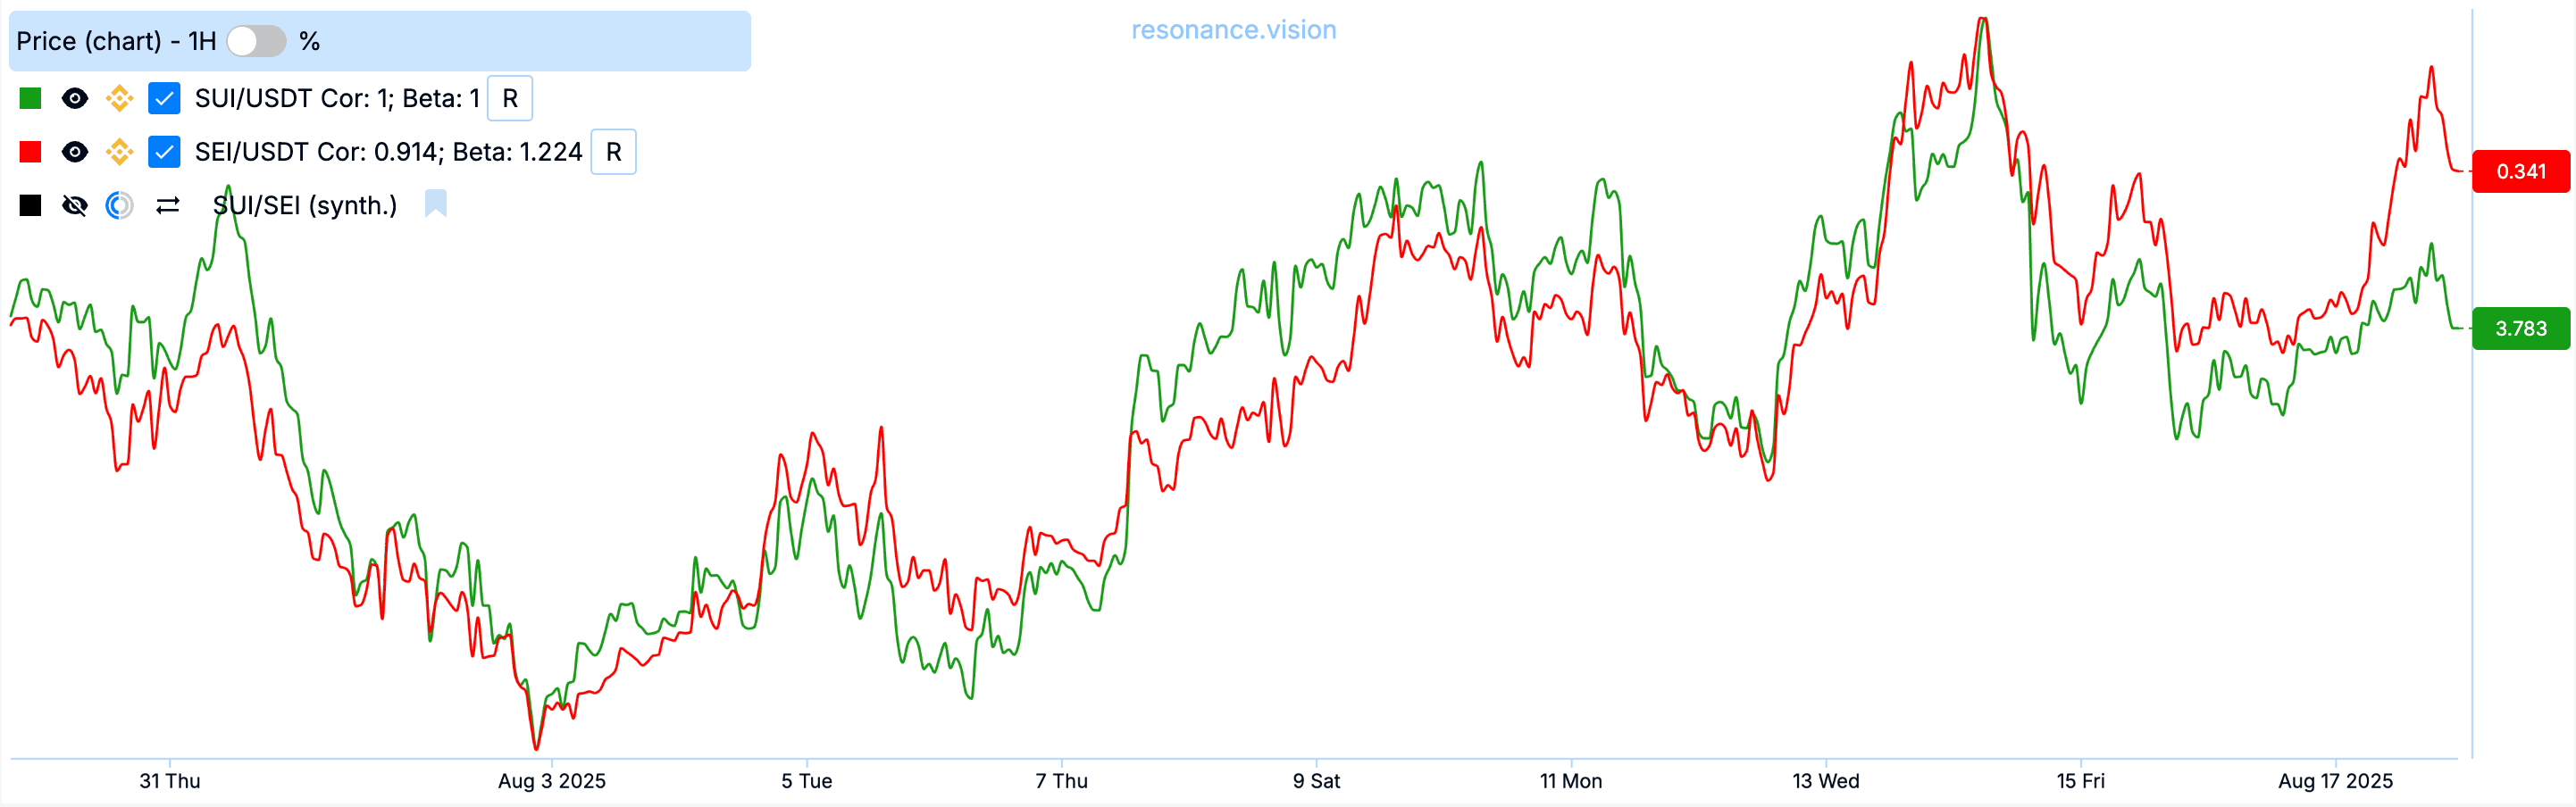
Корреляция у этих монет высокая - 0,90, для парного трейдинга подходит отлично.
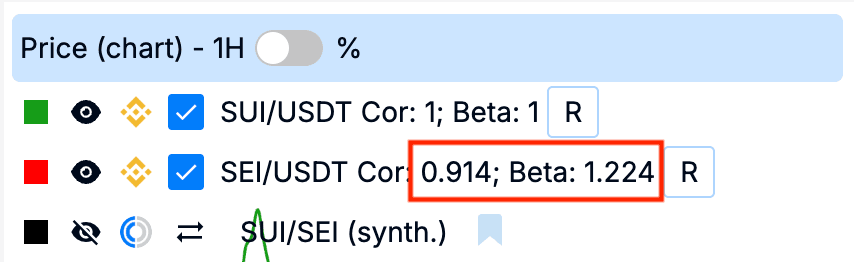
Также важно обращать внимание на то, насколько выбранные в паре монеты волатильны относительно друг друга. Для этого рассчитывается бета-коэффициент.
Бета-коэффициент показывает соотношение волатильности между активами. Простыми словами: насколько один актив изменяется относительно другого.
- Если β = 1 → оба актива имеют примерно одинаковую волатильность
- Если β > 1 → актив более волатильный, чем базовый.
- Если β < 1 → актив имеет волатильность ниже, чем базовый
В парном трейдинге важно, чтобы β была примерно одинаковой у двух монет, которые вы берёте в связку. Тогда риски более предсказуемы, а расхождения в кросс-курсе можно оценивать объективнее.
Поиск расхождений в цене
После выбора связки трейдер наблюдает за динамикой расхождения цен между активами. Для этого используется синтетический график соотношения цен двух монет - кросс-курс.
В парном трейдинге под кросс-курсом понимают график соотношения цен двух активов. Он позволяет наглядно видеть, насколько “разошлись” монеты по цене и когда есть шанс на возврат к среднему.
Так, на скриншоте ниже представлены линейные графики двух торговых пар (SEI/USDT - красный и SUI/USDT - зеленый) и линейный график кросс-курса SUI/SEI (черный)
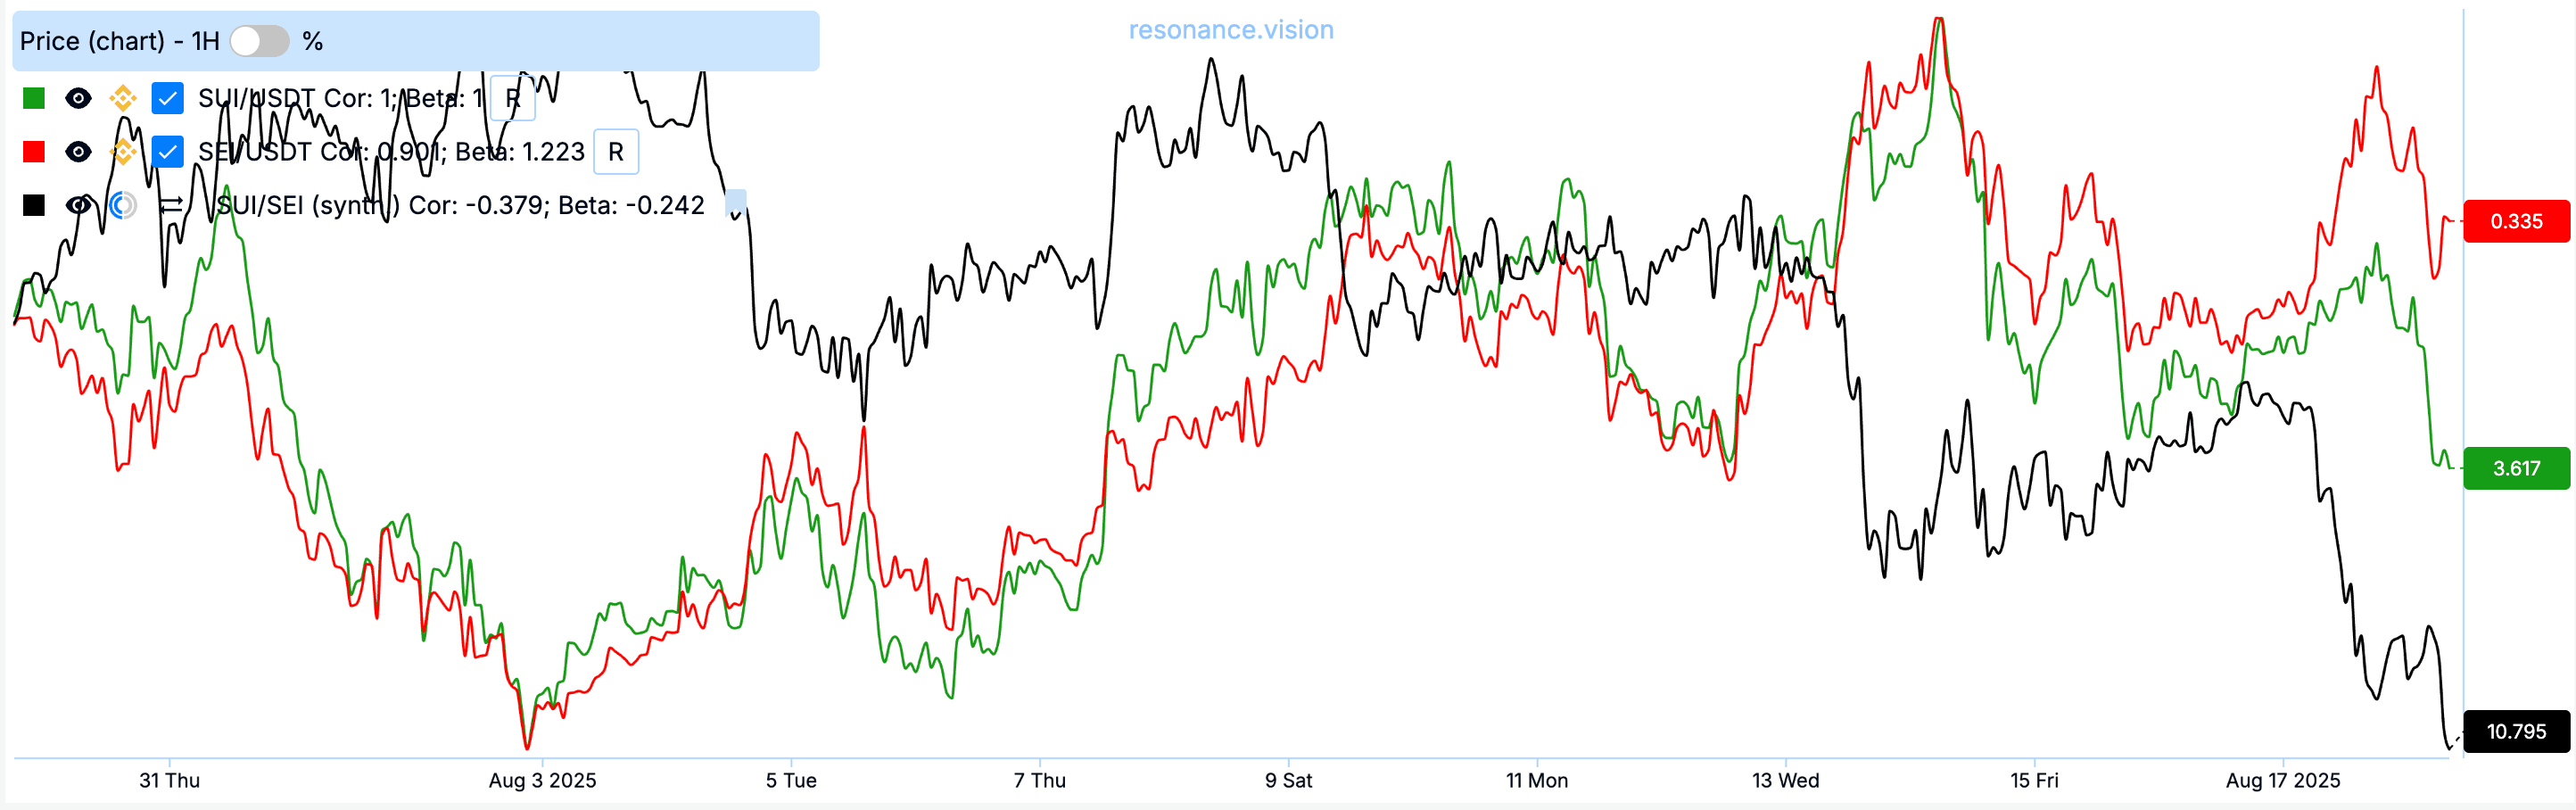
Если кросс-курс отклоняется слишком сильно, возникает торговая возможность: открывается длинная позиция (лонг) на недооцененный актив и короткая (шорт) — на переоцененный. Как только цены возвращаются к статистическому среднему, позиции закрываются с прибылью.
Простое сравнение цен не дает объективной картины: один актив может быть более волатильным, другой — менее. Поэтому, для того, чтобы понять, насколько сильно разошлись цены активов в паре, нам нужен показатель, который будет показывать аномальность этого отклонения относительно истории. Для этого используется Z-score.
Z-score - это показатель, который отражает степень отклонения текущей цены (в данном случае, кросс-курса) от исторического среднего в единицах стандартного отклонения.
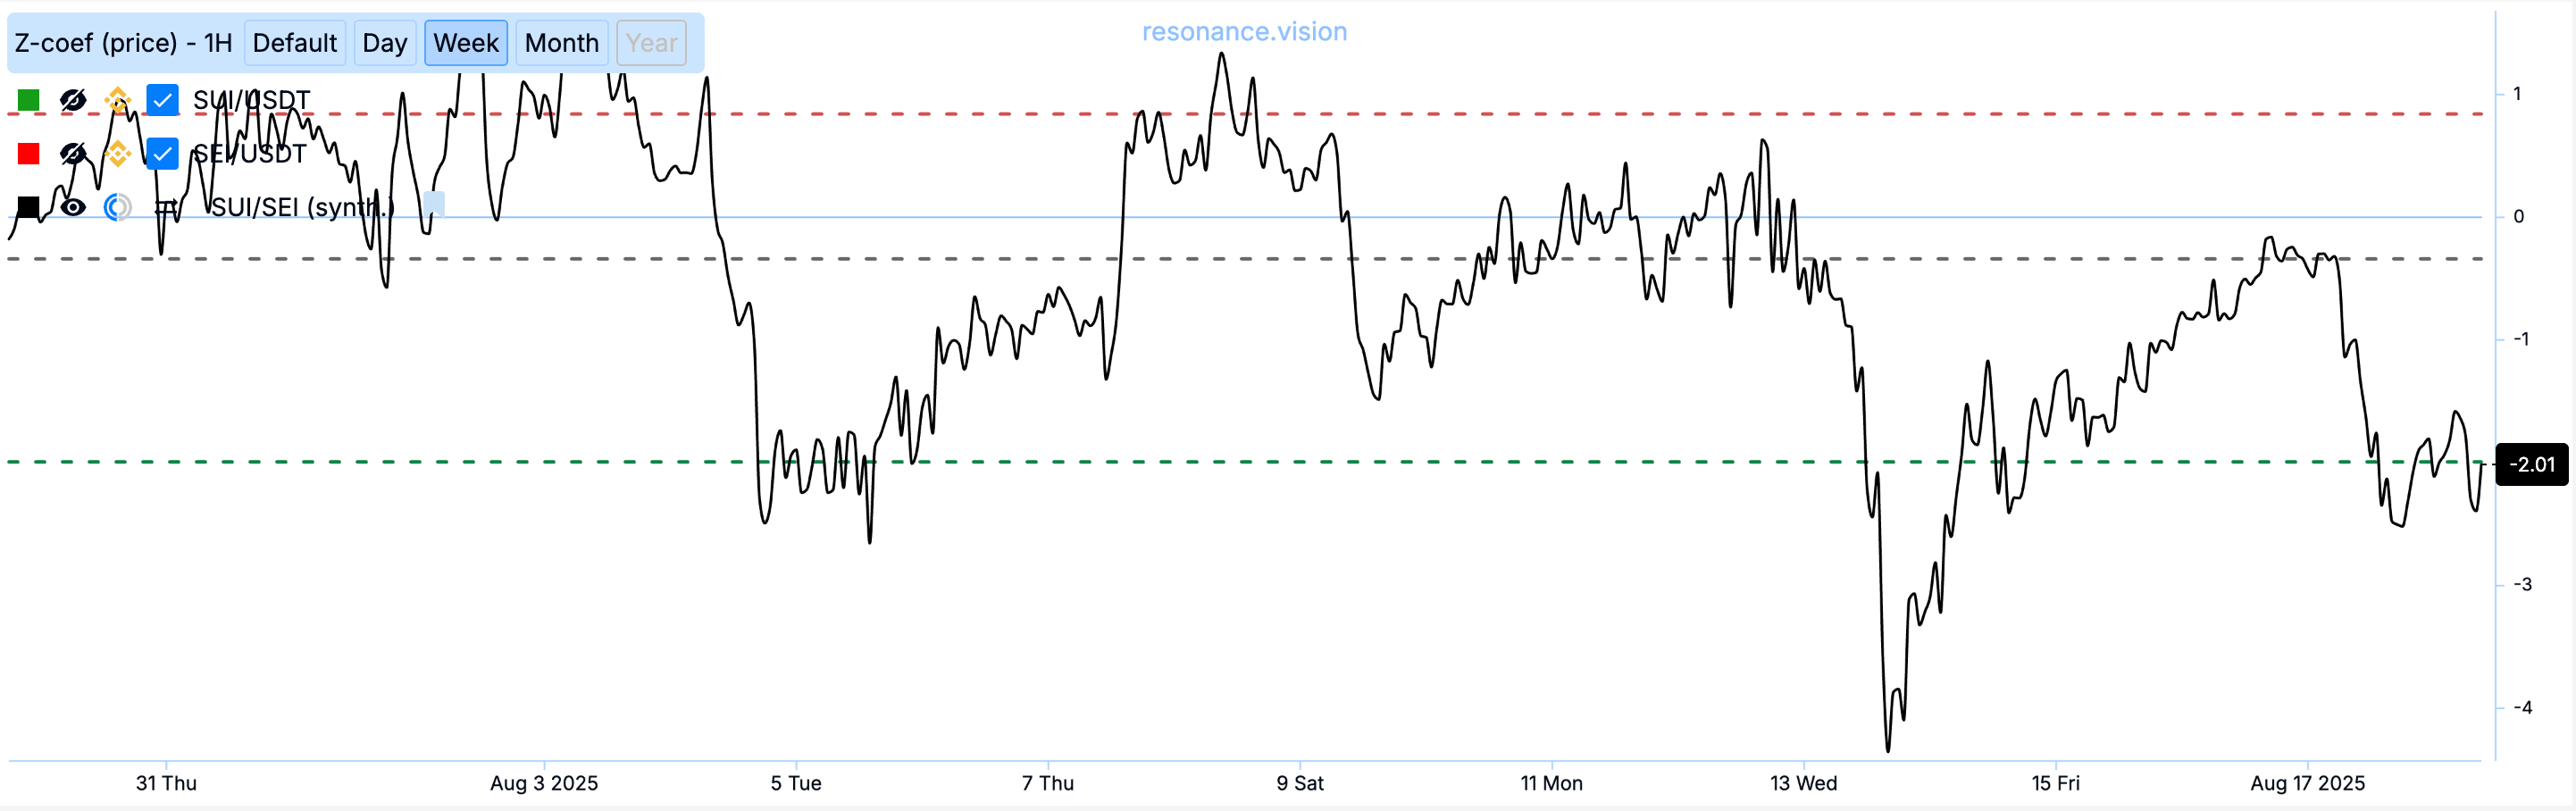
Если Z-score близок к нулю — цены расхождения между ценами нет. Чем дальше показатель уходит в положительную или отрицательную область (например, выше +2 или ниже –2), тем более аномальным считается расхождение и тем выше вероятность, что цены вернутся к среднему статистическому.
Посмотрим стандартное отклонение нашей пары SUI/SEI в абсолютных значениях (здесь мы смотрим только среднестатистическую максимальную величину отклонения, без направления). Видим, что за последний месяц недельное стандартное отклонение только один раз было значительно выше 2, в основном не выше 2,58 стандартных отклонения.
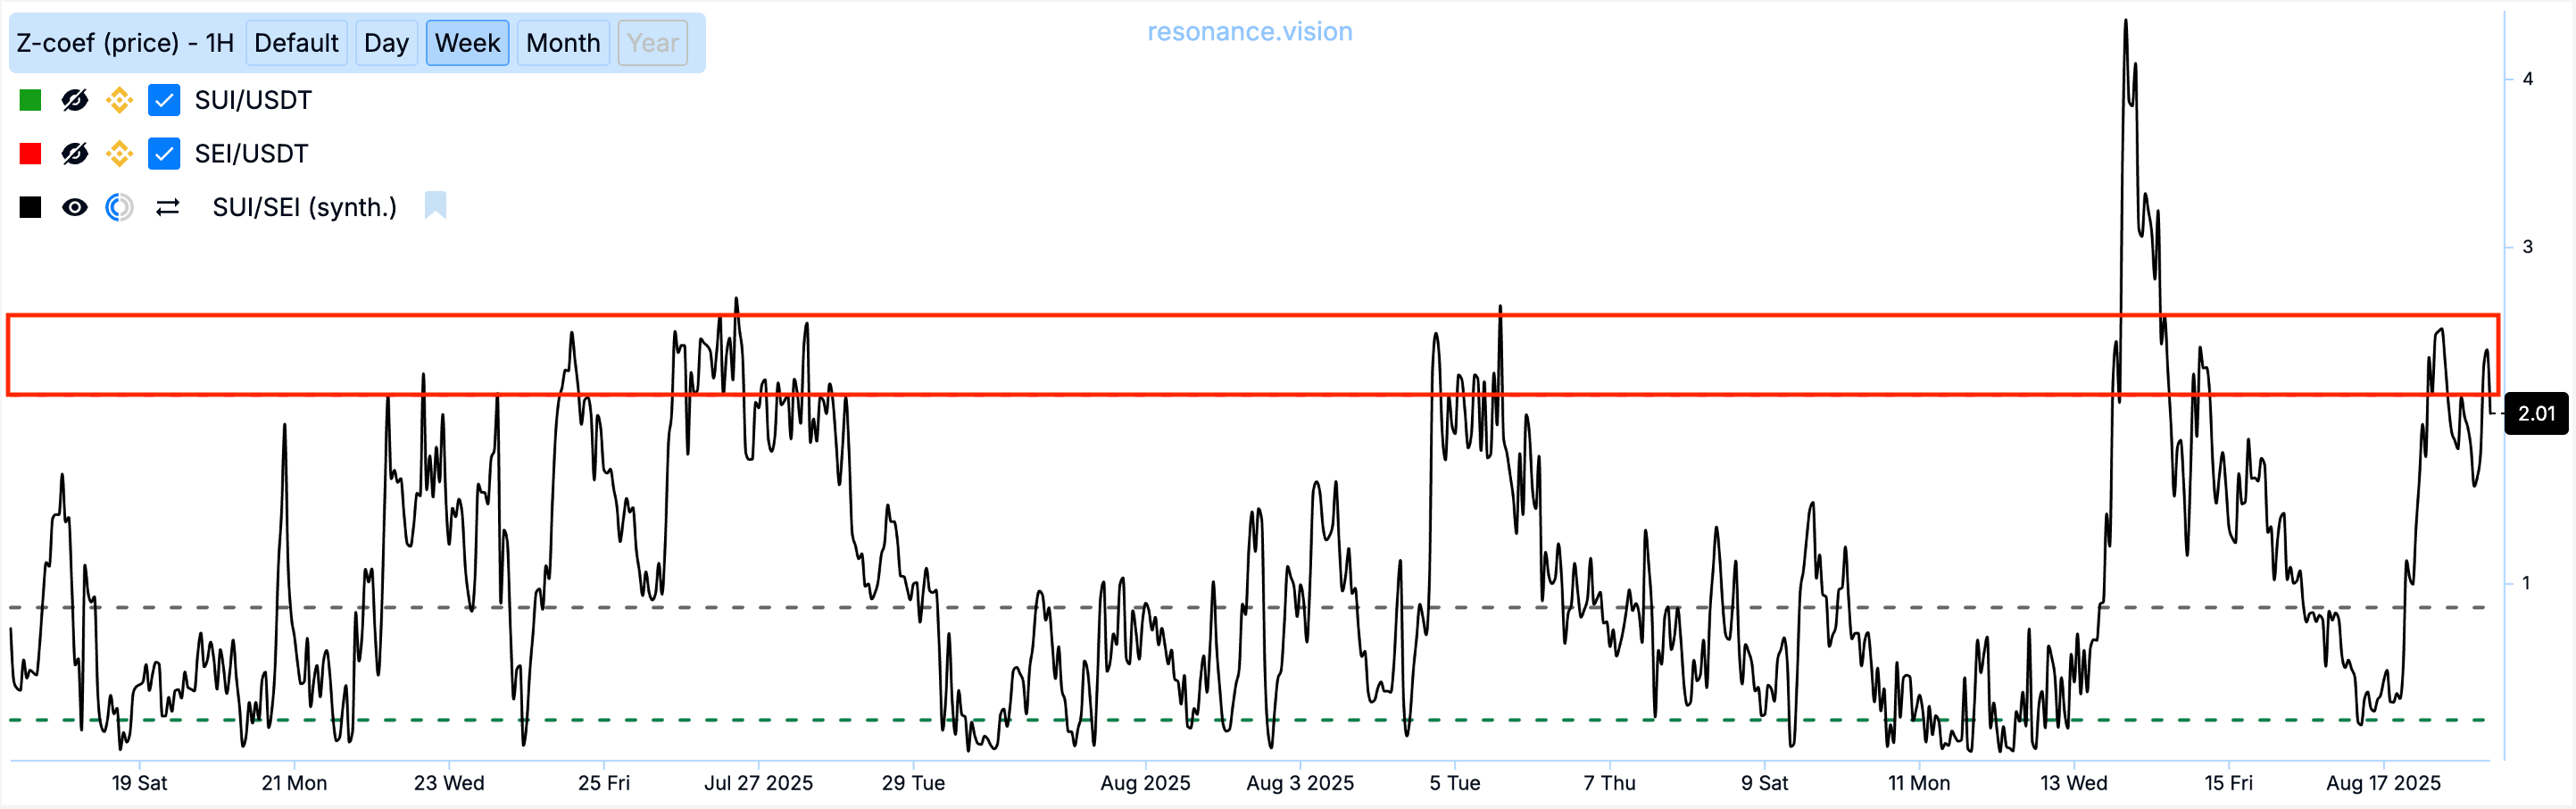
И на данный момент есть возможность открыть сделку, так как стандартное отклонение кросс-курса аномальное - 2,11.
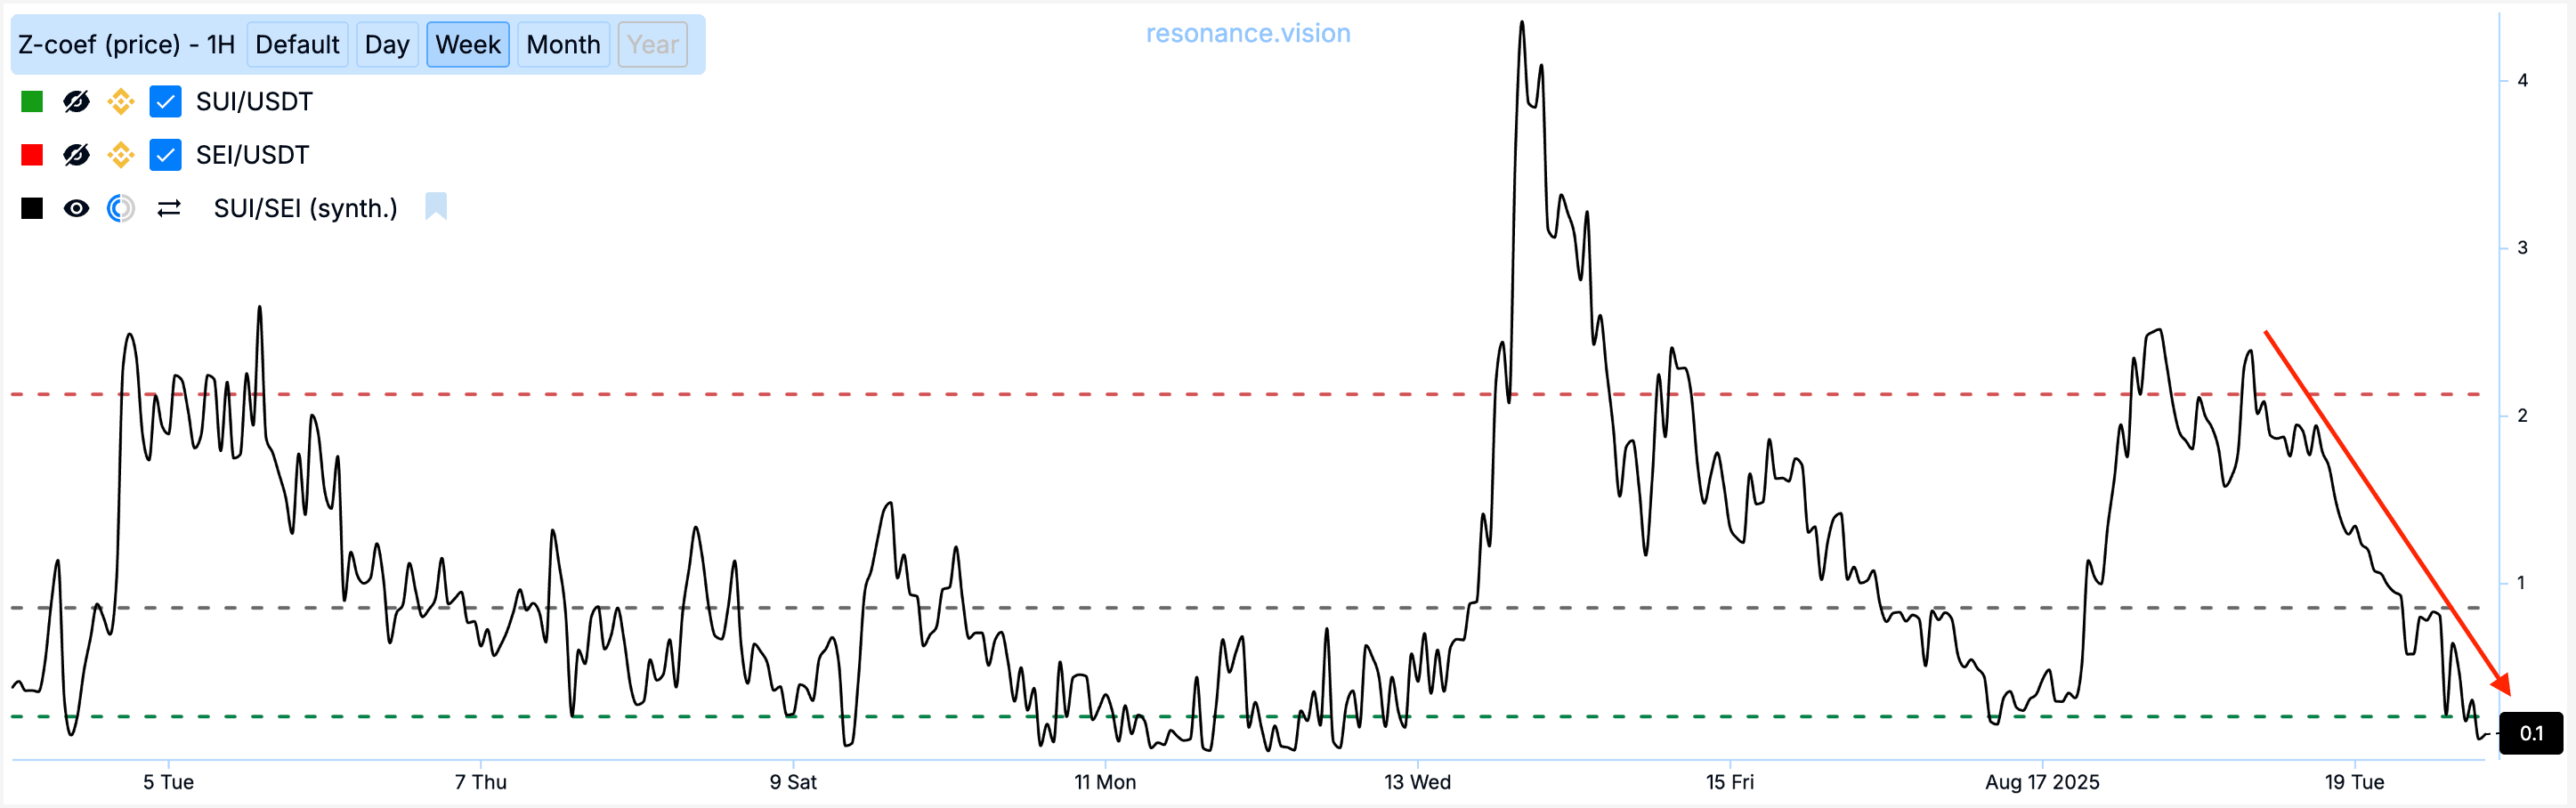
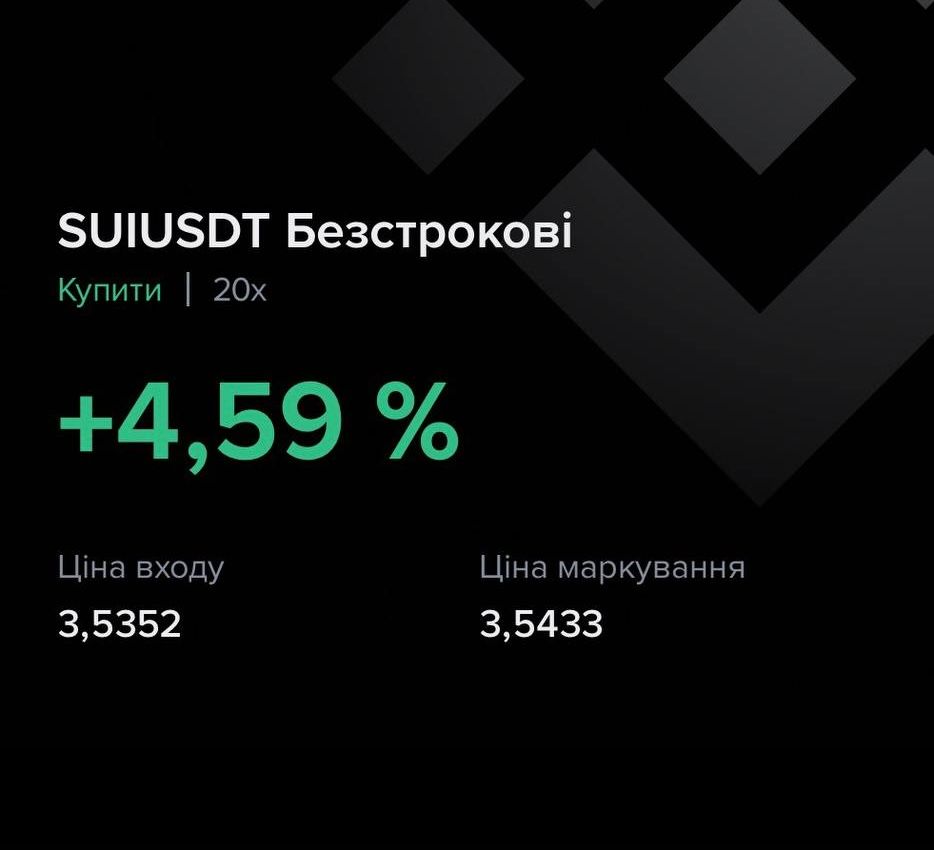
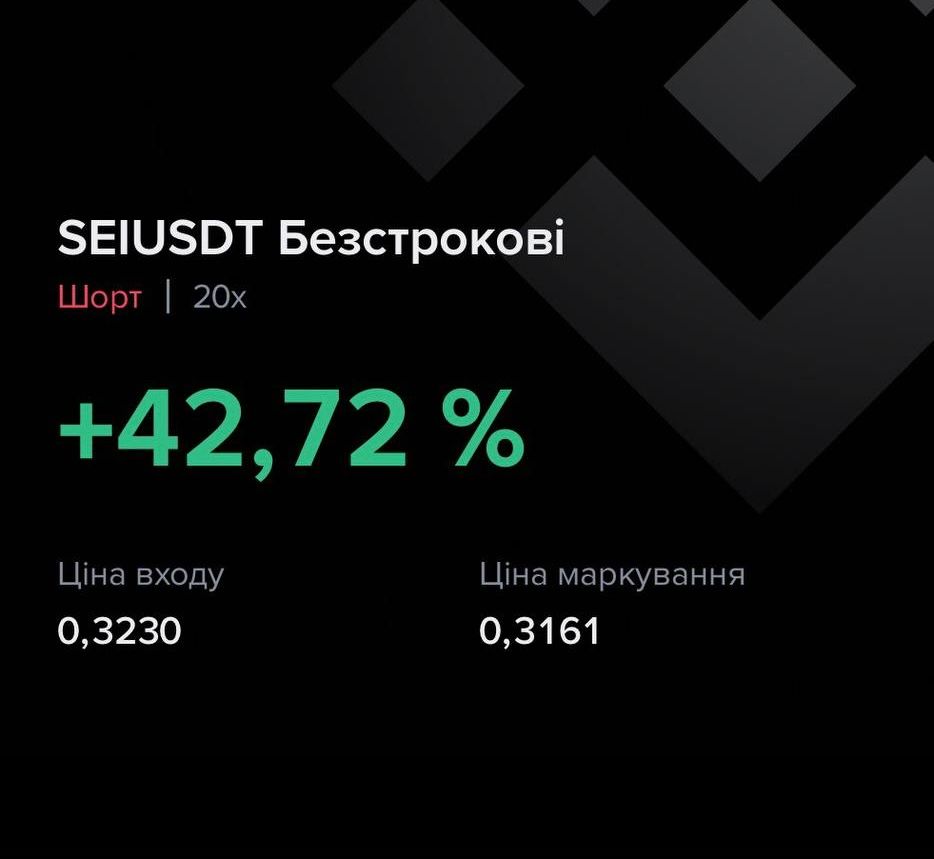
Открываем лонг по SUI/USDT и шорт по SEI/USDT. Когда стандартное отклонение возвращается к своему среднему значению 0 - закрываем обе позиции:
Результат по сделке:
Использование аналитических инструментов в парном трейдинге
Чтобы находить такие рыночные ситуации для статистического арбитража криптовалют, трейдеры используют специальные различные сервисы и аналитические инструменты, которые делают сложные расчеты автоматически и удобно их визуализируют.
Инструмент MarketDelta на платформе Resonance:
- строит кросс-курс для наглядного отслеживания динамики спреда между выбранными активами
- рассчитывает коэффициент корреляции между криптовалютами, чтобы Вы могли понять, насколько синхронно они двигаются и подходит ли связка для арбитража
- вычисляет Z-score — показатель аномальности отклонения цен от среднего, который помогает определить возможную точке входа в сделку.
- рассчитывает бета-коэффициент, который показывает соотношение волатильности между активами.
Таким образом, трейдеру не нужно вручную считать десятки показателей — всё это выполняется платформой. Ваша задача сводится к интерпретации данных и принятию решений. Автоматизация расчетов снижает вероятность ошибки и позволяет сосредоточиться на стратегии, а не на рутине.
Преимущества статистического арбитража
Статистический арбитраж криптовалют стал популярным благодаря сочетанию математического подхода и снижения рыночных рисков. Среди ключевых преимуществ:
- Независимость от направления рынка. Поскольку стратегия строится на анализе расхождений между двумя активами, прибыль можно получать как на падающем, так и на растущем рынке.
- Хеджирование рисков. Убыток по одному активу компенсируется прибылью по другому. Это снижает влияние общей волатильности криптовалютного рынка.
- Гибкость в выборе связок. Можно использовать десятки пар токенов из разных секторов — от DeFi до L1-блокчейнов. Это открывает широкие возможности для поиска рабочих идей.
- Опора на статистику, а не эмоции. Решения принимаются не по новостям в соцсетях, а на основе конкретных чисел: корреляции, стандартного отклонения, бета-коэффициента.
- Применимость для разных горизонтов. Стратегия подходит как для внутридневной торговли, так и для среднесрочных идей, если есть историческая стабильная корреляция и фундаментальная взаимосвязь активов.
Таким образом, статистический арбитраж на рынке криптовалют помогает трейдерам действовать системно и снижает зависимость от рыночных настроений.
Риски и ограничения
Несмотря на очевидные преимущества, арбитраж на рынке криптовалют не лишён уязвимостей. Чтобы стратегия работала эффективно, трейдер должен учитывать возможные риски:
- Разрыв корреляции. Даже исторически связанные активы могут перестать двигаться синхронно. Причина — фундаментальные изменения в проекте, новости, делистинги и т.д… В этом случае связка теряет смысл и может привести к убыткам.
- Большая разница в волатильности у активов. Если один токен реагирует на рынок сильнее другого, позиции перестают быть сбалансированными.
- Ошибки анализа. Статистика показывает лишь прошлое поведение активов, а не гарантирует будущее. Выбор пар только на основе корреляции может привести к убыткам. Поэтому, фундаментальная взаимосвязь при выборе пары обязательна.
- Риск-менеджмент. В парном трейдинге риск-менеджмент - отдельная тема. Есть множество вариантов ограничения убытков. Вы должны четко прописать условия, при которых будете закрывать сделку в убыток. Эту тему мы будем рассматривать в других статьях.
Таким образом, статистический арбитраж криптовалют требует дисциплины и скрупулезного подбора монет для пар.
Итоги
Статистический арбитраж криптовалют — это стратегия, которая опирается не на эмоции и новости, а на математику и исторические данные. Она позволяет анализировать корреляцию, бета-коэффициент и кросс-курсы, а значит — принимать более взвешенные решения.
Главное преимущество в том, что статистический арбитраж на рынке криптовалют остается прибыльным вне зависимости от направления движения рынка. При грамотном подборе пары и использовании аналитических инструментов трейдер получает возможность контролировать риски и стабильно зарабатывать даже в условиях высокой волатильности.
Современные платформы, сервисы и инструменты, такие как MarketDelta от Resonance, помогают искать эффективные связки и ускоряют процесс анализа. Это делает стратегию доступной не только для профессионалов, но и для тех, кто хочет развиваться в криптотрейдинге системно.
Следи за новыми статьями в нашем телеграм канале.
Не нужно выдумывать сложных схем и искать “грааль”. Используй инструменты платформы Resonance.
Регистрируйся по ссылке — получай бонус и начинай зарабатывать:
OKX | BingX.
Промокод TOPBLOG дает тебе 10% скидки на любой тарифный план Resonance.
Парный трейдинг упрощается, когда у трейдера есть правильные инструменты для арбитража криптовалют. Современные инструменты для арбитража криптовалют позволяют эффективно искать связки, отслеживать отклонения и контролировать риски. Чтобы работать быстрее, многие используют боты для арбитража криптовалют или специализированные программы для арбитража, но становится вопрос анализа этих пар. Но самый лучший вариант - это отбор монет под статистический арбитраж согласно твоей стратегии. Ведь автоматический арбитраж зачаастую не учитывает анализ объемов. Платформа Резонанс разрабатывает сканер для арбитража, который поможет искать связки согласно стратегии и превратить парный трейдинг в устойчивый источник заработка даже на волатильном крипторынке.
Рекомендуемые статьи


