Пін-бари в трейдингу: сигнал розвороту ціни для прибуткових угод

Пін-бар — один із найпопулярніших розворотних сигналів, але переважна більшість трейдерів читає його неправильно. У цій статті ми розберемо, що насправді стоїть за довгою тінню свічки, як визначити робочий пін-бар і чому він є лише тригером уваги, а не командою входити в угоду. Ви дізнаєтеся, як професіонали використовують кластерний аналіз та алгоритми Resonance, щоб знаходити реальні ринкові аномалії та торгувати усвідомлено, а не навмання.
Зміст

Пін-бари давно стали одним із найвпізнаваніших елементів свічкового аналізу в трейдингу криптовалют. Але поки новачки бачать у них готові сигнали «купити» або «продати» і створюють пін-бар стратегії, досвідчені трейдери використовують їх інакше — як вказівник на те, що в певній зоні ринок зіткнувся з сильним опором.
Справжній пін-бар патерн — це слід боротьби попиту та пропозиції, яку можна визначити на кластерному графіку, а підтвердити тільки через об’єми, дельту та структуру бару. Як визначити бичачий і ведмежий сценарій? Давайте розбиратися!
Що таке пін-бар і чому він працює в реальному ринку
Пін-бар — це свічка з маленьким тілом і довгою тінню, яка показує момент різкого відторгнення ціни всередині бару. Спочатку ринок рухається в один бік, але потім зустрічна сторона чинить опір, повністю змінюючи підсумковий напрямок руху ціни. Пін-бар фіксує саме той момент, коли імпульс не вдався.
Класичний пін-бар складається з трьох візуальних елементів:
- Тіло — невеликий діапазон між відкриттям і закриттям; воно відображає, яка сторона утримала ціну до завершення бару.
- Хвіст — довга тінь, що показує зону хибного руху, де ціну «витолкали» назад.
- High/Low — крайні точки, в яких відбувалася боротьба і де сформувався максимум тиску.
Ця структура нібито допомагає визначити, куди ринок намагався рухатися і де зіткнувся з опором.
Вважається, що:
- Якщо хвіст спрямований вниз — це бичачий сценарій.
- Якщо хвіст спрямований вгору — це ведмежий сценарій у трейдингу.
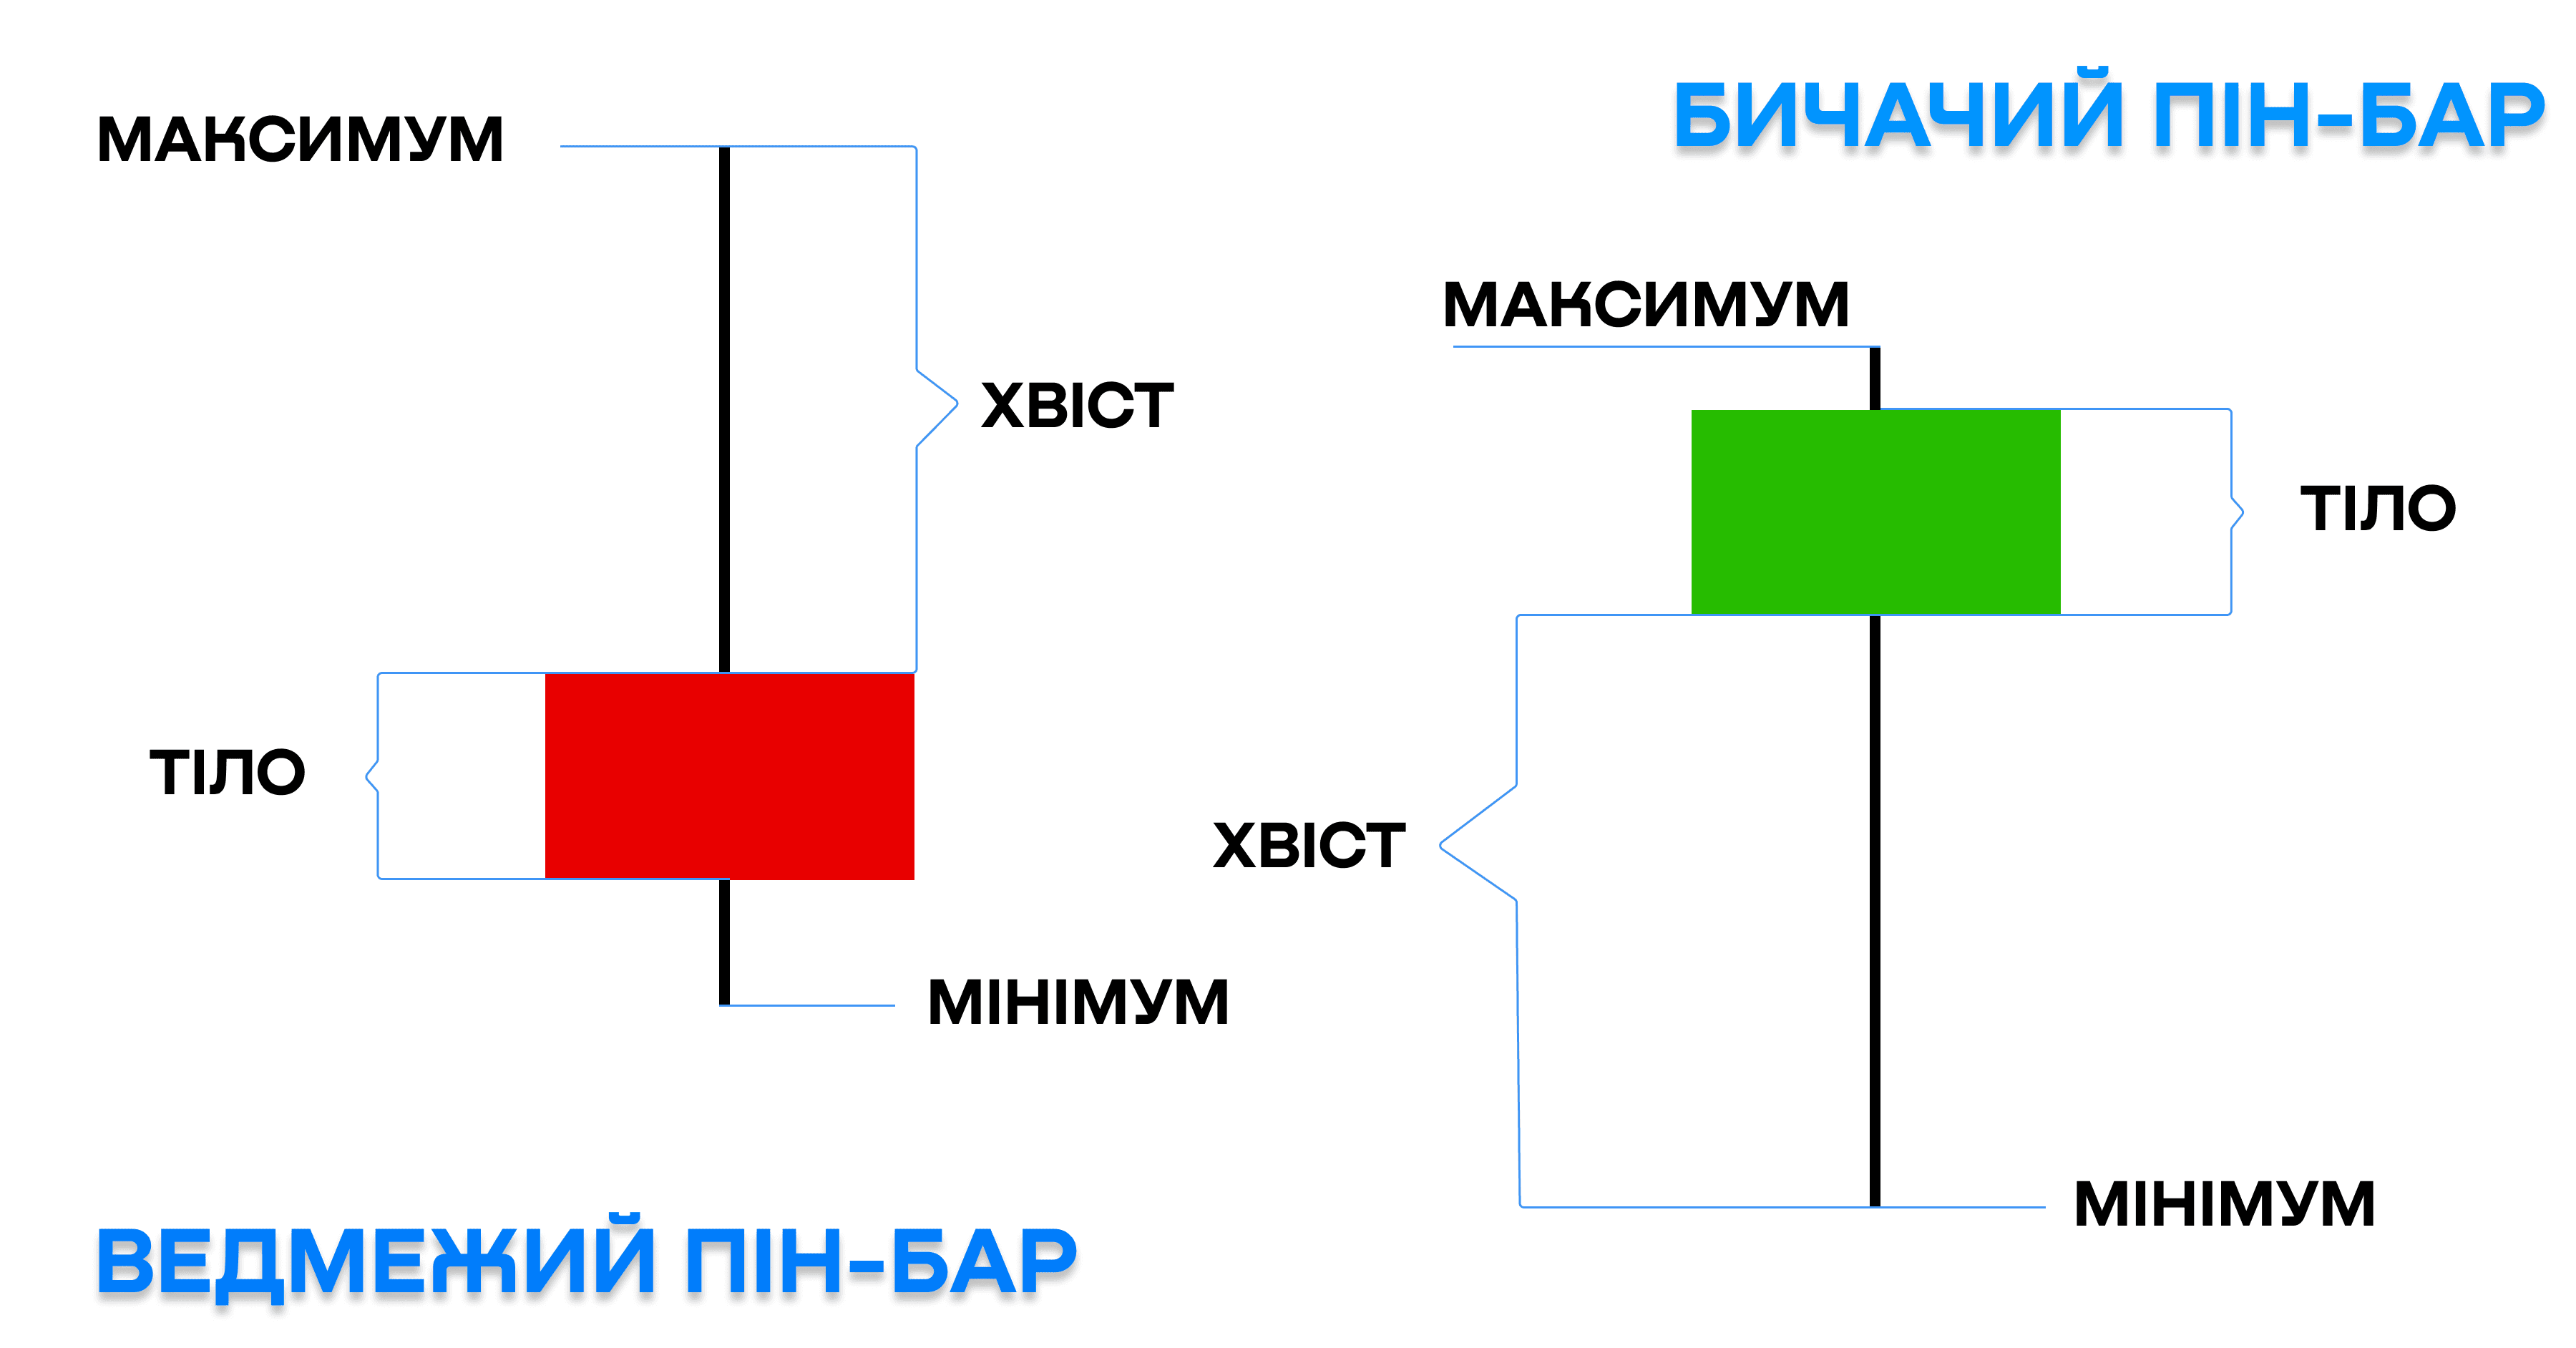
Пін-бар дійсно легко помітити: співвідношення хвоста до тіла мінімум 3:1.
Але в трейдингу криптовалют важливо вміти відрізнити робочий сигнал від свічки, яка лише зовні схожа на нього. Досвідчені трейдери дивляться не стільки на форму свічки, скільки на контекст і характер боротьби учасників ринку:
- Пін-бари з’являються на екстремумах. Саме там найчастіше спрацьовують емоції: більшість входить на ринок пізно, часто на FOMO, намагаючись наздогнати рух за трендом.
- У хвості мають бути реальні об’єми. Довга тінь сама по собі не означає розворот. Важливий факт, що в цій зоні пройшли великі об’єми угод — саме вони підтверджують, що рух зупинився не випадково. Якщо об’єми відсутні, тінь може бути наслідком низької ліквідності або збігу обставин, а не реальної боротьби між покупцями та продавцями.
Які пін-бари вважаються робочими з точки зору об’ємів?
Сила пін-бара визначається не формою, а тим, що відбувалося з об’ємами до виникнення пін-бара, всередині хвоста свічки та після того, як вона утворилася.
Гідним уваги вважається тільки той бар, у якому в зоні утворення тіні свічки видно скупчення об’єму, що відповідає напрямку цінового відторгнення:
- Якщо хвіст знизу — у нижній частині свічки мають бути великі лімітні покупки, що поглинули потік ринкових продажів. Це означає, що лімітні ордери прийняли весь об’єм, який тиснув ціну вниз, і саме тут сформувався локальний дефіцит пропозиції.
- Якщо хвіст зверху — у верхній частині свічки має з’являтися значний об’єм лімітних продажів, який зупинив спробу покупців просунути ціну вище. Це говорить про те, що лімітні продавці створили локальний профіцит і поглинули попит.
Таким чином, робочий пін-бар — це не свічка правильної форми, а бар, наповнений змістом: у хвості зафіксовано реальне протистояння учасників, достатнє для зміни локального балансу.
Колір, форма чи симетрія не мають особливого значення.
Має значення тільки одне — об’єми, що підтверджують відторгнення ціни саме в цій зоні.
Механіка формування пін-бара
Пін-бар у трейдингу не можна розглядати як самостійний сигнал. Справжній робочий патерн визначається не зовнішнім виглядом, а тим, що змінюється поведінка учасників. Щоб зрозуміти його сенс, важливо визначити, як ринок переходить від інертного руху за трендом до опору і далі — до розвороту.
Будь-який трендовий рух ґрунтується на простому принципі: коли ринок зростає — більшість учасників купує, коли падає — продає. Це і створює потік ринкових ордерів у бік існуючого руху.
Однак у певний момент цей потік ринкових ордерів стикається з великими лімітними учасниками.
Процес виглядає так:
- Ціна продовжує йти за трендом, і більшість учасників підтримує цей рух своїми угодами.
- У зоні опору стоять сильні контрагенти, які не слідують руху, а приймають вхідні ринкові ордери в свої лімітні.
- Вони поглинають весь потік ринкових угод, який раніше відносно безперешкодно рухав ціну.
- Тиск трендової сторони вичерпується: ринок перестає оновлювати максимум або мінімум.
- Коли потік заявок повністю впирається в лімітні ордери, відбувається різкий відскок.
- Цей різкий повернення і формує хвіст пін-бара — слід того, що рух зупинили «силою».
Це факт фіксації конкретного зіткнення об’ємів, інтересів різних учасників ринку.
Отже, пін-бар патерн значущий тільки тоді, коли відображає реальну зміну фази ринку: момент, коли одна сторона перестала рухати ринок, а інша стала здатна зупинити рух і розвернути його.
Що реально показує пін-бар як індикатор?
Пін-бар не каже, куди «повинна» піти ціна. Він лише вказує на факт:
- де стався конфлікт ліквідності;
- де лімітні учасники поглинули потік ринкових заявок;
- де трендовий рух утратив силу;
- де ринок перейшов (або готується перейти) від профіциту до дефіциту (або навпаки).
По суті, свічка заявляє:
«Ось тут сильна сторона проявила себе. Це не означає, що буде розворот, але це точка, яку необхідно перевірити далі».
Саме тому пін-бар — не торговий сигнал для трейдингу, а тригер уваги, який вимагає перевірки об’ємами, дельтою та контекстом ринку, а потім уже інтеграції у вашу торгову стратегію.
Якщо у вас немає своєї стратегії, то міні-навчання від Aires дасть вам необхідну базу, щоб торгувати напрямкову стратегію.
Найкращий пін-бар індикатор: швидкий пошук свічок із ознаками розвороту
Розуміння механіки пін-бара — це лише половина завдання. Якщо ви хочете торгувати багато різних активів, то важливо вміти знаходити такі ситуації швидко, відсіювати шум і аналізувати тільки ті точки, де дійсно могло статися зіткнення великих об’ємів. Саме для цього в Resonance створено алгоритм FTT (Fast Trigger Tool) та його агрегатор — FTT Index.
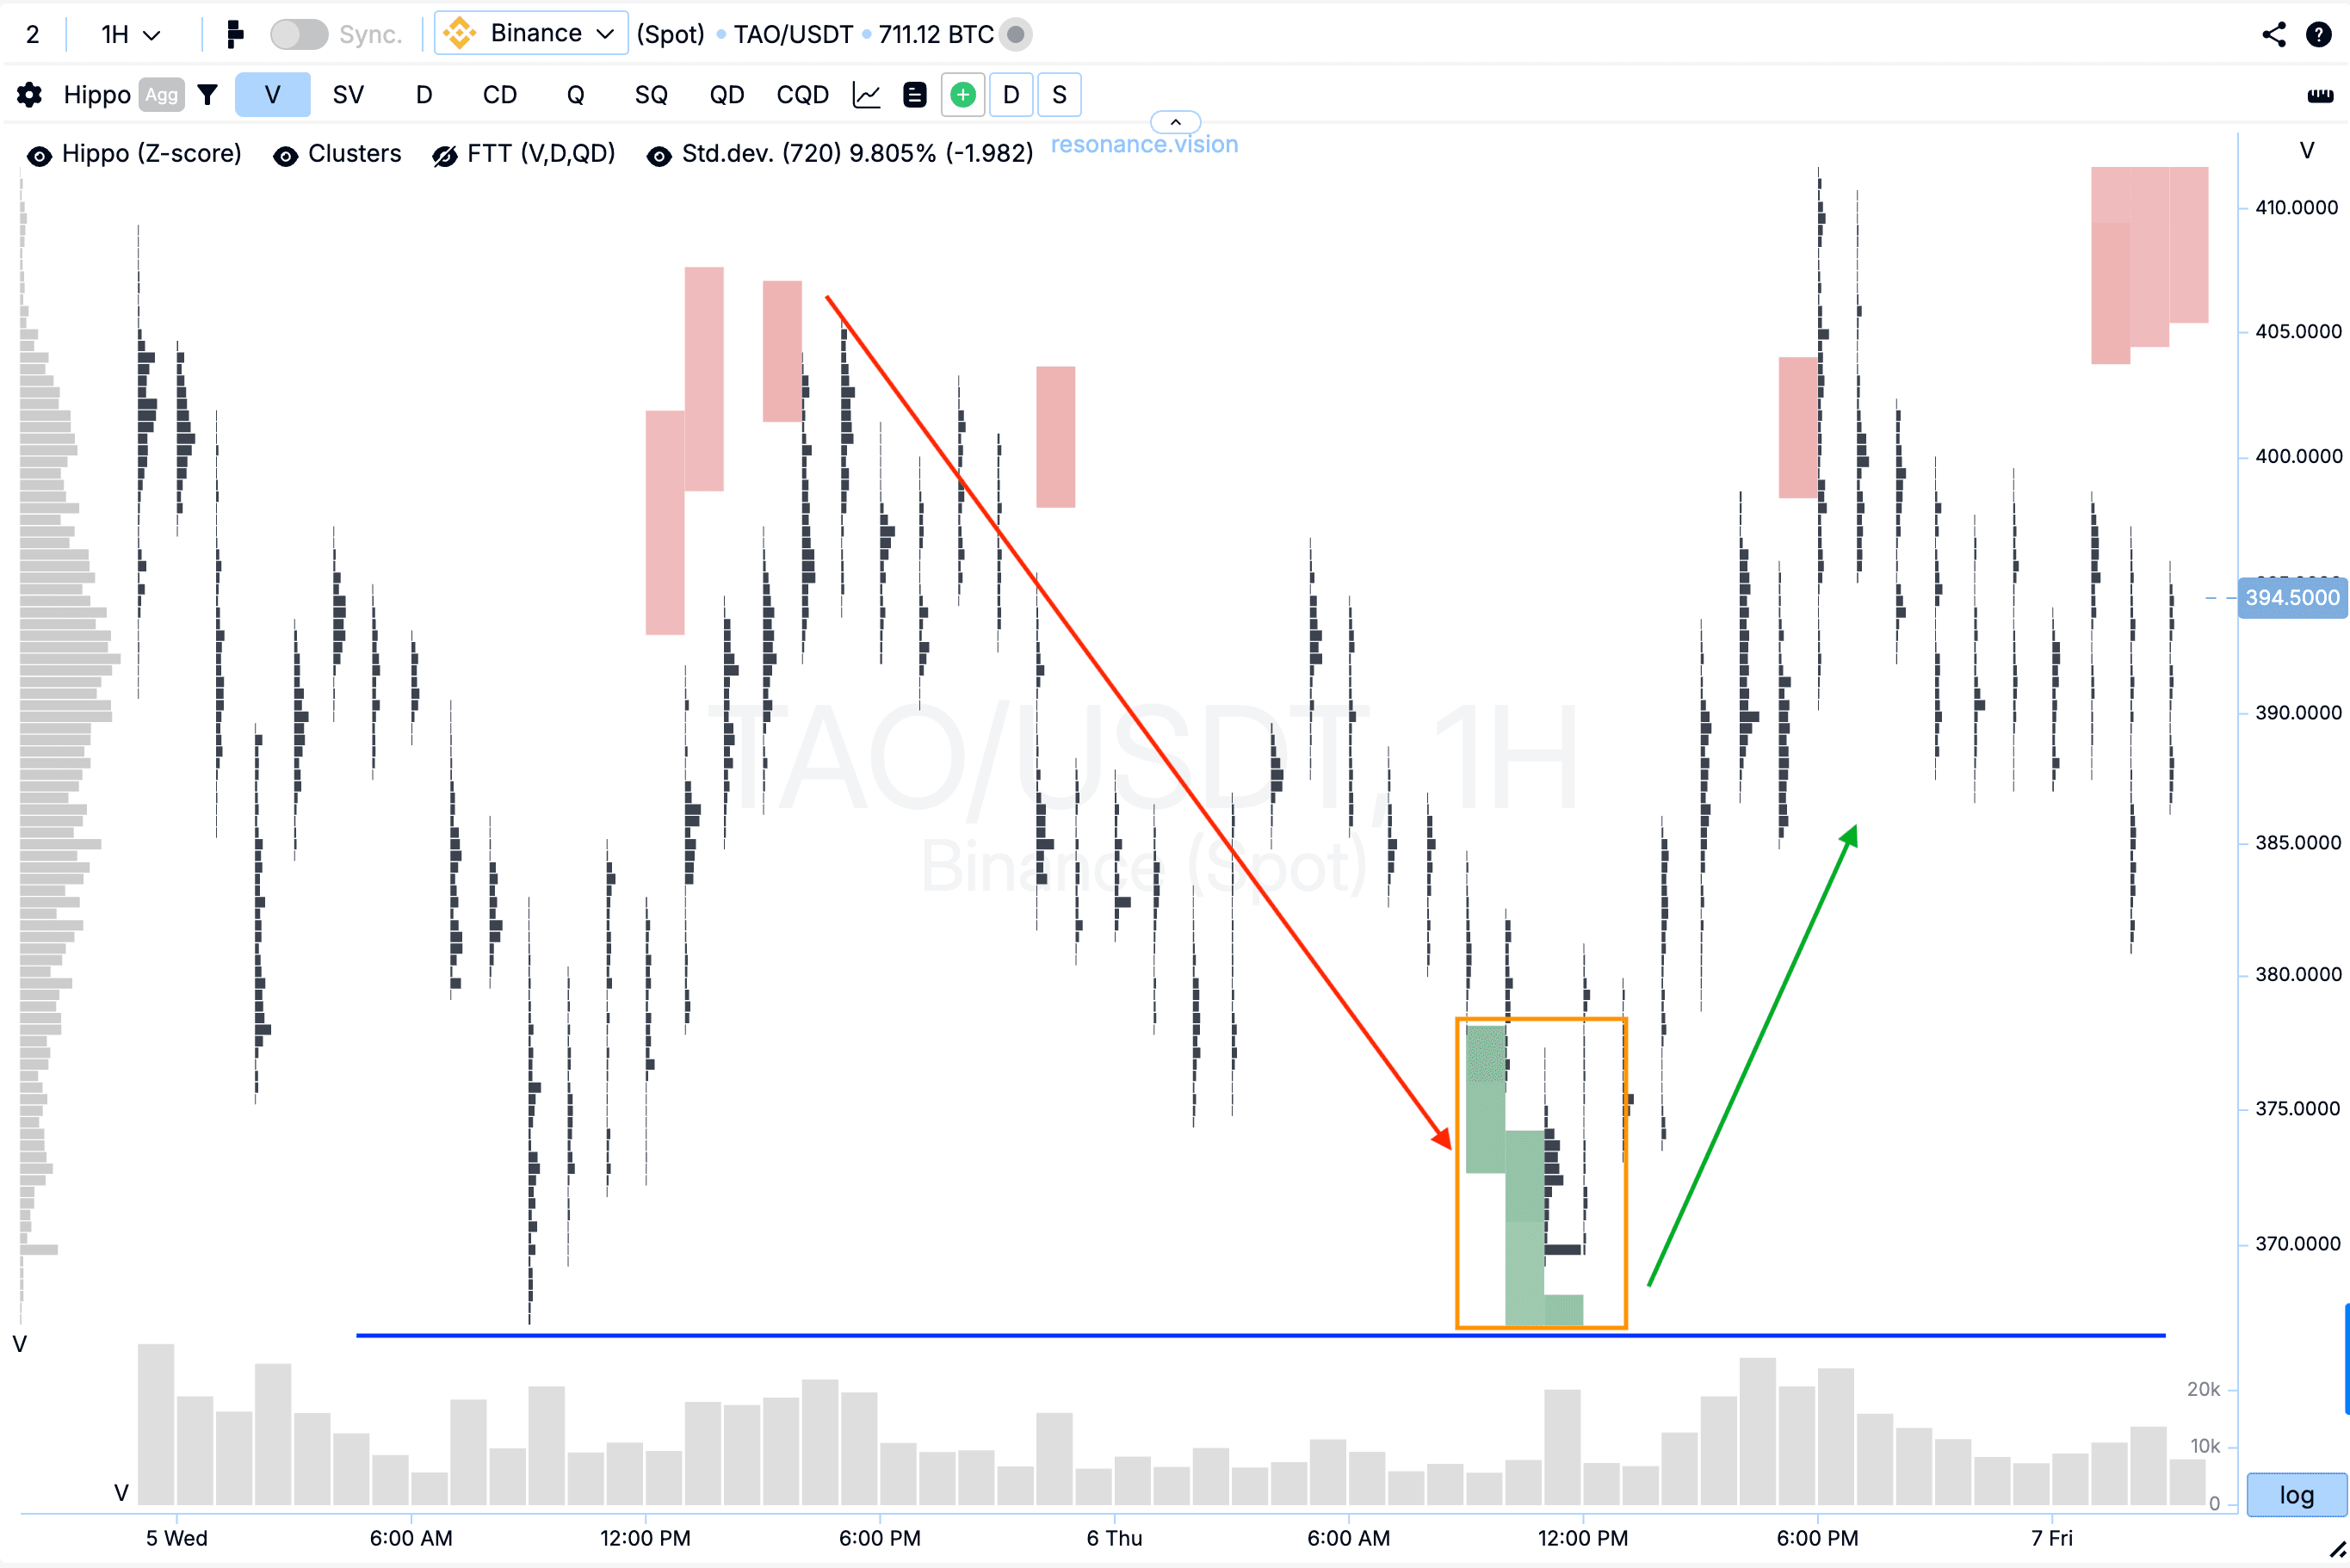
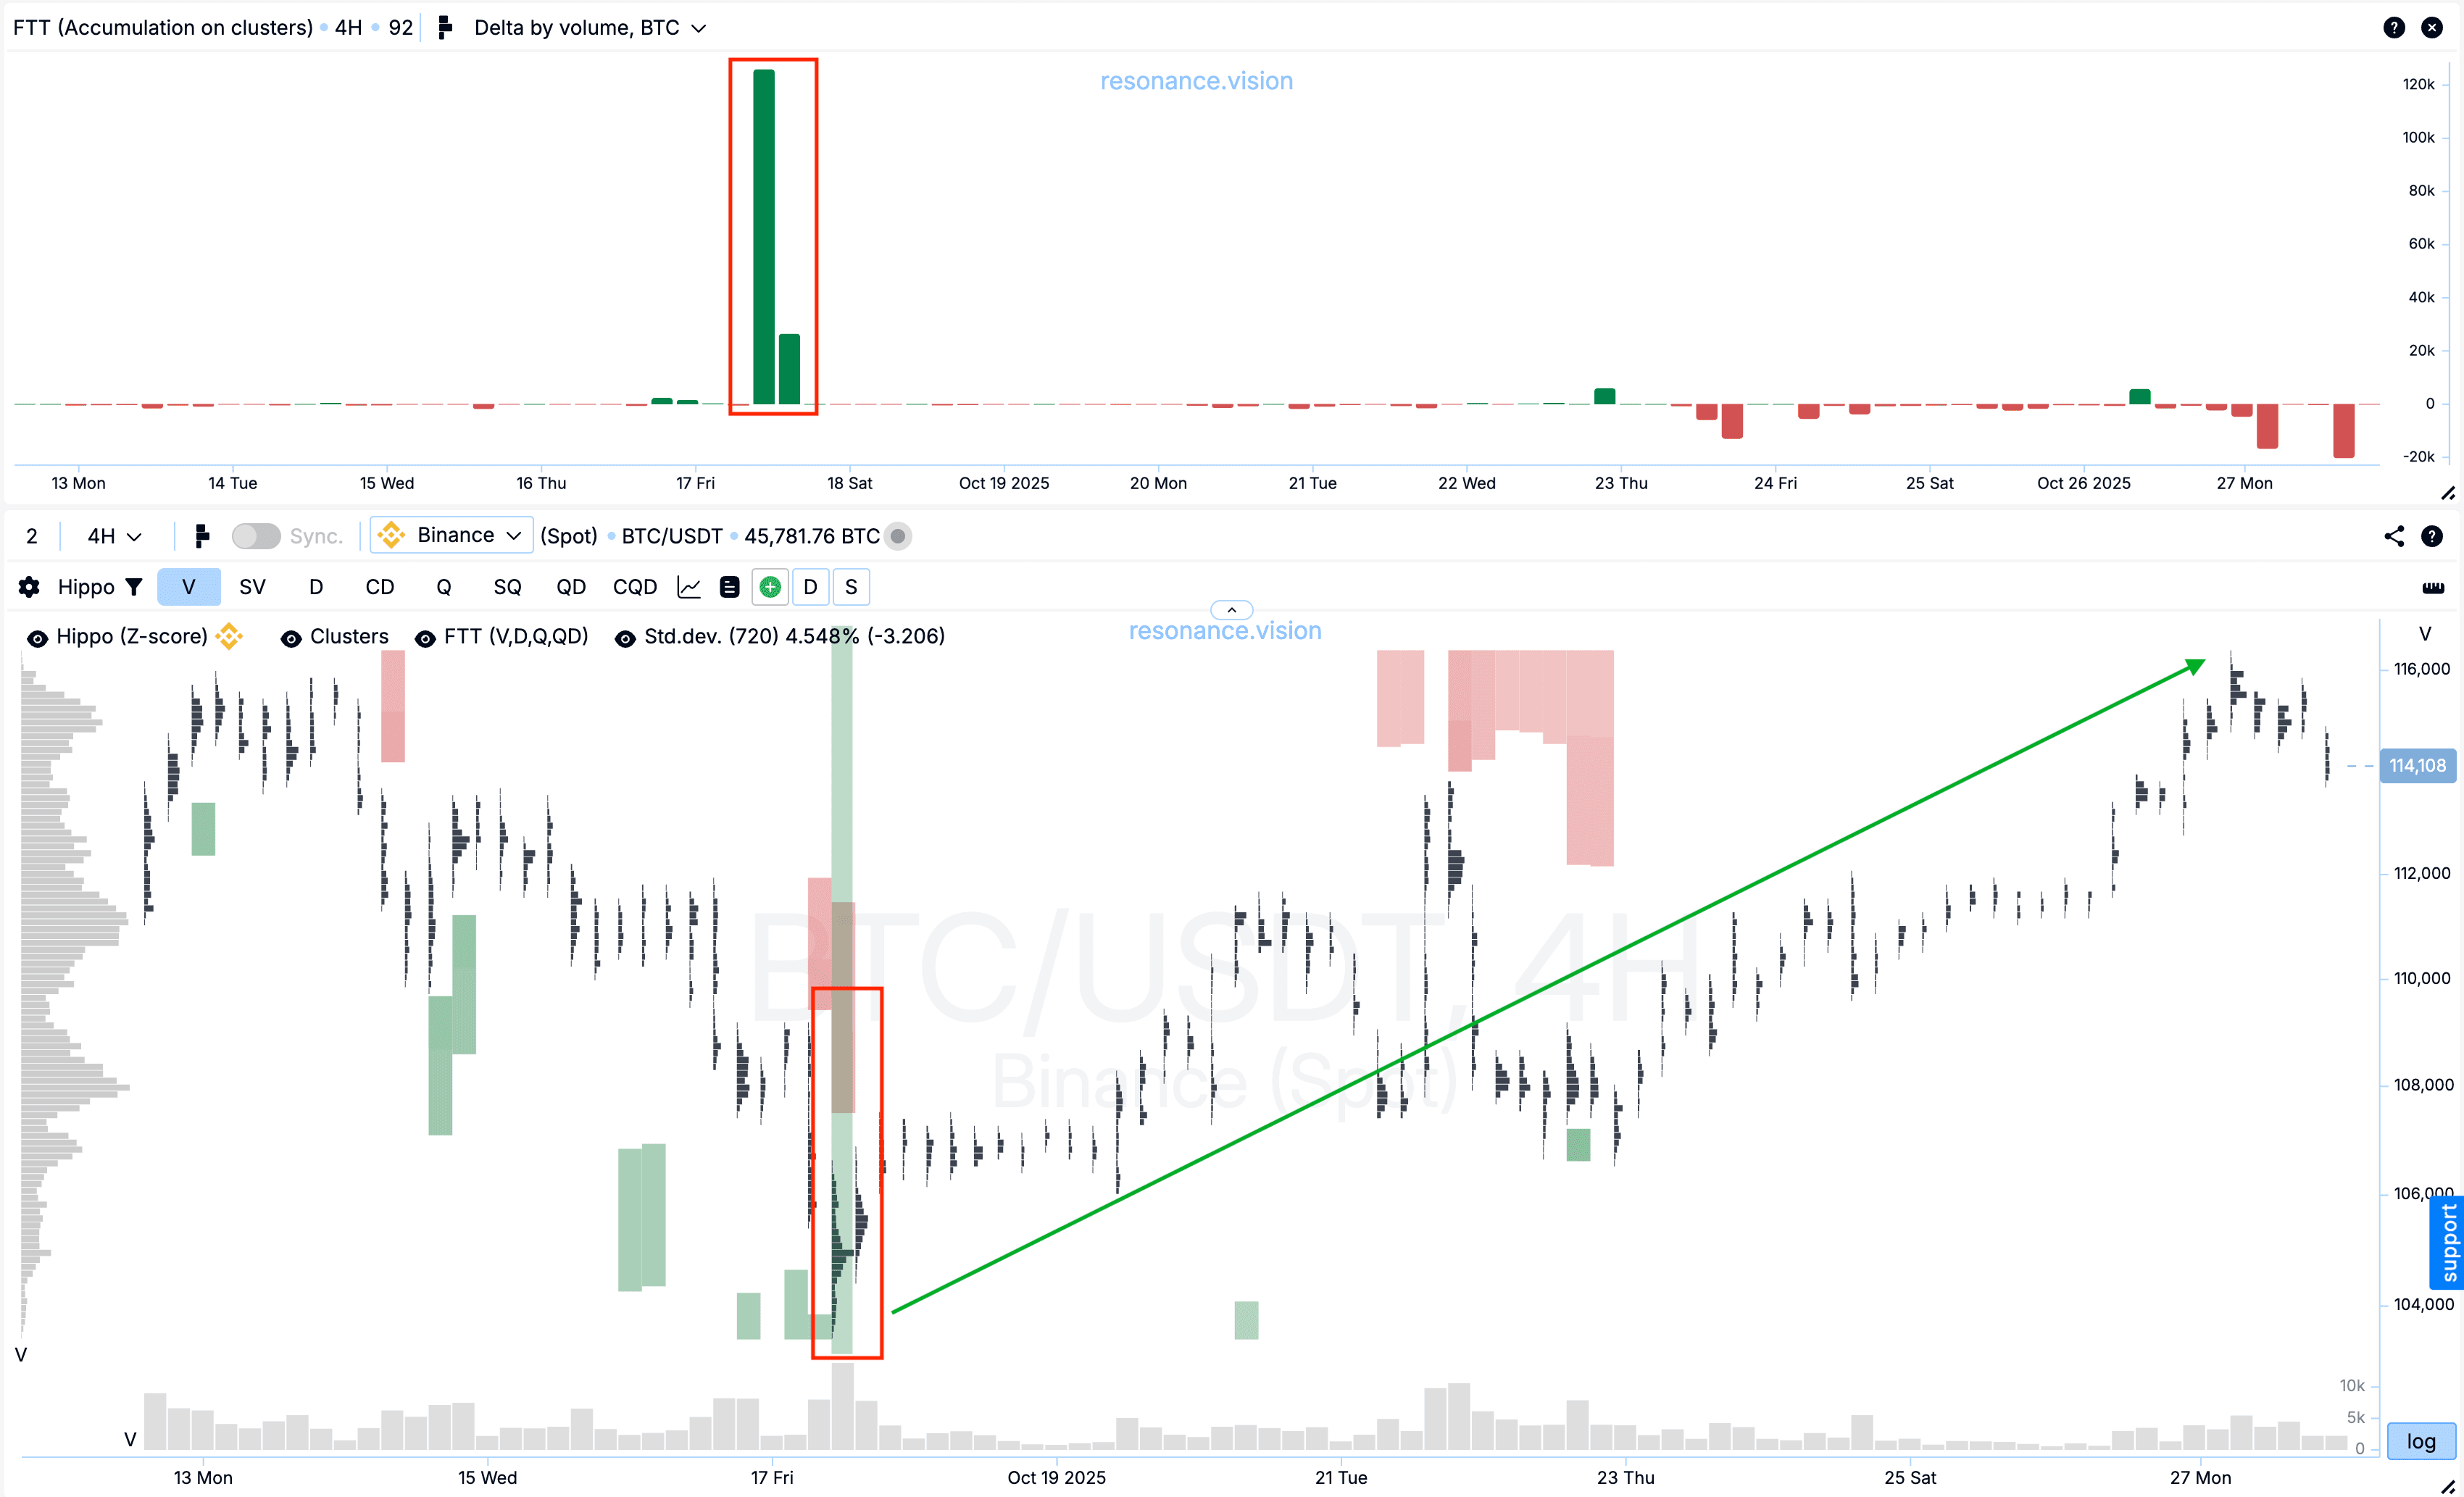
FTT автоматично скринить кластерні графіки і шукає місця, де ціна зупиняється на локальних мінімумах і максимумах, а в хвості пін-бара були проторговані великі об’єми — явні сліди зіткнення великих гравців.
У таблиці FTT ви відразу бачите:
- за якими тікерами та на яких біржах зараз є такі скупчення об’ємів;
- де саме вони з’явилися — внизу чи вгорі бару;
- на яких таймфреймах і за якими типами даних були знайдені аномалії.

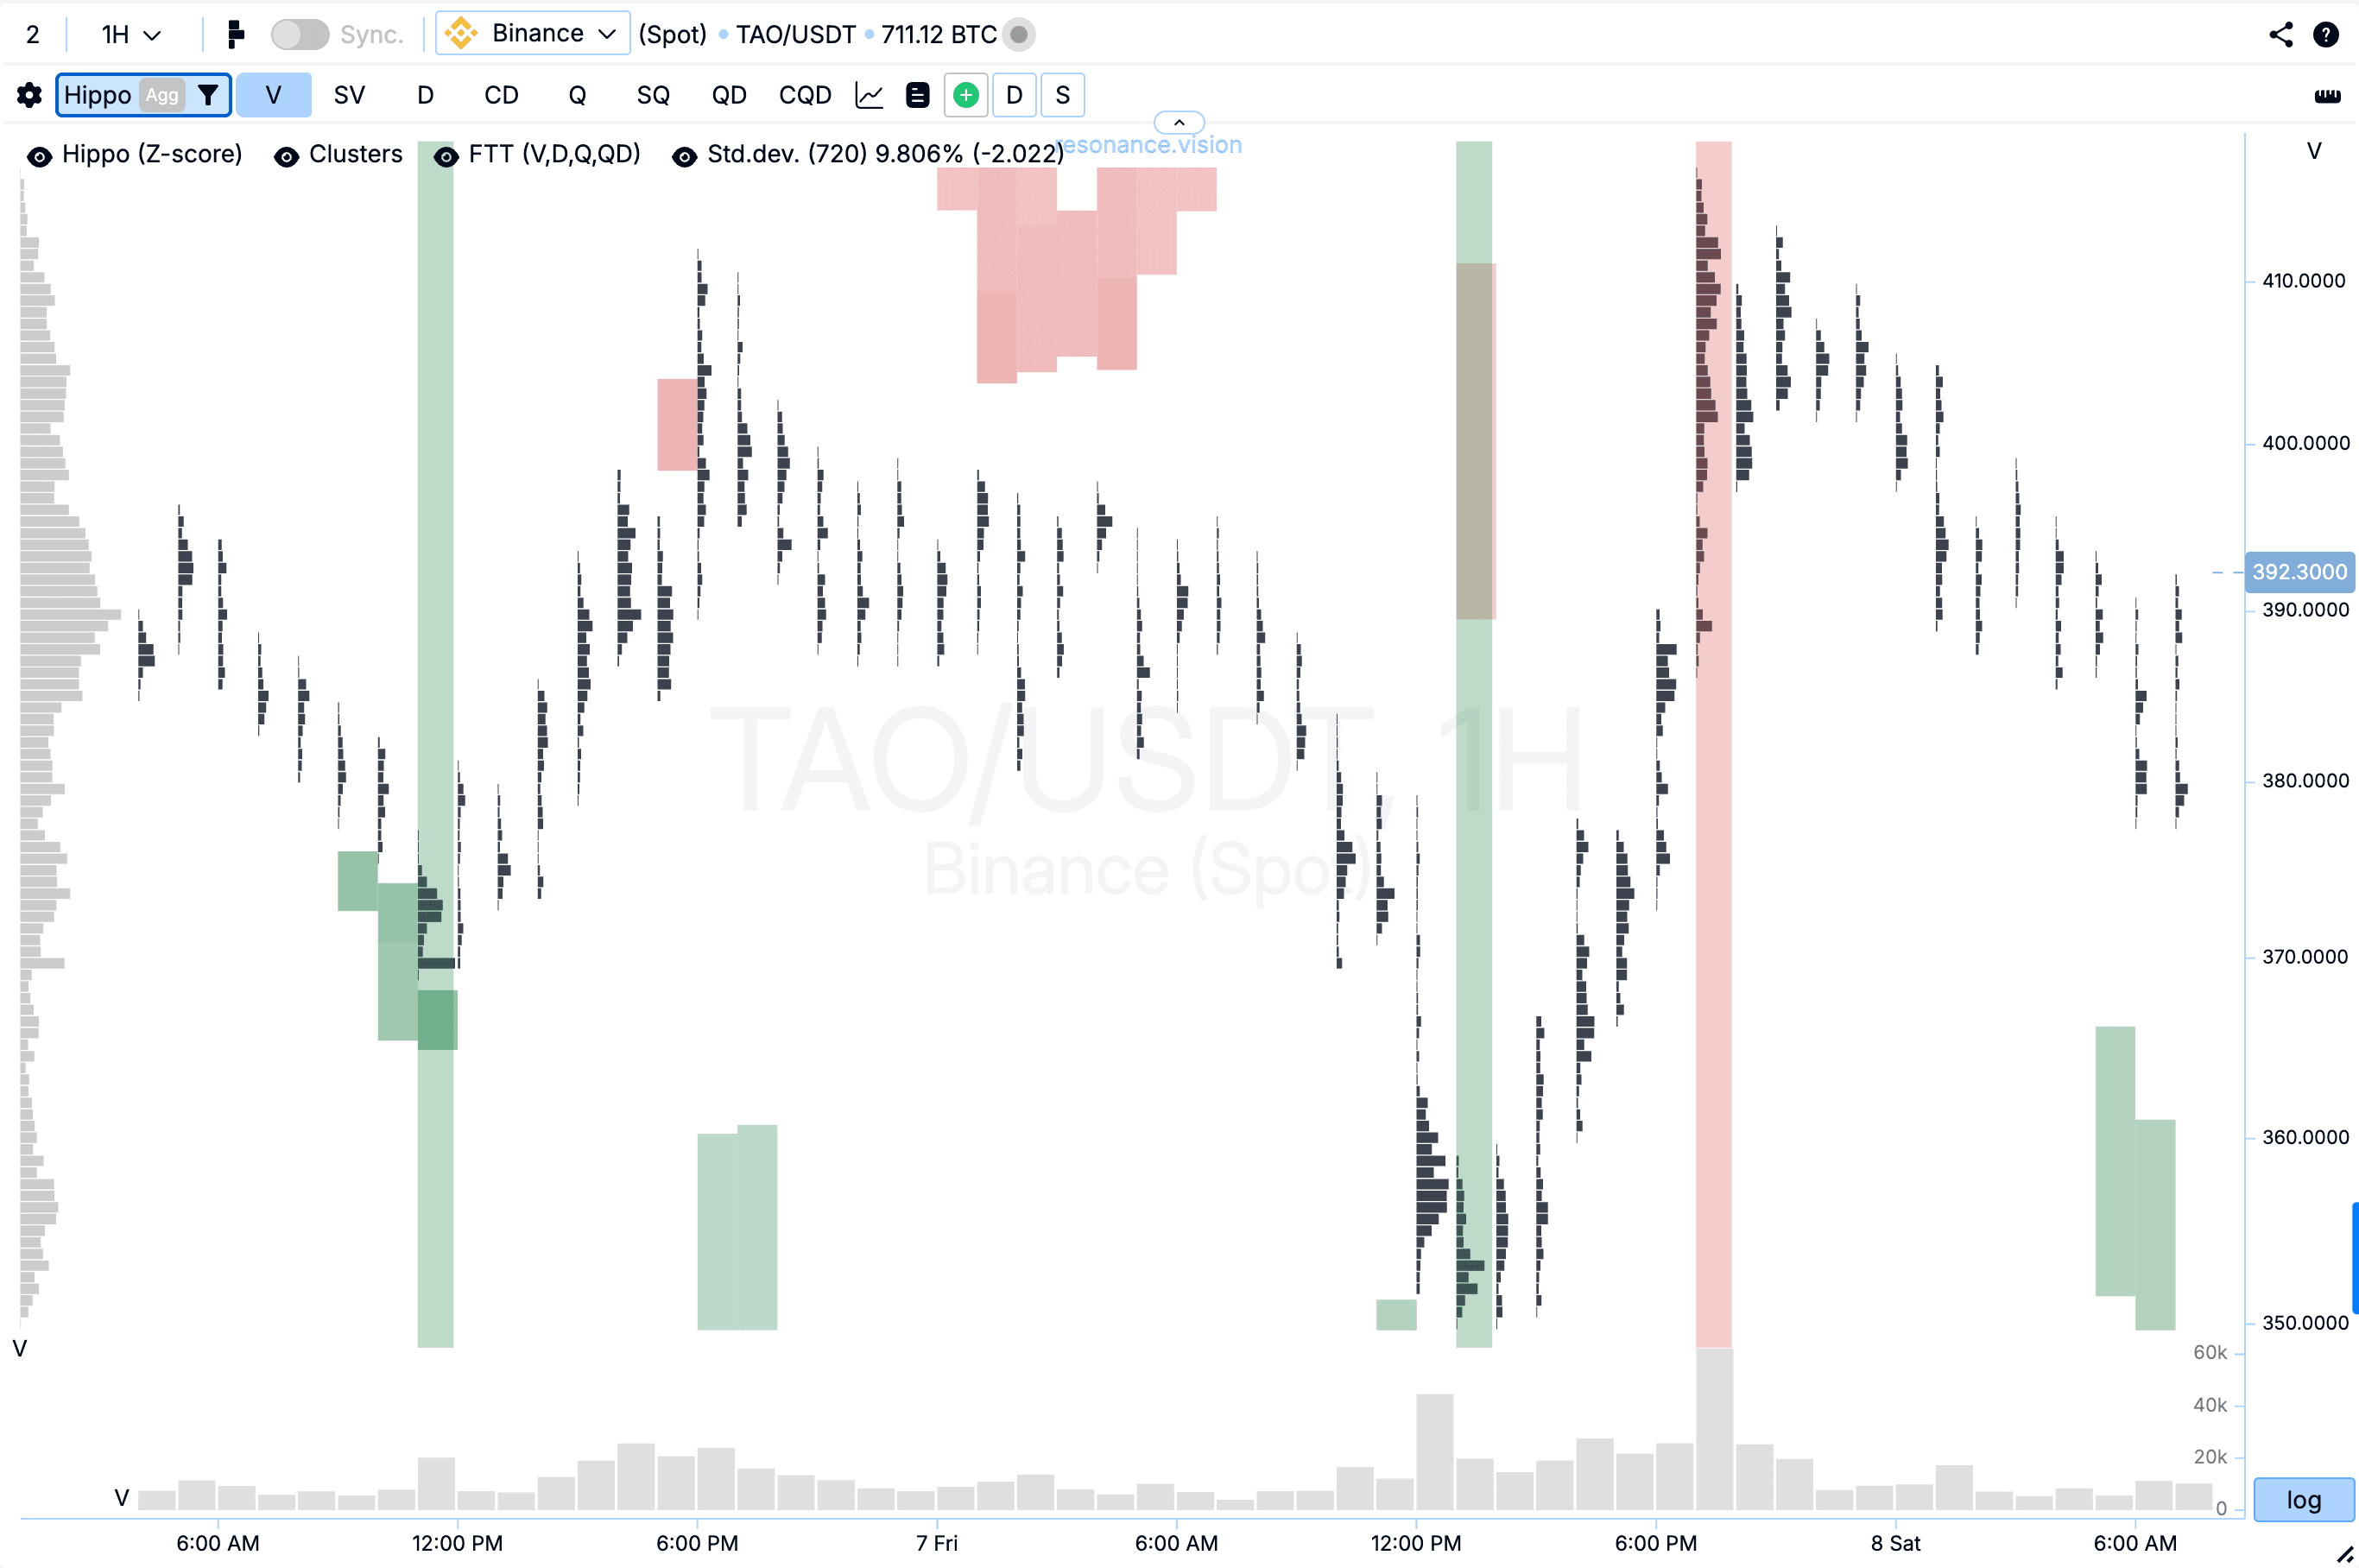
На кластерному графіку ці зони підсвічуються вертикальними лініями:
- зелені — накопичення біля локальних мінімумів (викуп знизу);
- червоні — накопичення біля локальних максимумів (розвантаження зверху).
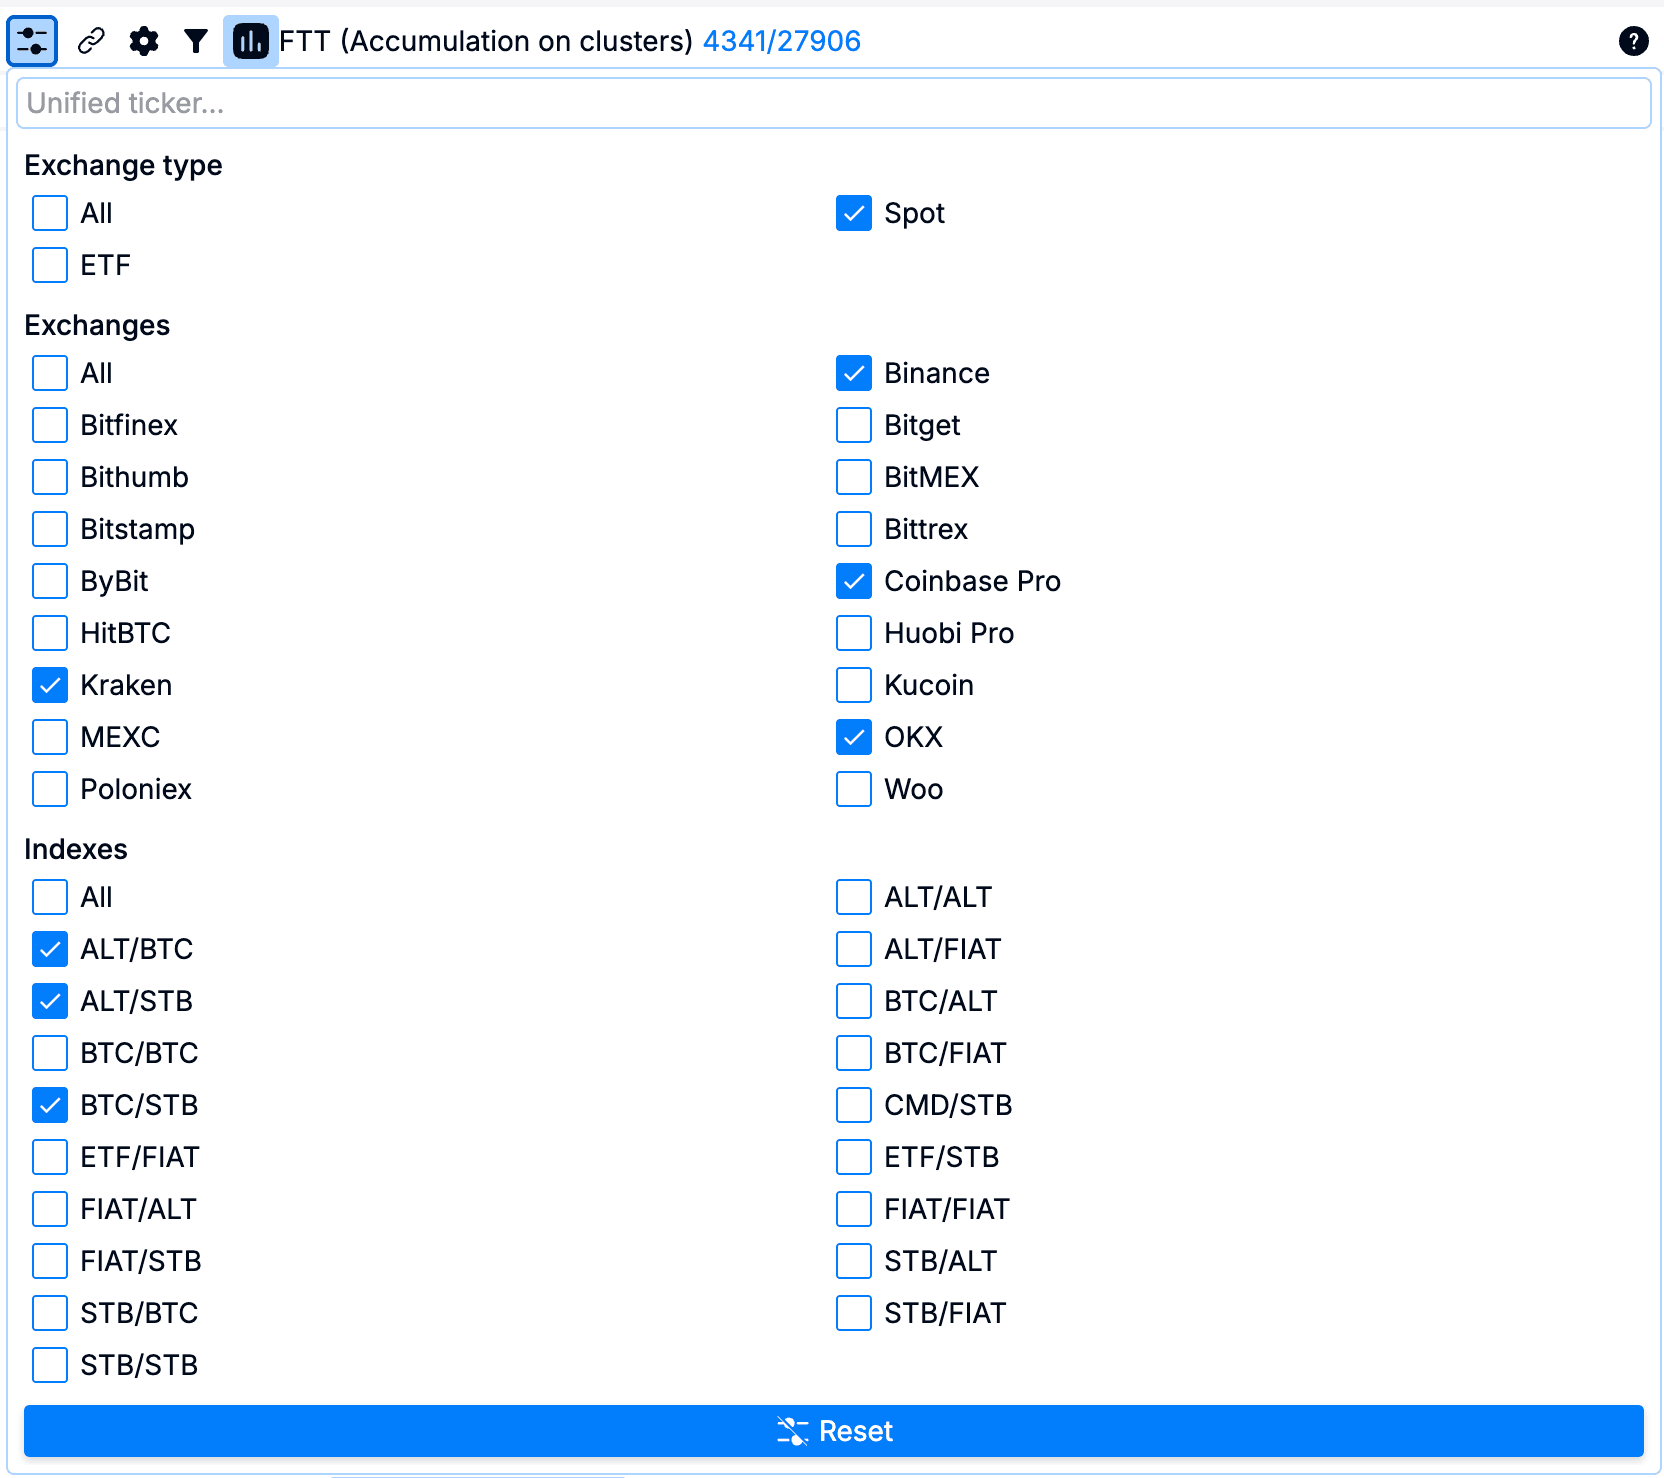
Як працює пошук у таблиці FTT
- Ви обираєте:
– Тип біржі, біржі, індексні групи;
– Таймфрейми для пошуку;
– Типи даних. - FTT відразу обробляє історичні дані та показує пін-бари, підтверджені об’ємами в «хвостах» барів.
- Система підсвічує такі свічки на кластерному графіку.

Ринок повний випадкових пін-барів, особливо на молодших таймфреймах. А найкращий пошуковик аномалій на кластерному графіку — FTT — дозволяє відсіяти такі нерелевантні бари, залишаючи тільки ті, які дійсно мають сенс.
FTT Index: погляд на весь ринок одразу
FTT Index збирає дані FTT за всіма монетами та таймфреймами і показує, як змінюється кількість бичачих і ведмежих пін-барів у динаміці.
Це вже не локальний інструмент, а індикатор ринкових умов.
FTT Index — це гістограма за різними типами ринкових даних, такими як об’єми та кількість угод.
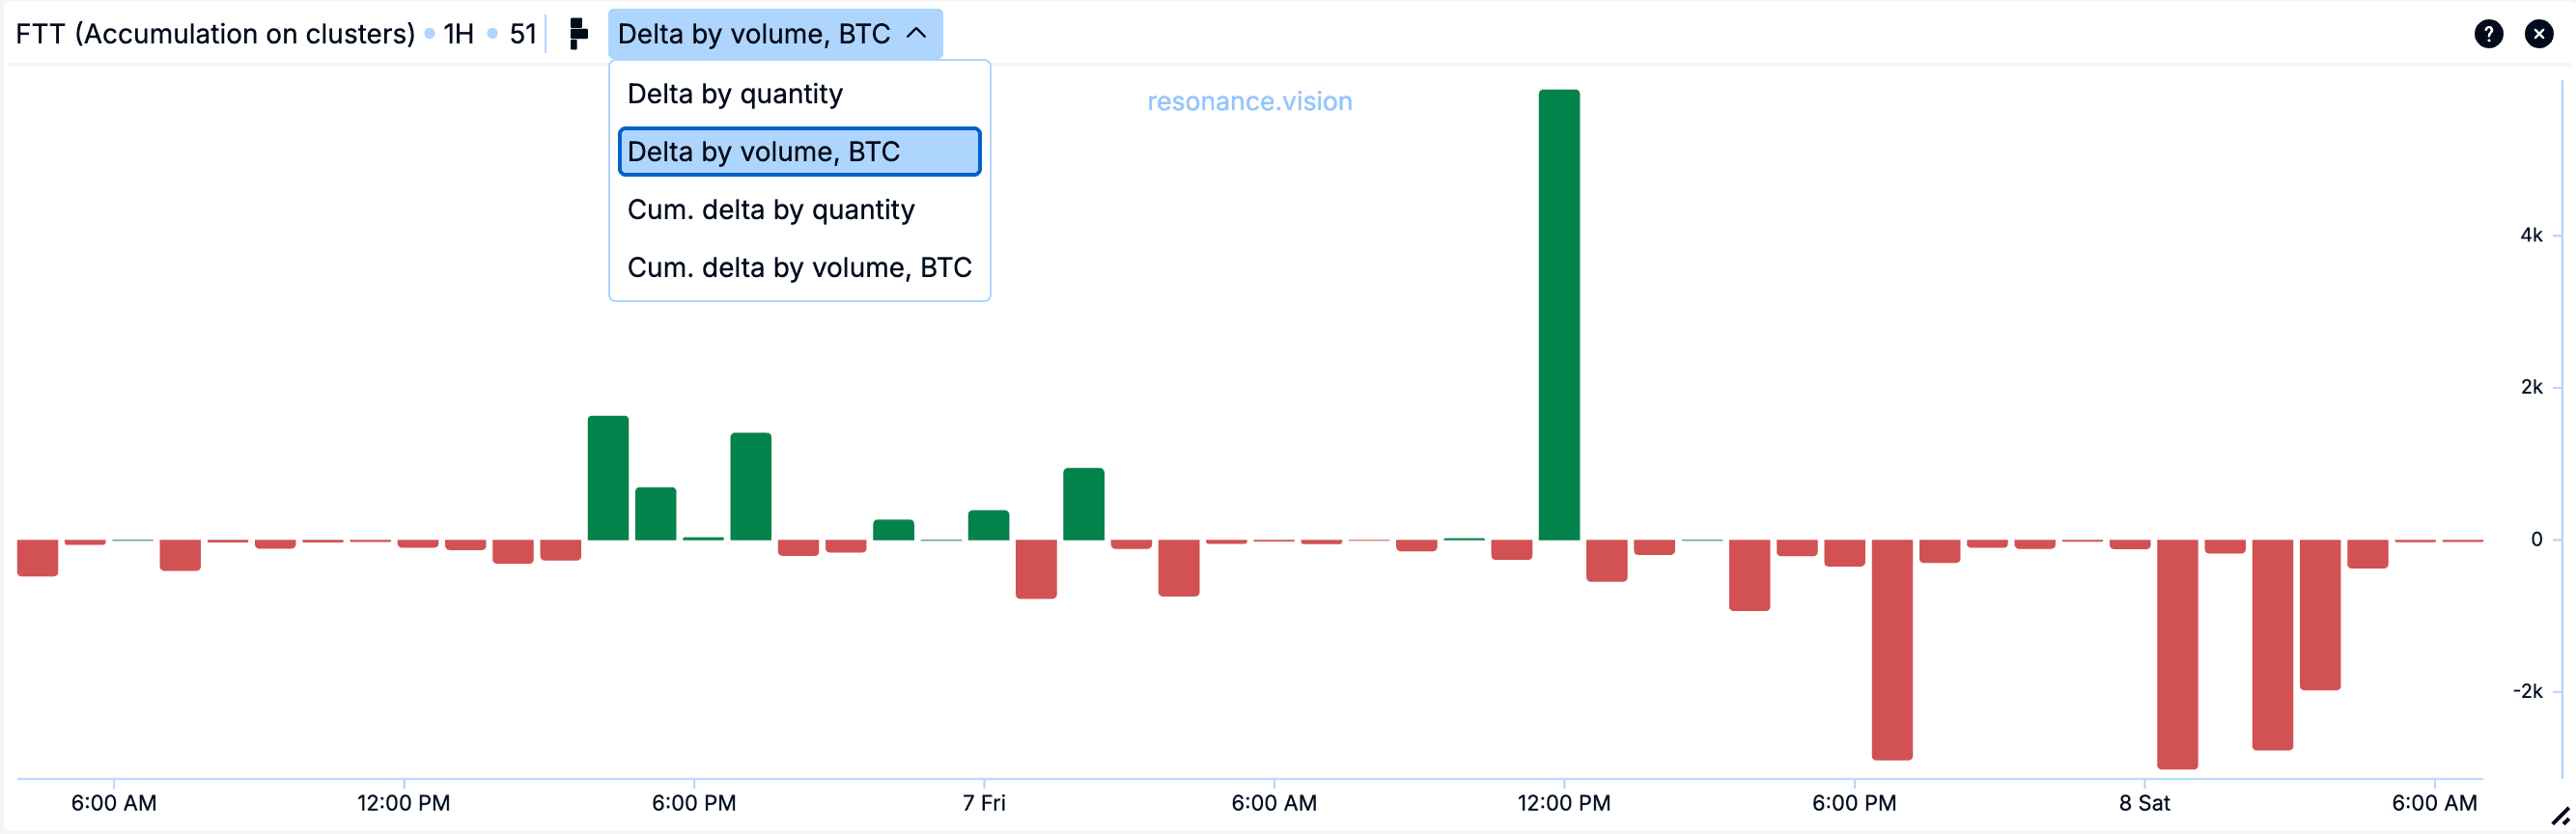
Зелені бари гістограми індексу означають збільшення кількості бичачих пін-барів. Це не про «зростання ринку», а про зростання випадків, коли попит зміг зупинити падіння.
Червоні бари гістограми індексу означають збільшення ведмежих пін-барів.
Тобто зростає кількість моментів, де пропозиція змогла поглинути попит.
FTT Index збирає всі ці сигнали по ринку в один пін-бар індикатор.
Індекс допомагає зрозуміти:
- коли накопичується інтерес покупців або продавців;
- у якій фазі перебуває ринок;
- чи посилюються ознаки розворотної активності;
- чи стає структура ринку агресивнішою.
Це особливо корисно для тих, хто системно торгує весь ринок криптовалют і моніторить десятки монет. Саме для швидкого пошуку торгових ідей FTT — найкращий пошуковик ринкових аномалій.
Завдяки цьому алгоритм FTT дає не просто випадкові точки уваги, а загальну картину балансу попиту та пропозиції: де саме сталося зіткнення інтересів, хто зараз домінує — покупці чи продавці — і наскільки цей дисбаланс має системний характер.
Ці інструменти не визначають точку розвороту, а допомагають автоматично знаходити місця, де ринок уже проявив нетипову активність — і де трейдеру варто активніше включитися в аналіз.
FTT сканує ринок за обраною біржею та таймфреймом і виділяє бари, які відповідають ознакам пін-бара.
Головна ідея FTT — позбавити трейдера від ручного перебору марних свічкових графіків і показати конкретні точки, де могла з’явитися аномалія поведінки учасників.
Пін-бар: тригер, а не команда входити в угоду
Пін-бар часто виглядає переконливо: довга тінь, різкий відскок, візуальний розворот. Але саме це робить його небезпечним для тих, хто сприймає свічку як готовий сигнал. На реальному ринку пін-бар не дає команду «купувати» або «продавати» — він лише показує, де сталася нестандартна ринкова ситуація, а не що потрібно робити трейдеру.
Професіонали використовують його інакше: як точку уваги, після якої починається повноцінний аналіз, а не відразу відкривається угода. Трейдинг вимагає аналізу та дисципліни, а не бездумного відкриття угод.
Чому сам по собі пін-бар нічого не гарантує?
Поява хвоста говорить тільки про те, що в цій зоні хтось зміг зупинити рух. Але ціна могла зупинитися:
- на великому лімітному ордері;
- на тимчасовій паузі;
- через закінчення локального імпульсу;
- через закриття позицій великим учасником;
- через підвищену волатильність на новинах.
Тобто сама свічка не показує намірів учасників далі продовжувати рух.
Вона фіксує те, що вже сталося — але не передбачає те, що відбудеться.
Тому пін-бар стратегія «побачив пін-бар і відразу увійшов в угоду» працює тільки на картинках у підручниках з теханалізу.
Що робить пін-бар цінним тригером?
Пін-бар важливий не як точка входу, а як точка перевірки гіпотези.
Після його появи трейдер повинен відповісти на питання:
- Чому саме тут рух зупинився?
- Чи збігається це з екстремумом або зоною ліквідності?
- Чи підтверджують об’єми, що за цим поворотом стояв великий учасник?
- Чи є продовження ініціативи на наступному барі?
- Чи змінюється характер угод у дельті та кластерах?
Тільки після цього можна говорити про можливість торгувати цю ідею — і то не завжди.
По суті, пін-бар — це маркер цікавого події, після якої вмикається аналіз, а не відкривається угода.
Правильне використання пін-бара в торговій логіці
Пін-бар повинен запускати алгоритм прийняття рішення, а не бути рішенням сам по собі.
Чек-лист кроків трейдера після того, як він побачив пін-бар:
- Поява пін-бару — тригер уваги.
- Оцінка контексту ринку — структура тренду, екстремуми, фаза ринку.
- Перевірка на кластерному графіку — чи є реальні об’єми саме в хвості.
- Дельта — чи є ознаки слабкості тренду.
- Підтвердження наступними барами — чи з’явилися ознаки продовження ініціативи.
- Застосування власної торгової стратегії — вхід, стоп, ризик.
Пін-бар — це лише перший крок у прийнятті торгового рішення.
Він не має сенсу без подальших етапів.
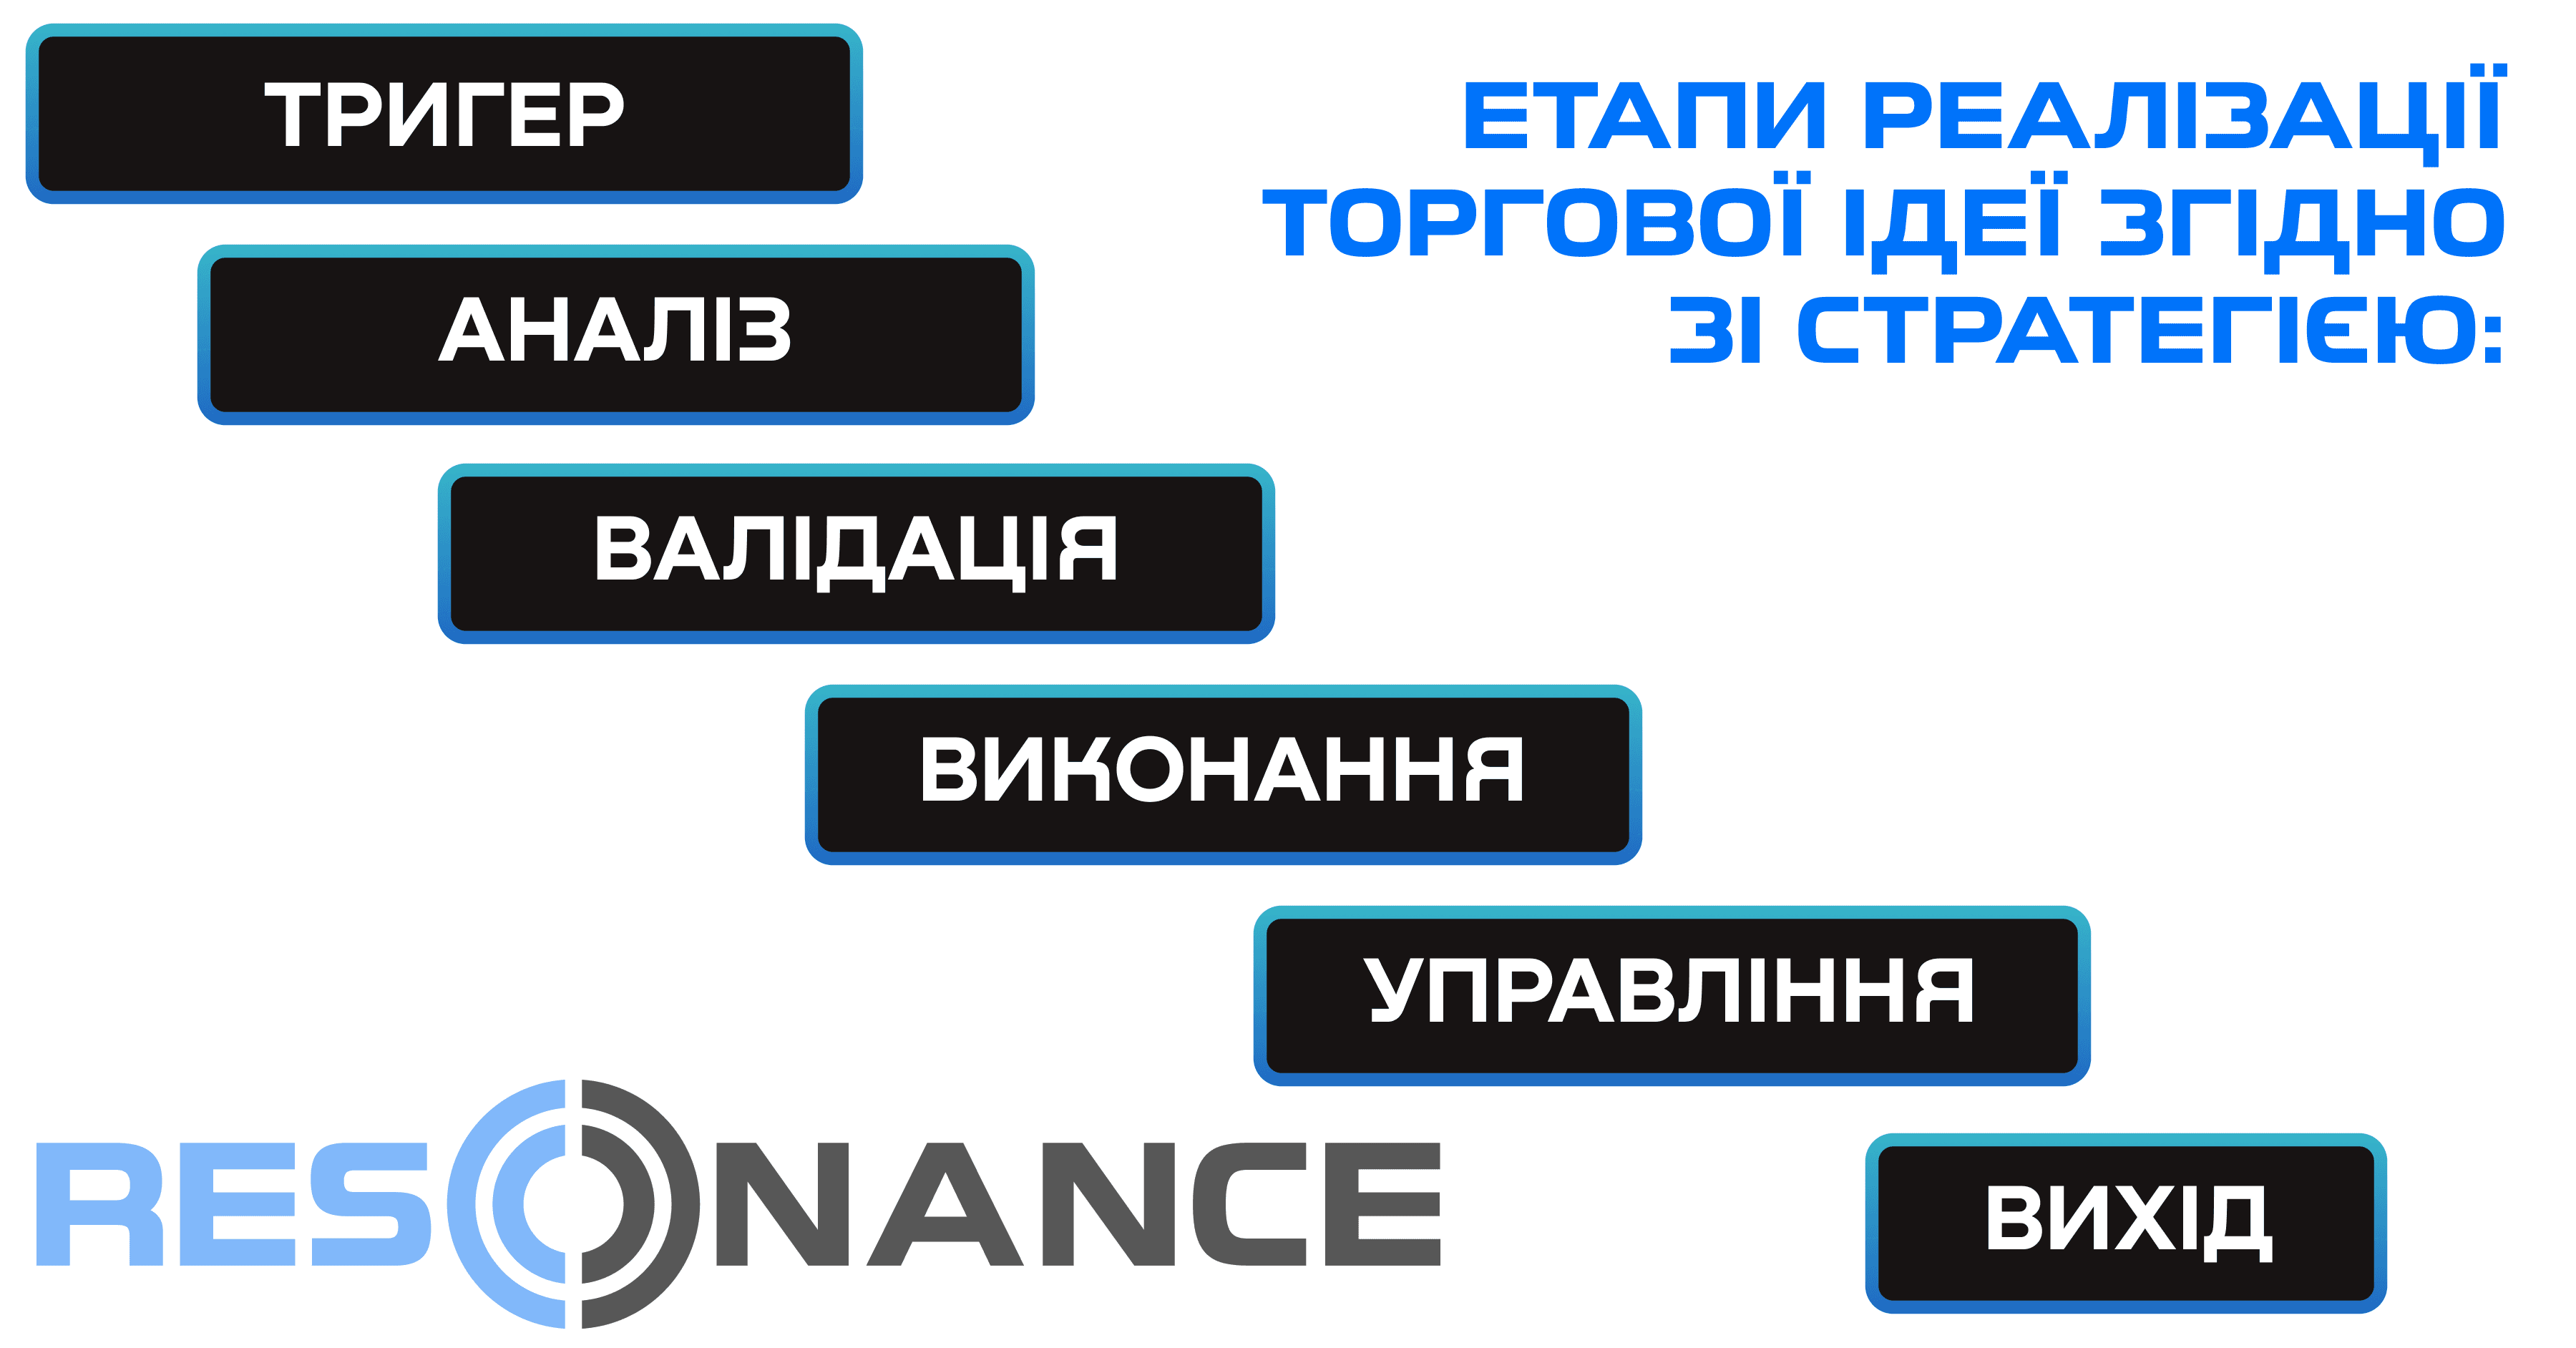
Тому пін-бар стратегія, як і будь-яка інша, повинна включати такі етапи:
- Тригер — ринкова аномалія, яка привертає увагу трейдера. Це стартова точка, але не сигнал для входу.
- Аналіз — перевірка контексту: в якій фазі ринку перебуває монета, який стан балансу попиту та пропозиції.
- Валідація — підтвердження через об’єм, дельту та кластери.
- Реалізація — вхід в угоду за своєю стратегією (вхід, об’єм позиції, стоп, тейк тощо).
- Менеджмент — супровід позиції: добір, переведення в беззбиток, часткова фіксація прибутку, переміщення стоп-лосса тощо.
- Фіксація — вихід з угоди за планом, без емоційних рішень.
Висновок
Пін-бар — привід зупинитися і проаналізувати монету, а не торгувати без стратегії навмання.
Це не готова команда «входити в угоду», а інформаційний маркер, який допомагає трейдеру визначити, де ринок показав нетипову реакцію. Сам по собі пін-бар патерн не гарантує розворот і не дає точного прогнозу напрямку; він лише фіксує момент, у якому сили покупців і продавців вступили в конфлікт.
У трейдингу криптовалют важливо бачити не форму свічки, а розуміти її зміст: об’єми, характер боротьби за ціну, появу дефіциту чи профіциту, зміну ініціативи. Саме це перетворює візуальний тригер на корисну інформацію, яку можна інтегрувати в торгову стратегію.
Важливо пам’ятати: торгувати потрібно не пін-бар, а торгову ідею згідно з вашою стратегією, керуючи входом, стопами та ризиком.
Тут FTT і FTT Index допомагають вивести аналітику на новий рівень. Ці інструменти перетворюють пошук пін-барів із хаотичного перегляду графіків на системний і об’єктивний процес, дозволяючи швидко знаходити зони можливої зміни ініціативи.
Прочитайте статтю “Пін-бар як тригер: Як об’єм рятує трейдера від збитків?” перед чим знову заходити в угоду по пін-бару: тут пояснюється, як відрізнити справжній розворот від красивої ілюзії.
Стеж за новими статтями у нашому телеграм каналі.
Не треба вигадувати складних схем та шукати “грааль”. Використовуйте інструменти платформи Resonance.
Реєструйся за посиланням - отримуй бонус і починай заробляти:
OKX | BingX | KuCoin.
Промокод TOPBLOG дає тобі 10% знижки на будь-який тарифний план Resonance.
Рекомендовані статті


