Pin Bar as a Trigger: How Volume Saves a Trader from Losses

Candlestick patterns like pin bars have been considered the “gold standard” of technical analysis for decades. But in practice, most traders lose money by following subjective signals, not realizing that they don’t reflect real market mechanics.
This article explains in detail why pin bars aren’t signals, but merely triggers, and how volume and liquidity allow us to see the true behavior of market participants.
It examines the typical mistakes of the classical approach, the role of market phases, and objective rules for entry, exit, and stop-loss placement.
Table of contents

Pin Bar as a Trigger: How Volume Saves a Trader from Losses
Trading by candlestick patterns such as the pin bar is one of the most popular yet least effective methods in the hands of beginners.
The main problem lies in the detachment from the real mechanics of the market.
We will analyze why classical technical analysis rules for entries and exits based on pin bars do not work, and how to move to objective analysis, where the pin bar is only a trigger, while volume and liquidity are the true market signals.
What is a Pin Bar?
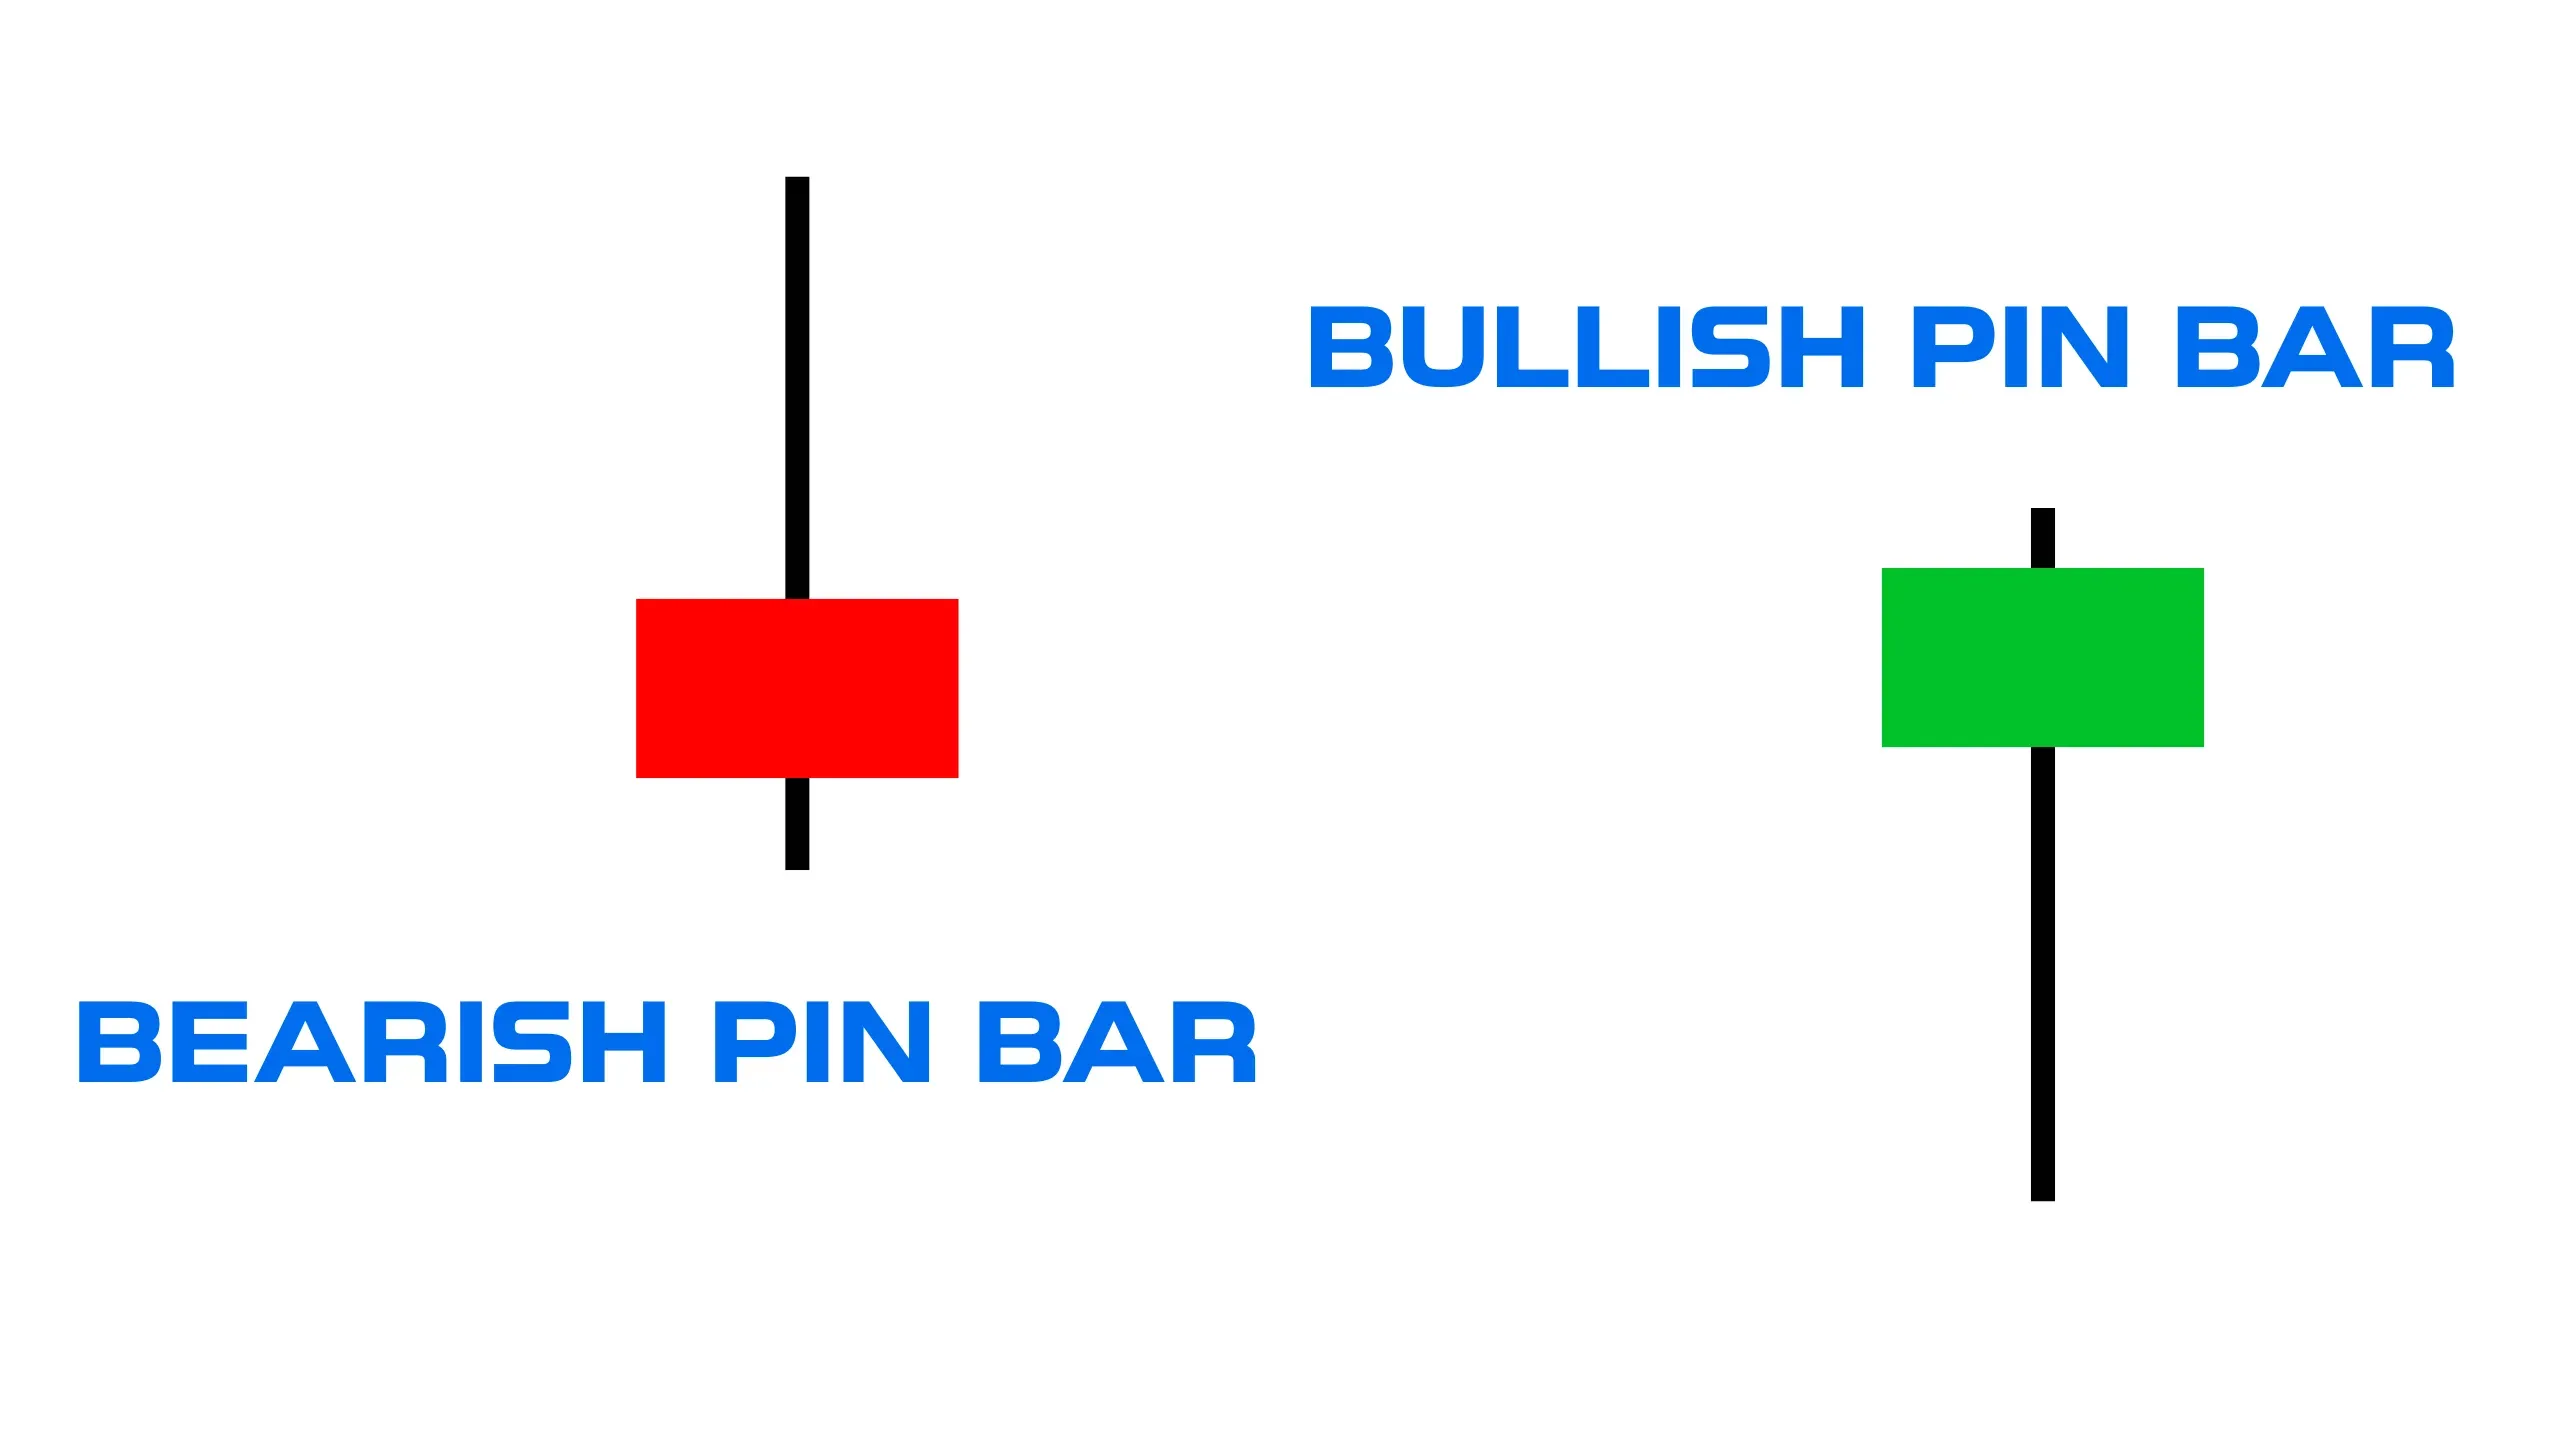
A Pin Bar is a popular candlestick pattern in trading that looks like a “needle” candle with a long tail (wick) and a small body.
It is believed to signal a potential trend reversal, indicating that the previous price movement has likely ended and the price may change direction.
The name comes from the character Pinocchio, whose nose lengthened whenever he lied — similarly, the long “nose” (wick) of the candle signals a change in price direction.
Visually, it looks like this:
The Problem with Pin Bar Analysis in Technical Analysis
Most of the rules regarding pin bars suffer from uncertainty and inability to work in real-time.
All examples below will be considered for long positions.
1. “Important Level” and Trend Context
Classical technical analysis claims that a Pin Bar is a strong signal only “at an important level” or “at the end of a trend.”
Problem: How can a trader know that this is the end of a trend by analyzing only price movement? How can one determine the importance of a level? These are merely subjective lines on the chart.
Objective approach: Context is defined not by lines, but by market phases (1, 2, 3, 4) and the efficiency of volume impact on price.
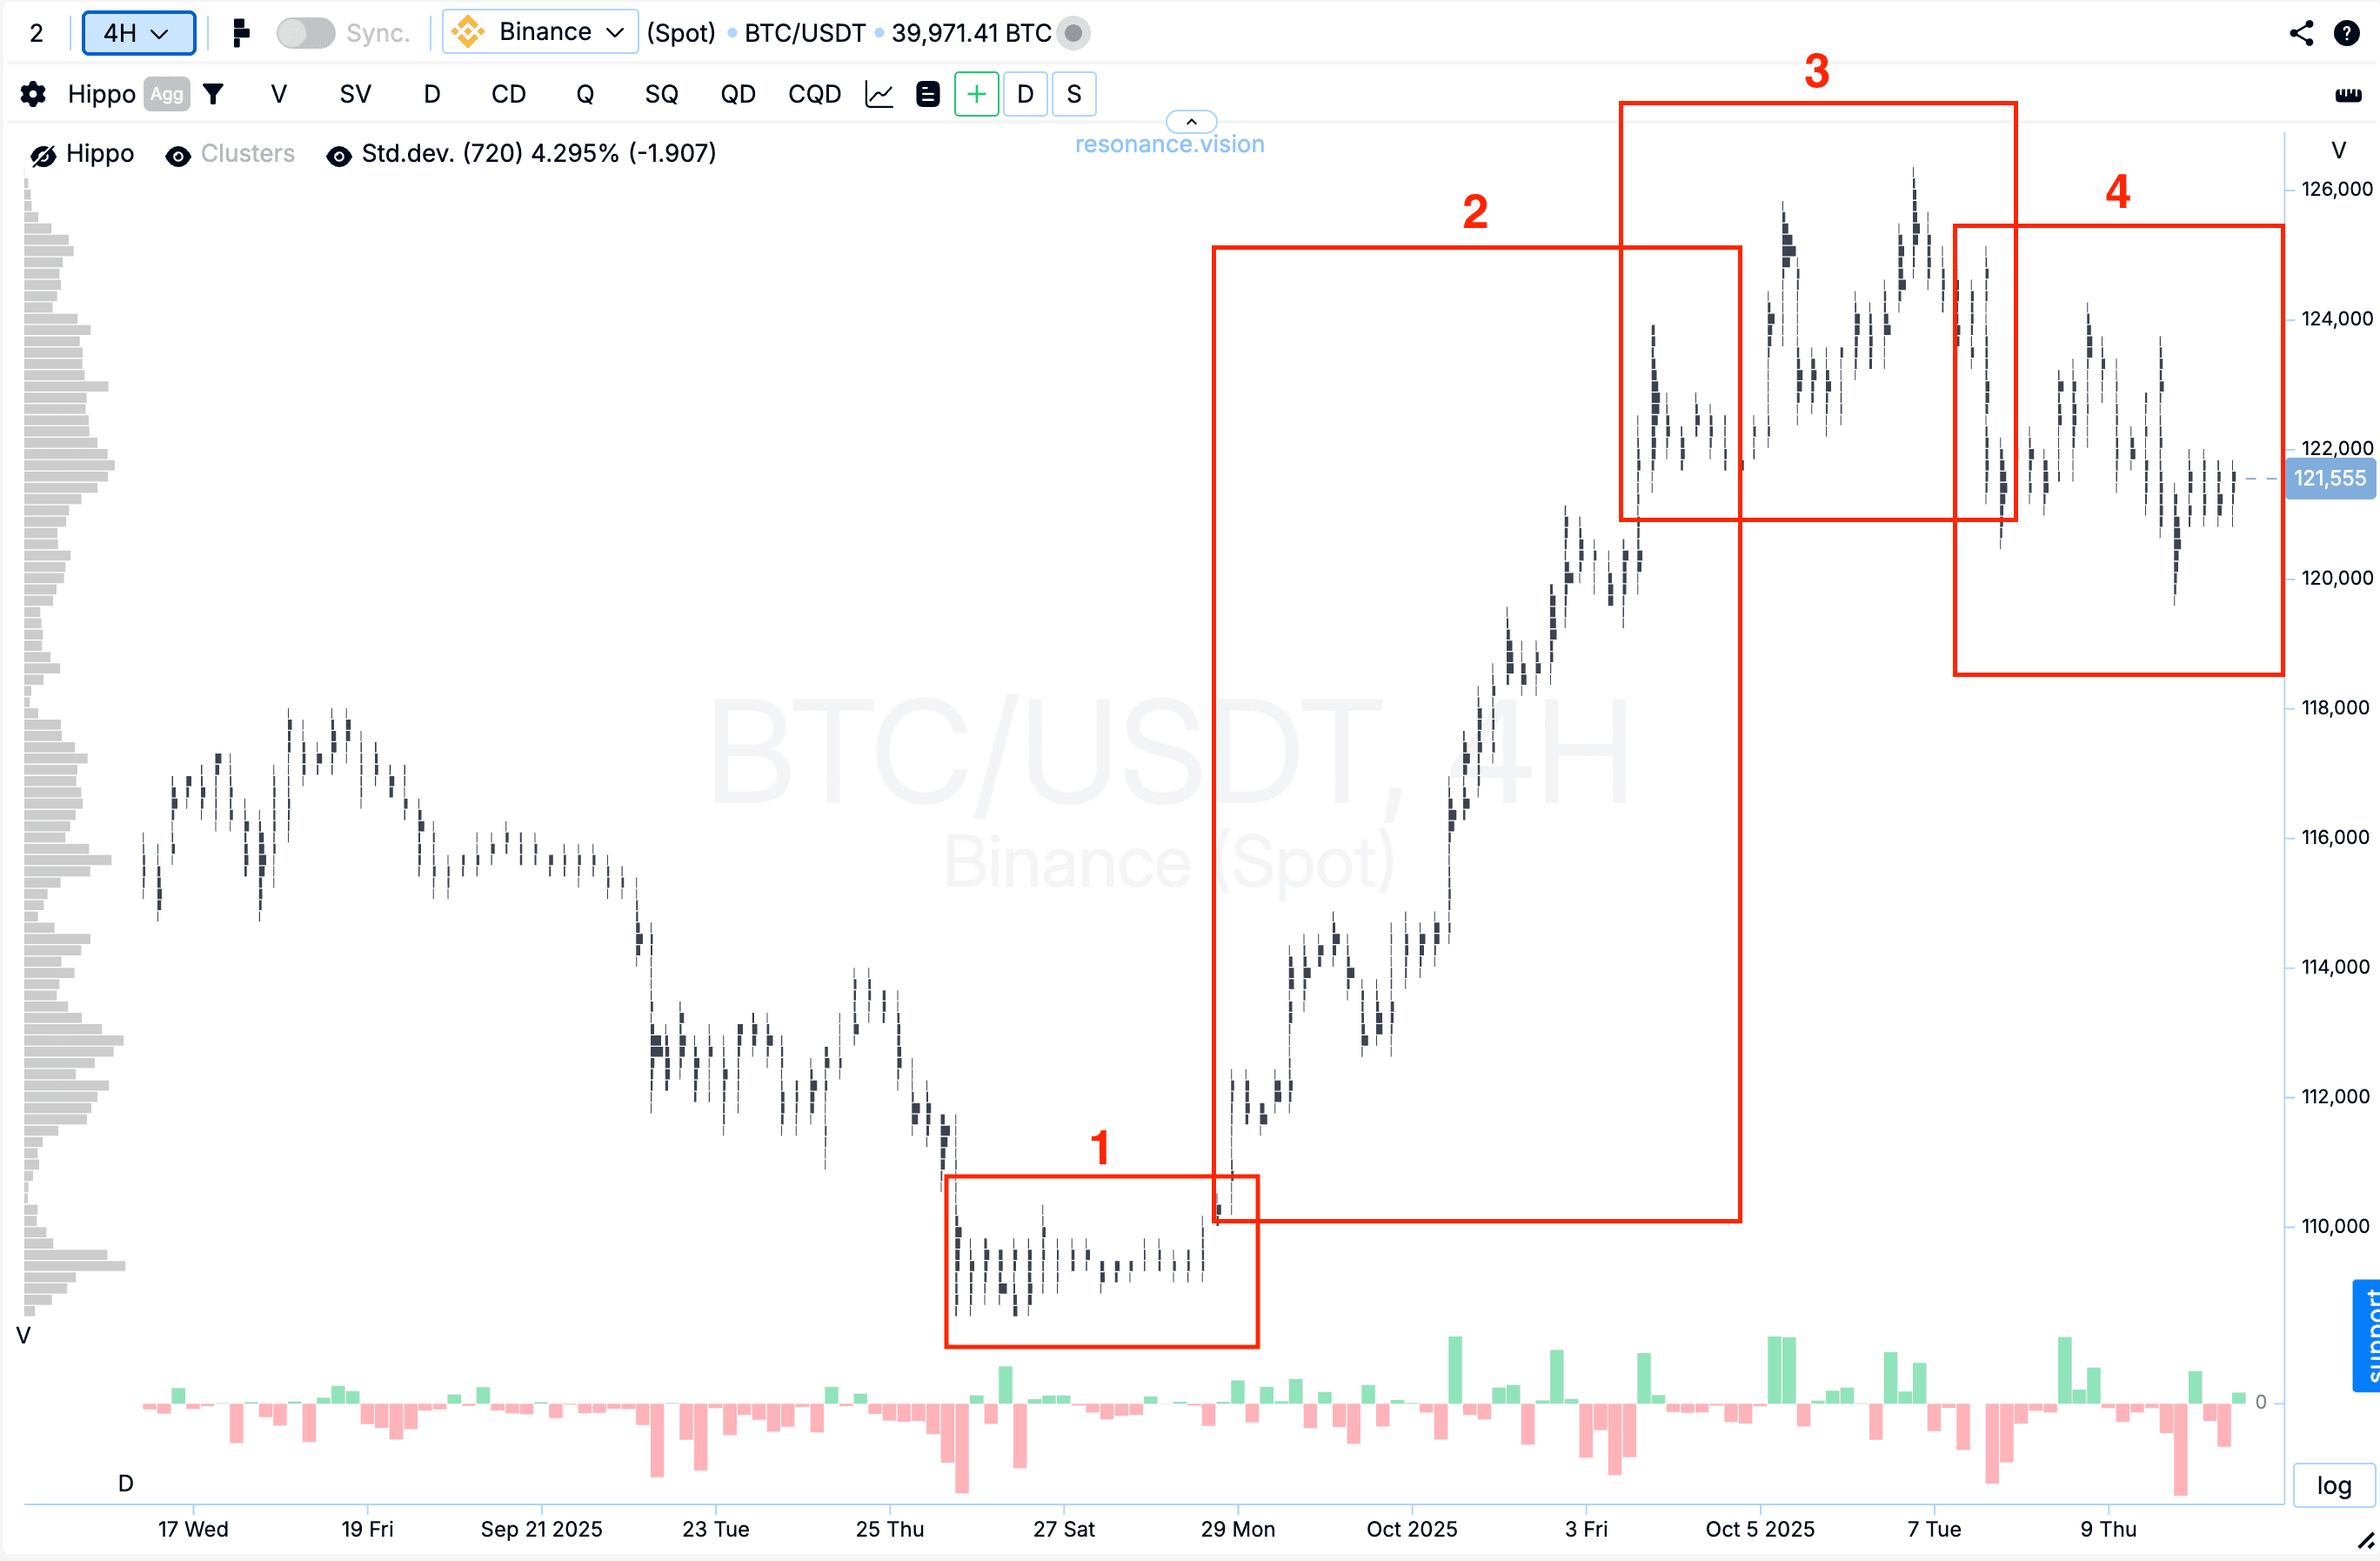
Read more about market phases in the article “Who Really Stands Behind the Trend.”
Focus on what is happening right now — in the current move up or down.
The efficiency of volume is what truly matters — not what happened “sometime before.”
2. Timeframes: The Myth of Reliability
A common misconception states that patterns on higher timeframes (H4, D1) are more reliable than on minute charts.
Problem: If a Pin Bar works, it works on any timeframe, provided there is enough liquidity.
Key: The Pin Bar should be used as a trigger, after which you analyze the impact of volume on price and determine the current market phase.

Liquidity: More Than Just Volume
Liquidity is not just the total number of traded contracts — it is the ability to be quickly bought or sold, but with important nuances.
Liquidity is a complex concept that includes:
- Participant activity (frequency of order changes and placements)
- Amount of money and number of participants in the market
- Market depth (density of limit orders)
The Problem of Low Liquidity
On low-liquidity assets (where movement is sideways or chaotic), even a small order can create a long but false pin bar wick.
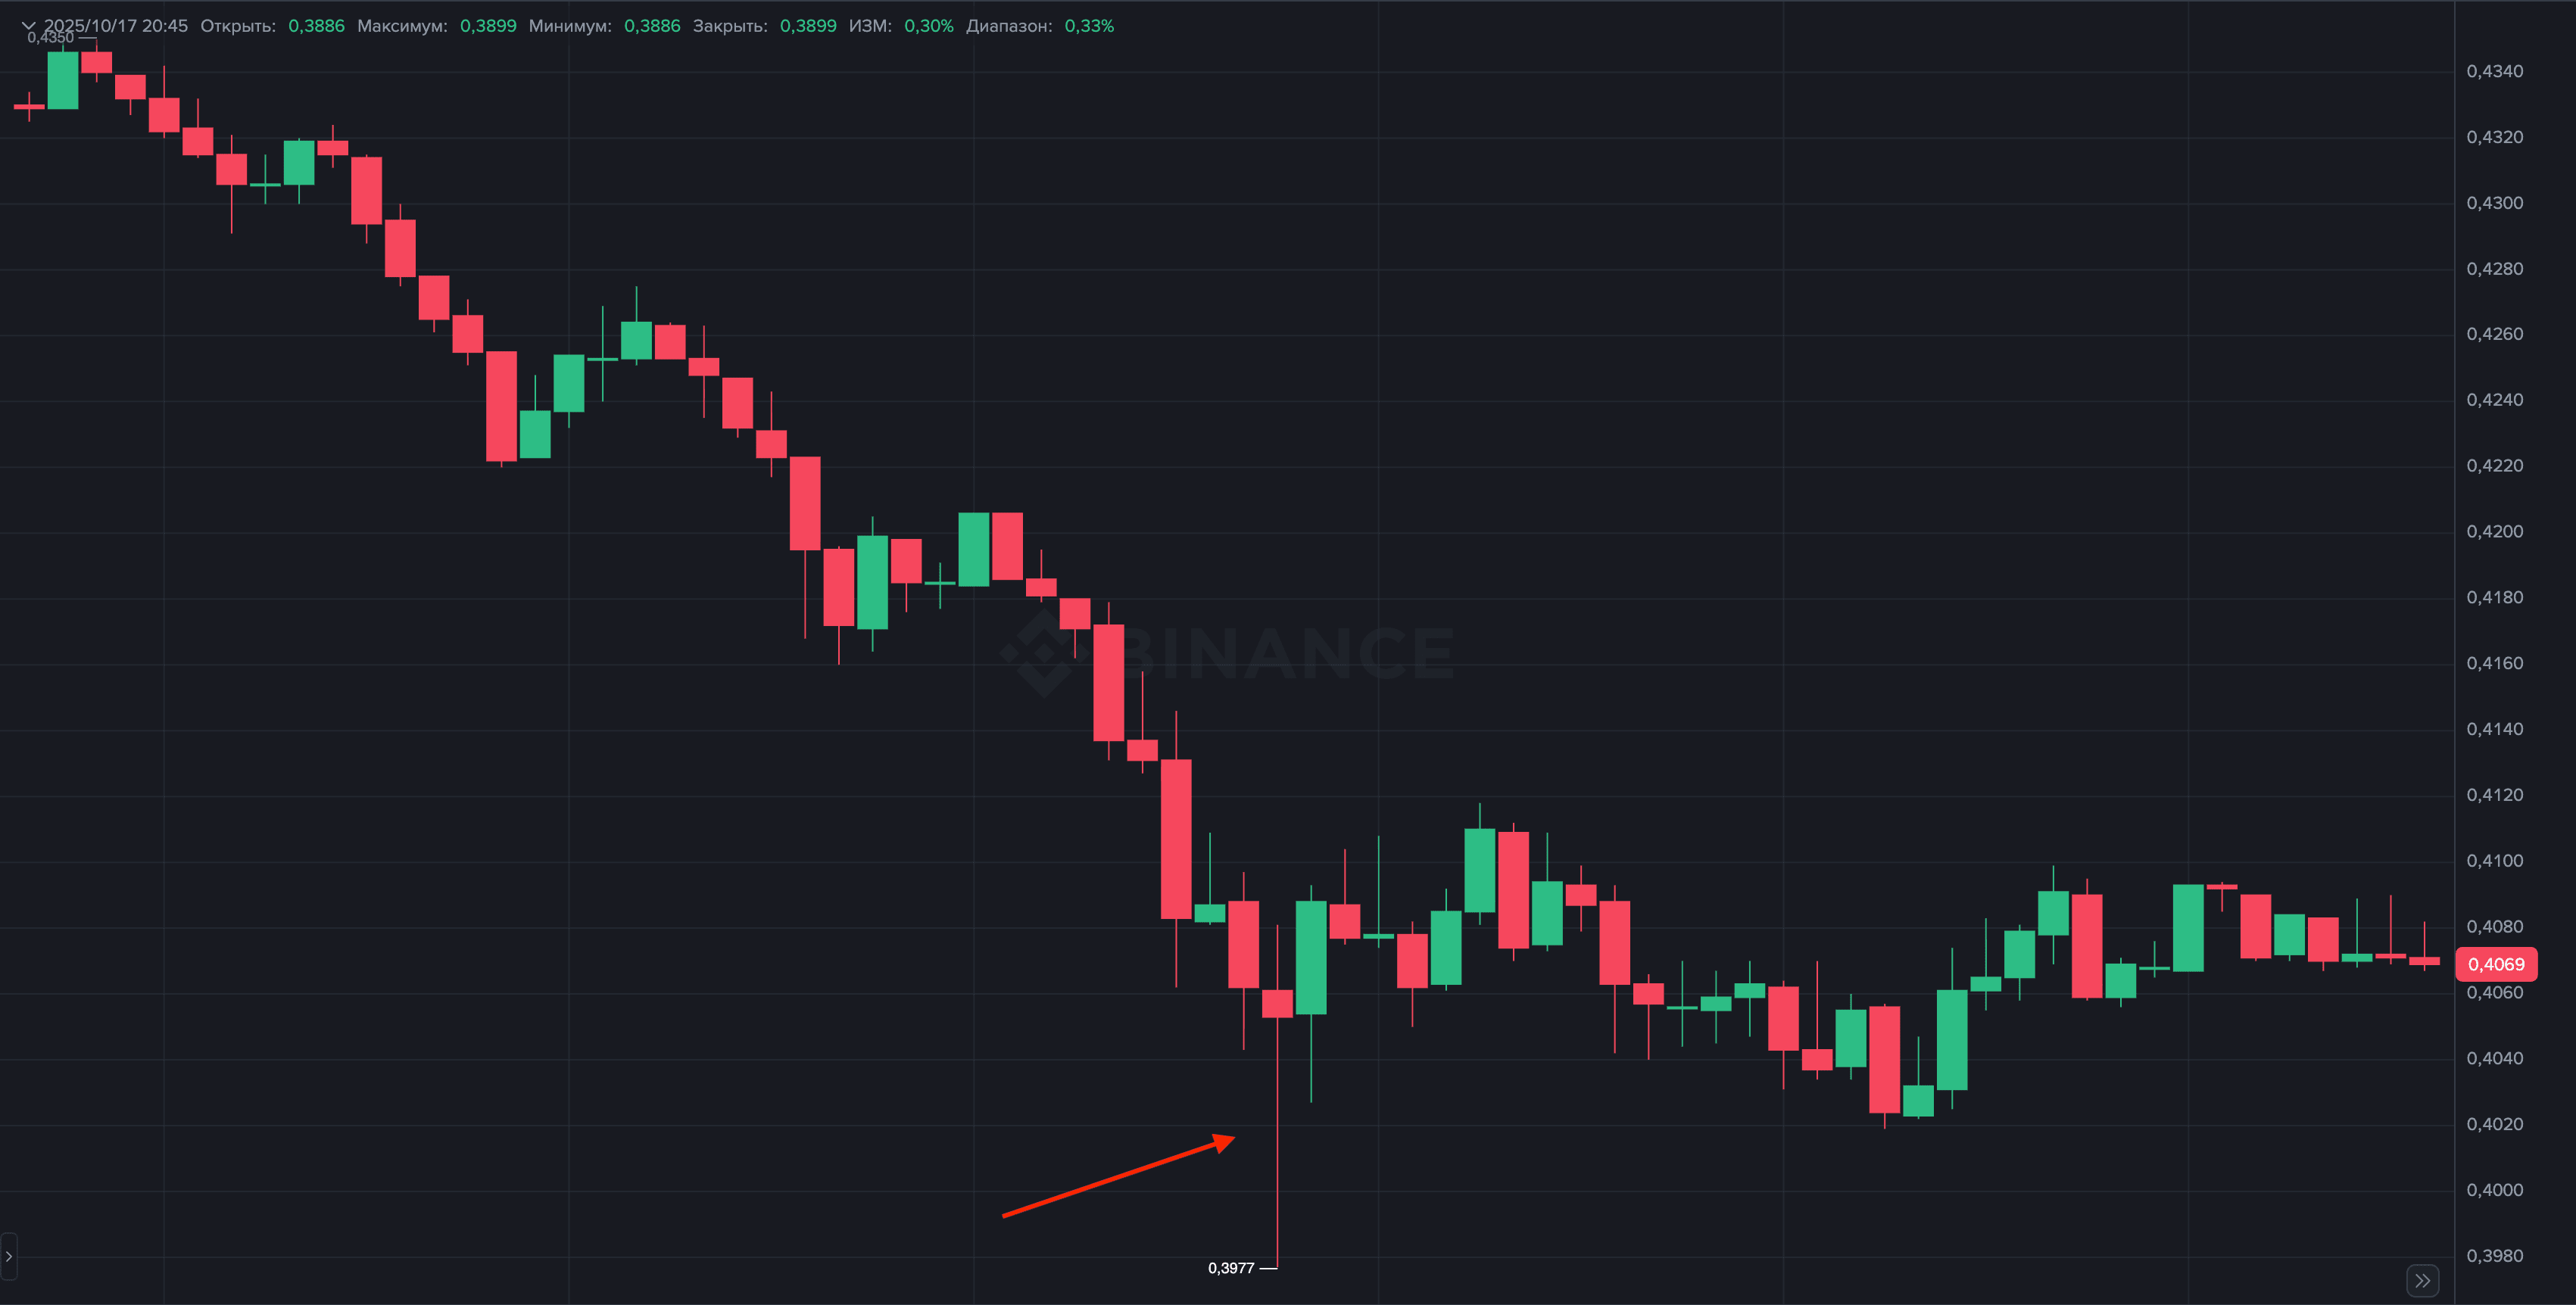

Solution:
For such assets, you need to increase the timeframe (compress volume clustering) to H1, H4, or D1 to see meaningful price movement.
For high-liquidity assets (e.g., BTC on Binance), you can work even on M1.
Objective Rules for Entry and Exit
The trading process should go through the stages:
Trigger → Analysis → Validation → Execution → Management → Exit
1. Entry Points (Execution)
Entry into a trade must be objective, based on market phases:
- Early / Risky: Enter on signs of shortage phase (Phase 1), before validation. Potentially the highest profit, but high risk of stop-loss being hit due to an incomplete shortage formation.
- Ideal / Timely: Enter during validation — when the price during sell-offs already shows it can’t make a new low (in long setup). This means a deficit of sellers has formed.
- Late: Enter when the realization of the shortage (Phase 2) has already begun. Minimal risk, but you miss part of the initial movement.
2. Stop-Loss Placement
Technical Analysis Mistake: Placing the stop “behind the wick” of the pin bar.
This makes you an easy target for spikes and the high volatility of the first phase.
Rule: Place your stop behind visible limit orders.
The stop-loss should be placed behind large limit orders (visible on the Heat Map as blue rectangles), since they act as natural protective barriers.
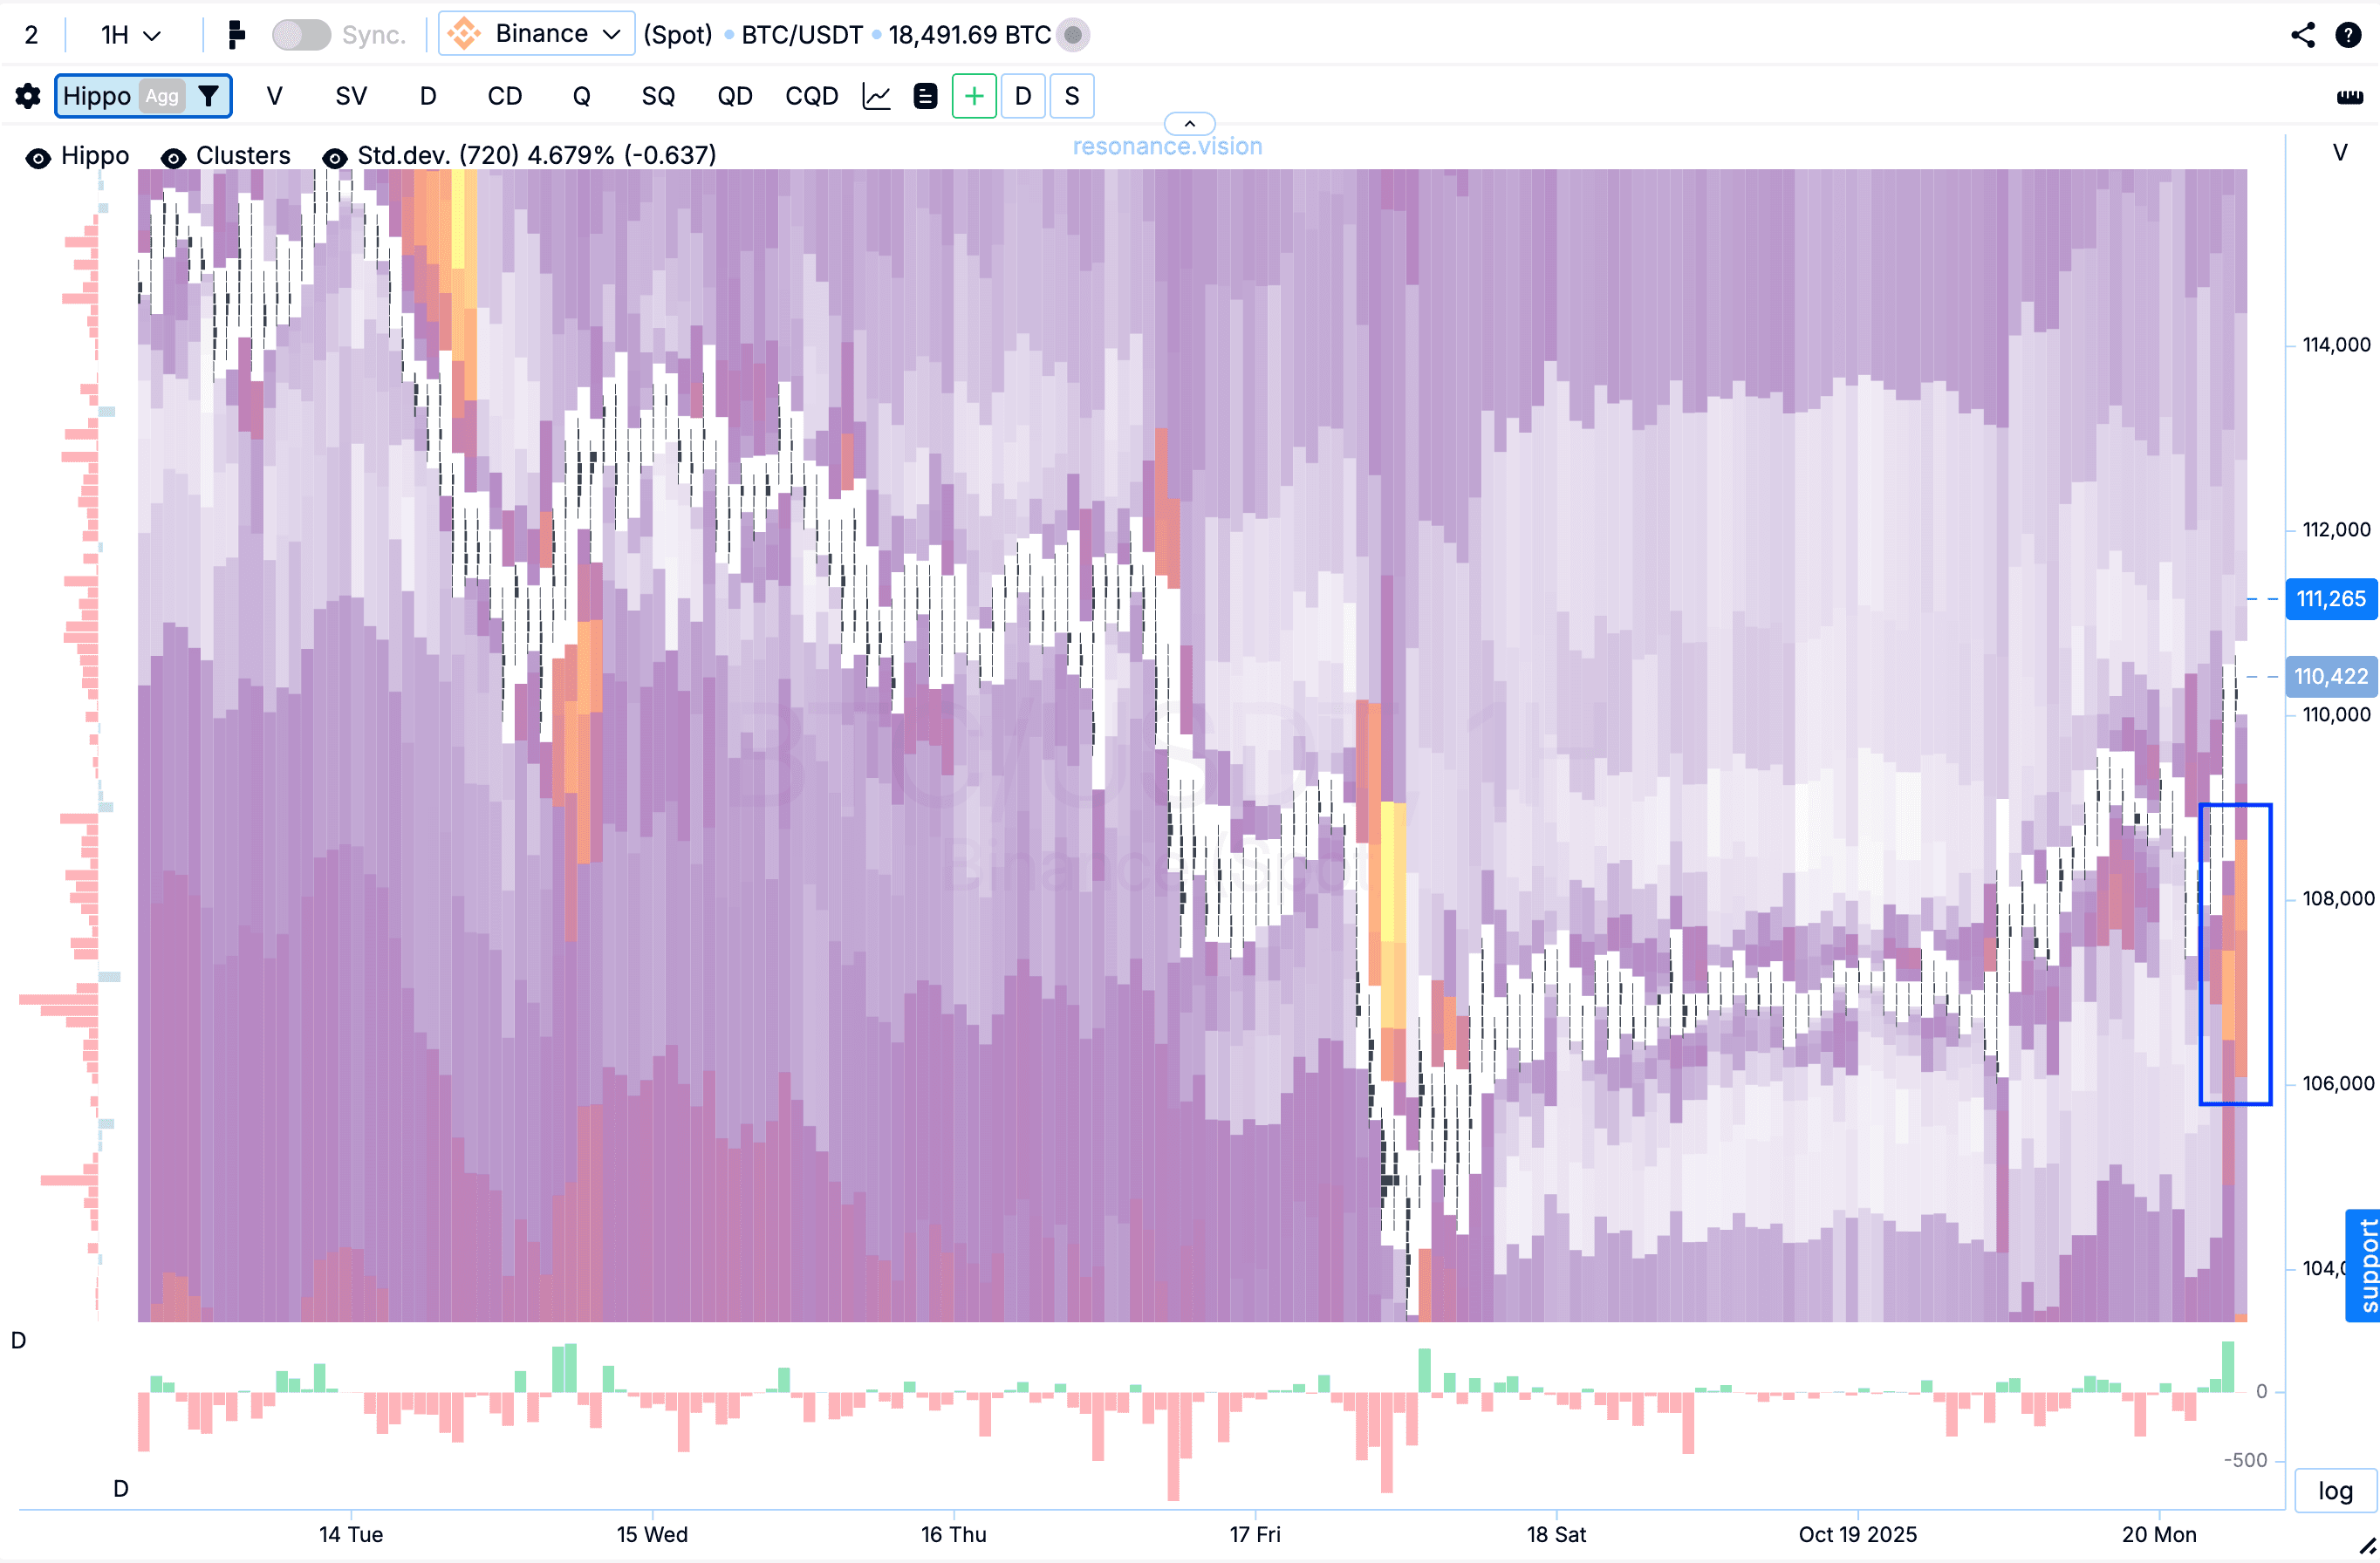
Remember: limits are only “intentions,” but they help define a relatively safe distance between your entry and stop.
3. Take-Profit Targets
Technical Analysis Mistake: Using a fixed risk-to-reward ratio (1:2, 1:3, etc.) or “nearest strong levels.”
Fixed ratios often lead to underprofit or stop-loss hunting.
Rule: Fix profits in long positions when you see signs of Phase 3 (Surplus).
Surplus signs: High volatility and large buy volumes (in longs), where the price stops making significant new highs.
Act according to the principle:
“Cut losses and let profits grow.”
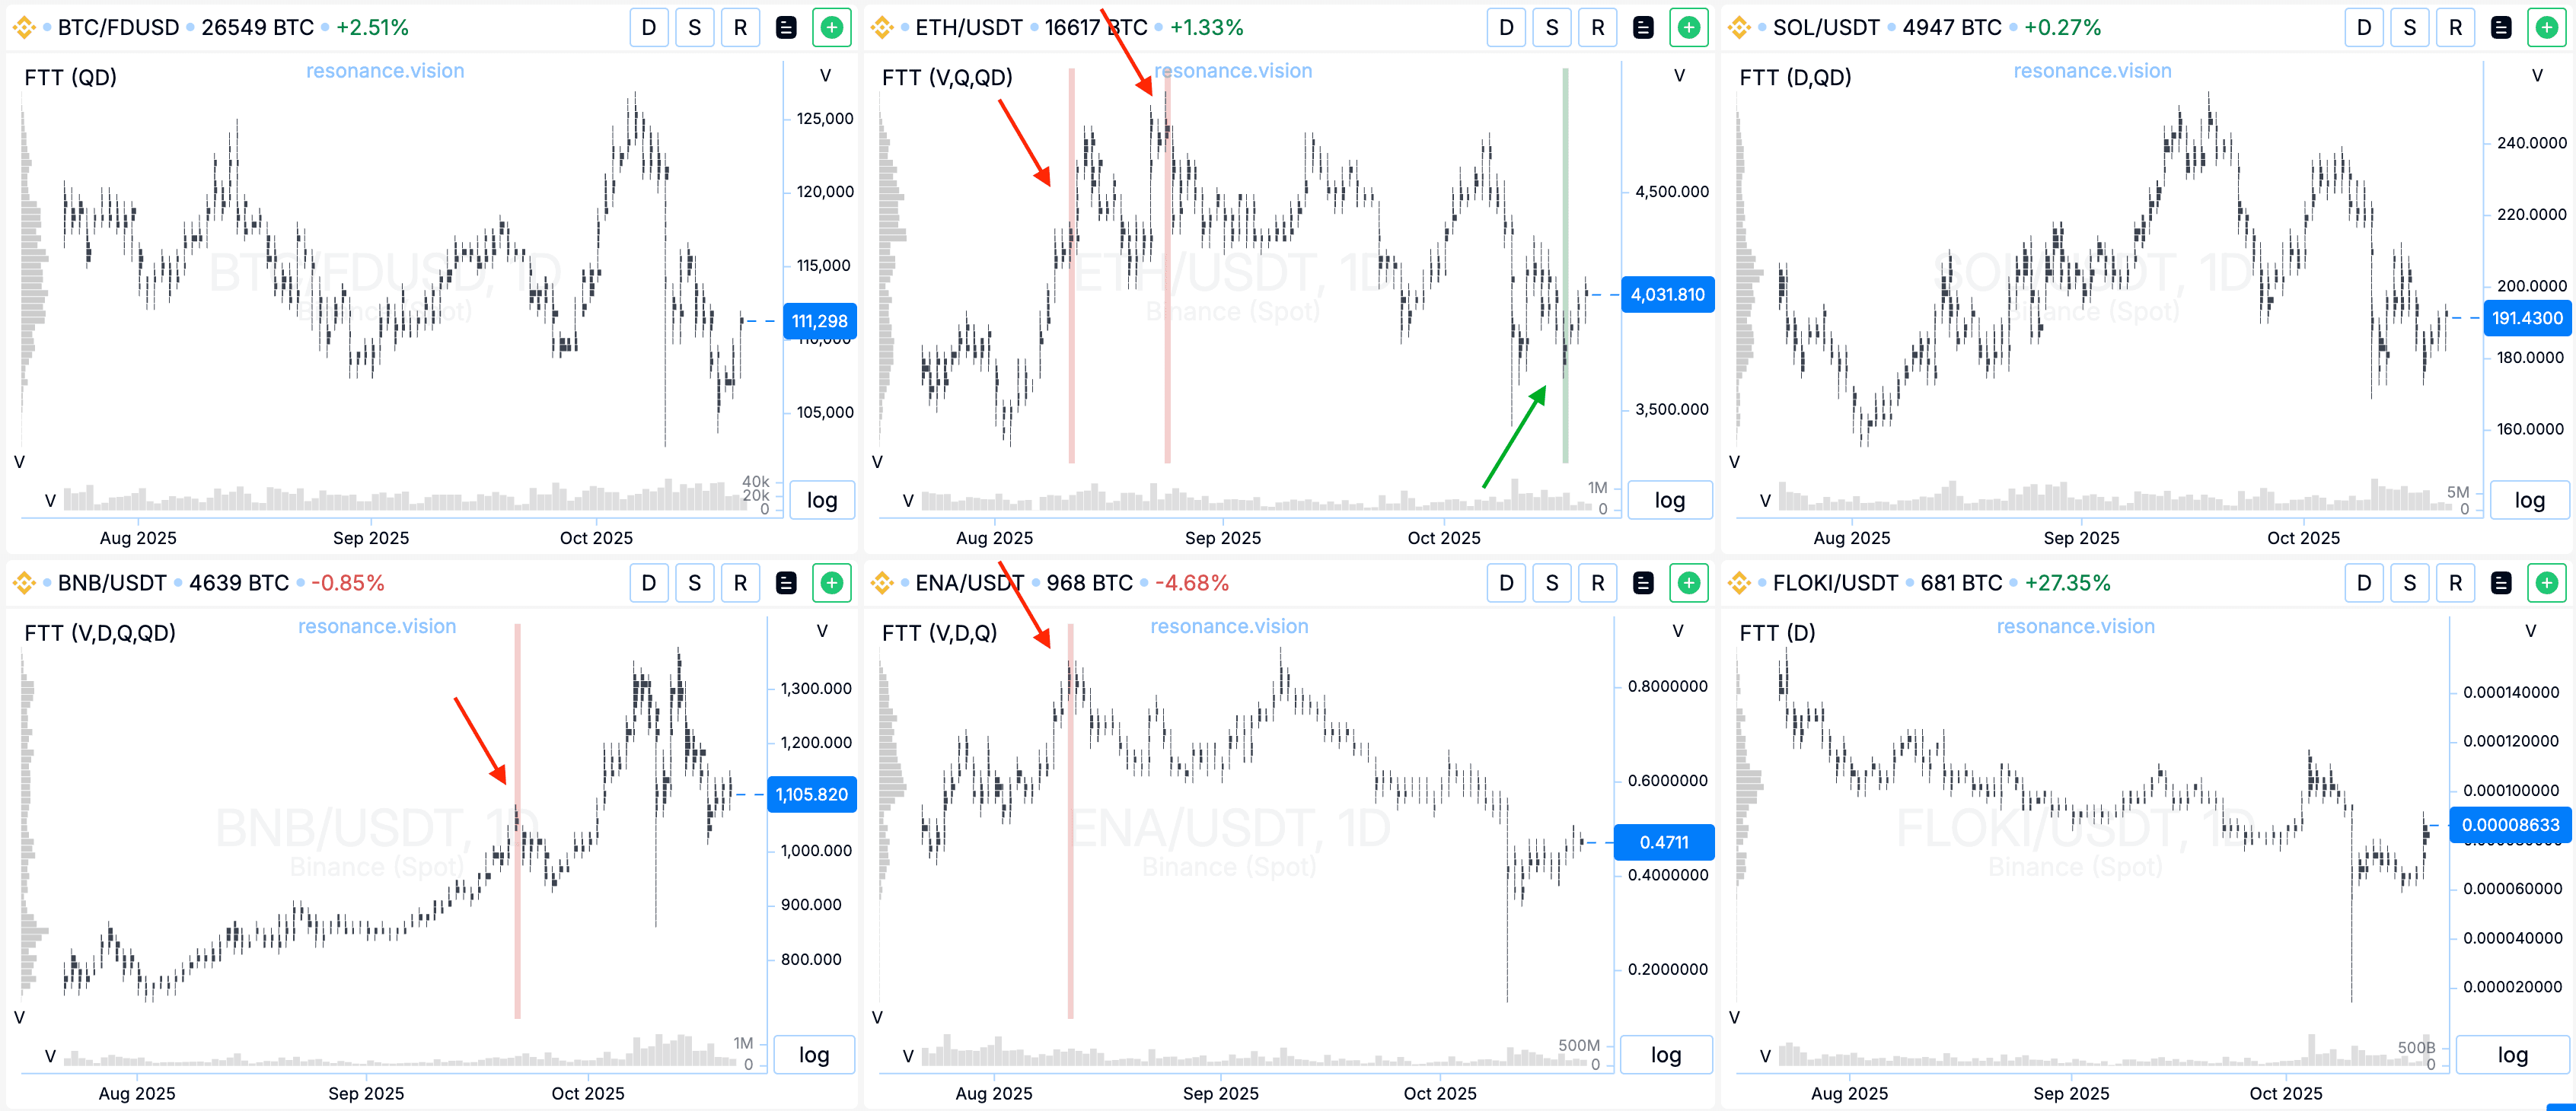
FTT (Find The Tail’s Trade) — Your Objective Trigger
The FTT tool is used to find pin bars backed by real market activity, making them objective triggers, not just subjective patterns of technical analysis.
What is this tool and why do you need it?
A pin bar itself is only a trigger.
FTT validates this trigger using data invisible on a regular candlestick chart.
- Trigger: The pin bar is the initial signal.
- Validation: FTT effectively replaces classical validation by finding cluster bars where abnormally high volume is concentrated specifically in the tail of the candle.
This confirms that a serious battle between demand and supply occurred at that price level.
How to Use FTT (What to Look For)
FTT simplifies selection but does not eliminate the need for further analysis.
- Initial Selection: FTT provides a list of assets where a pin bar with volume confirmation has appeared.
- Contextual Analysis: After FTT gives the trigger, move on to evaluating the effectiveness of volume impact on price within the current market phase (Phase 1 — shortage formation, Phase 3 — surplus signs).
FTT is not a replacement for cluster analysis but helps focus on the right assets.
Goal: Apply phase analysis (1, 2, 3, 4) only to those assets where the pin bar has already been confirmed by volume.
Rule for Entry:
A pin bar is only a trigger.
Enter a trade during the validation or realization of shortage phase (Phase 2), and only after you confirm that the price has stopped falling and market liquidity is sufficient.
Thus, FTT is a powerful filter separating randomly formed pin bars from those driven by real market participants.
Read more about the FTT anomalous volume scanner in the article “FTT – The Tool for Detecting Reversal Accumulations.”
Conclusion: Objectivity Is the Path to Profit
Candlestick patterns like the pin bar are only triggers for analysis.
By themselves, they carry no predictive value without confirmation from primary market data.
Key Takeaways for Objective Trading:
1. Timeframe doesn’t matter — liquidity does.
Forget the myth that H4 is more reliable than M5.
Any timeframe works if there is enough liquidity to form meaningful movements.
If liquidity is low — increase the timeframe.
2. Volume is your most reliable ally.
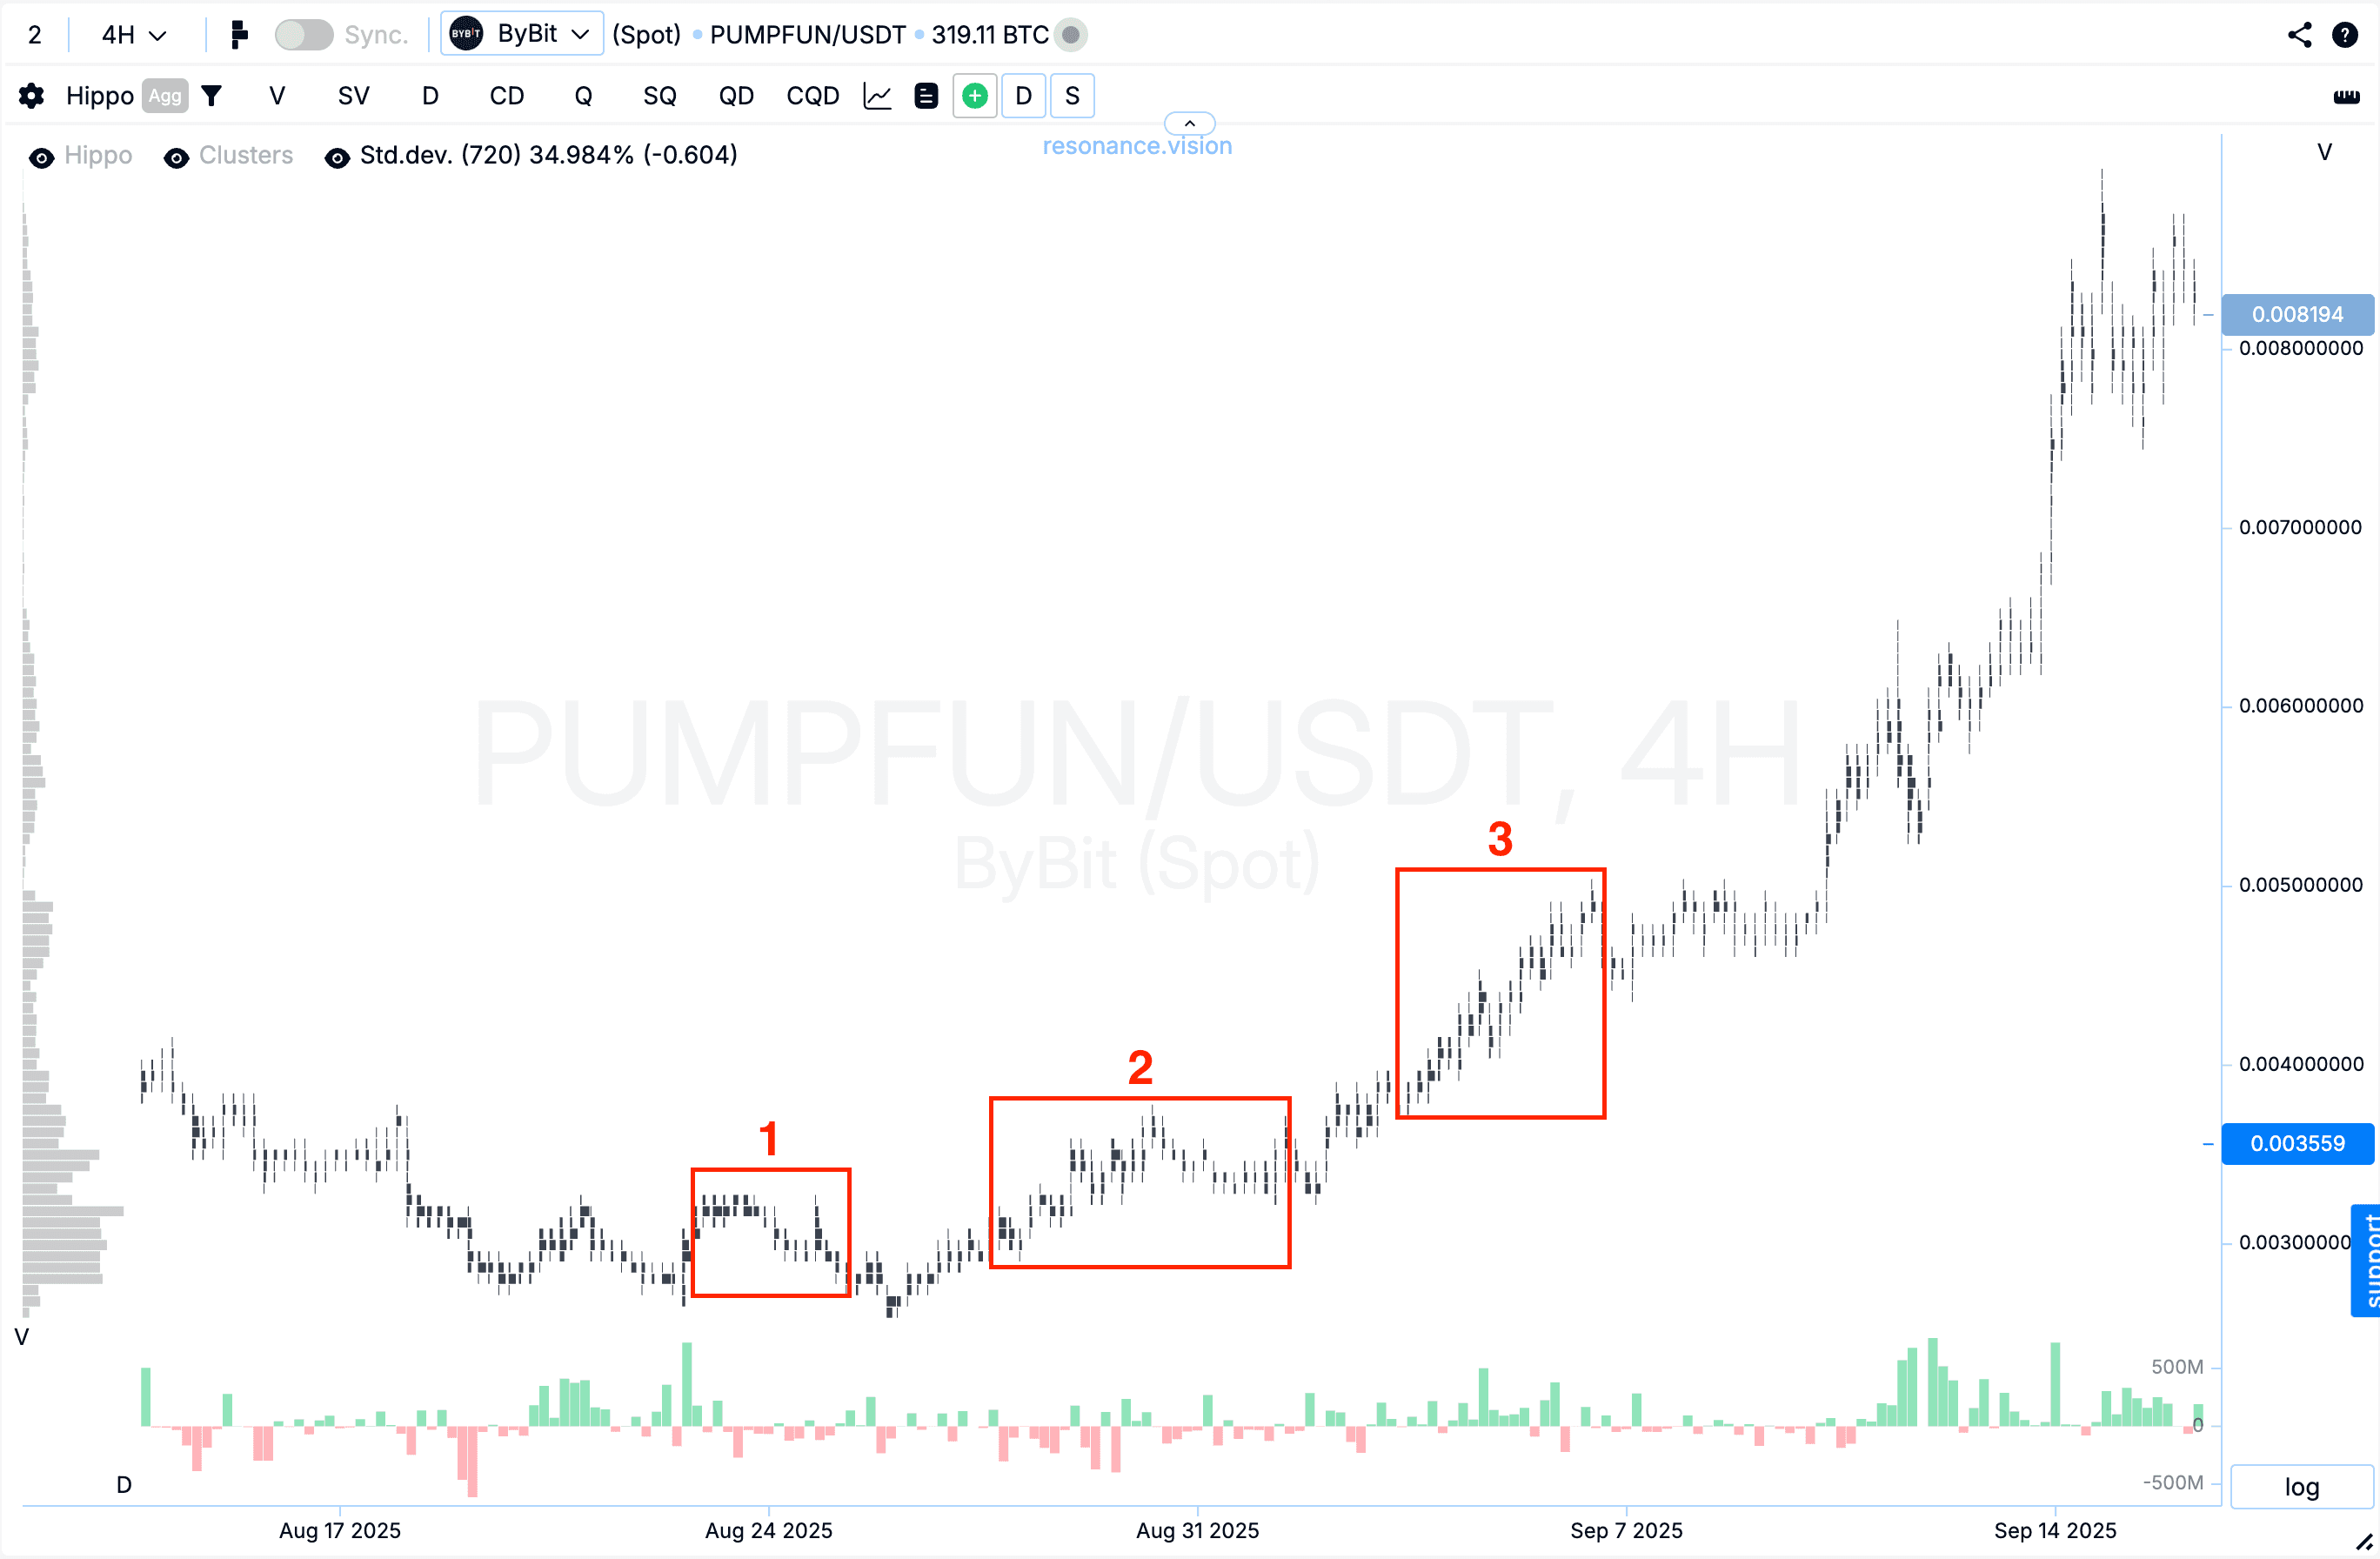
The true market context is defined by phases:
- Shortage formation
- Demand realization
- High volatility / consolidation
- Balance search
Evaluate how efficiently volume impacts price.
3. Exit by phase (for longs).
Don’t chase a fixed Risk/Reward ratio.
Exit when signs of Phase 3 appear.
Let profits grow, but don’t miss the reversal moment.
4. Stop-Loss = Protection.
Place it behind large limit orders (visible on Heat Map), not just “behind the wick.”
Discipline, diversification, risk management, and continuous learning — these are your main strategies.
Also, watch the full video on our YouTube channel (link coming soon).
Follow new insights in our telegram channel.
No need to invent complex schemes and look for the "grail". Use the Resonance platform tools.
Register via the link — get a bonus and start earning:
OKX | BingX | KuCoin.
Promo code TOPBLOG gives you a 10% discount on any Resonance tariff plan.
Recommended articles


