Who Really Drives the Trend

This is a continuation of the series on trend lines — but this time we go deeper, to the very point where movement is born. If it’s not indicators or algorithms that create a trend, then what does? Here you’ll find an explanation of how supply and demand work, why price moves in waves, what lies behind delta and volumes, and how market phases gradually replace one another. Discover how to see the real market behind the chart — it will help you understand the inner logic of the market and learn to read a trend not by lines, but by the actions of its participants.
Table of contents

This material is part of the series “Trend Lines in Trading: How to Build and Use Them Correctly”.
You are reading the continuation of an educational series on trend lines.
Each part of the series is designed as a step-by-step course for those who want to understand how trend lines work in online trading and learn to apply them to build their own system of analysis and forecasting.
The series consists of:
- Fundamental Understanding of Trends. What a trend is, how it forms, types according to Dow, and the law of market inertia.
- Who Really Drives the Trend. Supply and demand, scarcity and surplus, volumes, delta, and market phases.
- Rules for Building and Confirming Trend Lines. How lines are constructed, the rule of two and three points, and validation through volumes.
This is a sequential series, best read from start to finish: each part builds on the previous one, forming a comprehensive understanding of how trend lines reveal the true behaviour of the market.
The Market Is Not a Chart—It’s People
Most beginners look at a chart and assume that trend lines, by themselves, show the direction of price movement. But if you dig deeper, it becomes clear: trend lines don’t control the market — trends are created by people.
Every movement stems from the decisions of real participants: some buy, others sell; some lock in profits, others panic. This balance between supply and demand shapes the entire market.
When demand outweighs supply, the price rises. When supply dominates, it falls. It’s that simple. No indicator will work if you don’t grasp this fundamental concept.
Trend lines are merely a visual representation of the struggle between supply and demand—nothing more. To make them truly effective, you need to look beyond the price and see what drives it: where scarcity emerges and where surplus takes hold.
The Law of Supply and Demand: How Movement Is Born
When talking about trading, it’s worth starting with the foundation—the law of supply and demand.
It shows:
- The higher the price, the fewer people are willing to buy.
- The lower the price, the fewer people are willing to sell.
At some point, these two forces intersect—and that’s the point of equilibrium where a new trend is born.
In trading, it’s straightforward: if buyers absorb everything sellers offer, a scarcity forms. Supply runs short, so the price rises as buyers pay more.
As soon as there’s too much supply and too little demand, a surplus emerges, and the price starts to fall because sellers accept lower prices.
This mechanism works everywhere—on the exchange and in the marketplace.
Trend lines simply reflect the outcome of this interaction, but they don’t create it.
How to See What’s Behind the Price
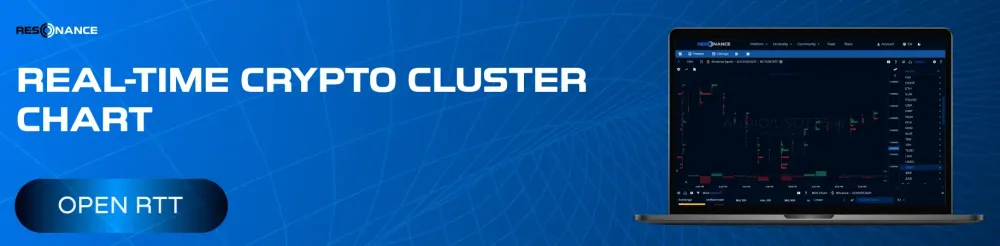
If you’re analysing the market not just through candlesticks but by looking at a cluster chart—congratulations, you’re already seeing the real market, not its shadow.
True movement is always visible where there’s volume. A cluster chart reveals whether the actions of buyers or sellers are effective.
Here, tools come into play that let you see beyond a standard chart:
Cluster Chart — shows where large volumes of trades occurred at specific price levels.
Delta — the difference between market buys and sells.
If the delta is positive (more buyers) but the price isn’t rising, it’s ineffective demand. If the delta is negative and the price is falling, sellers are genuinely pressuring the market.
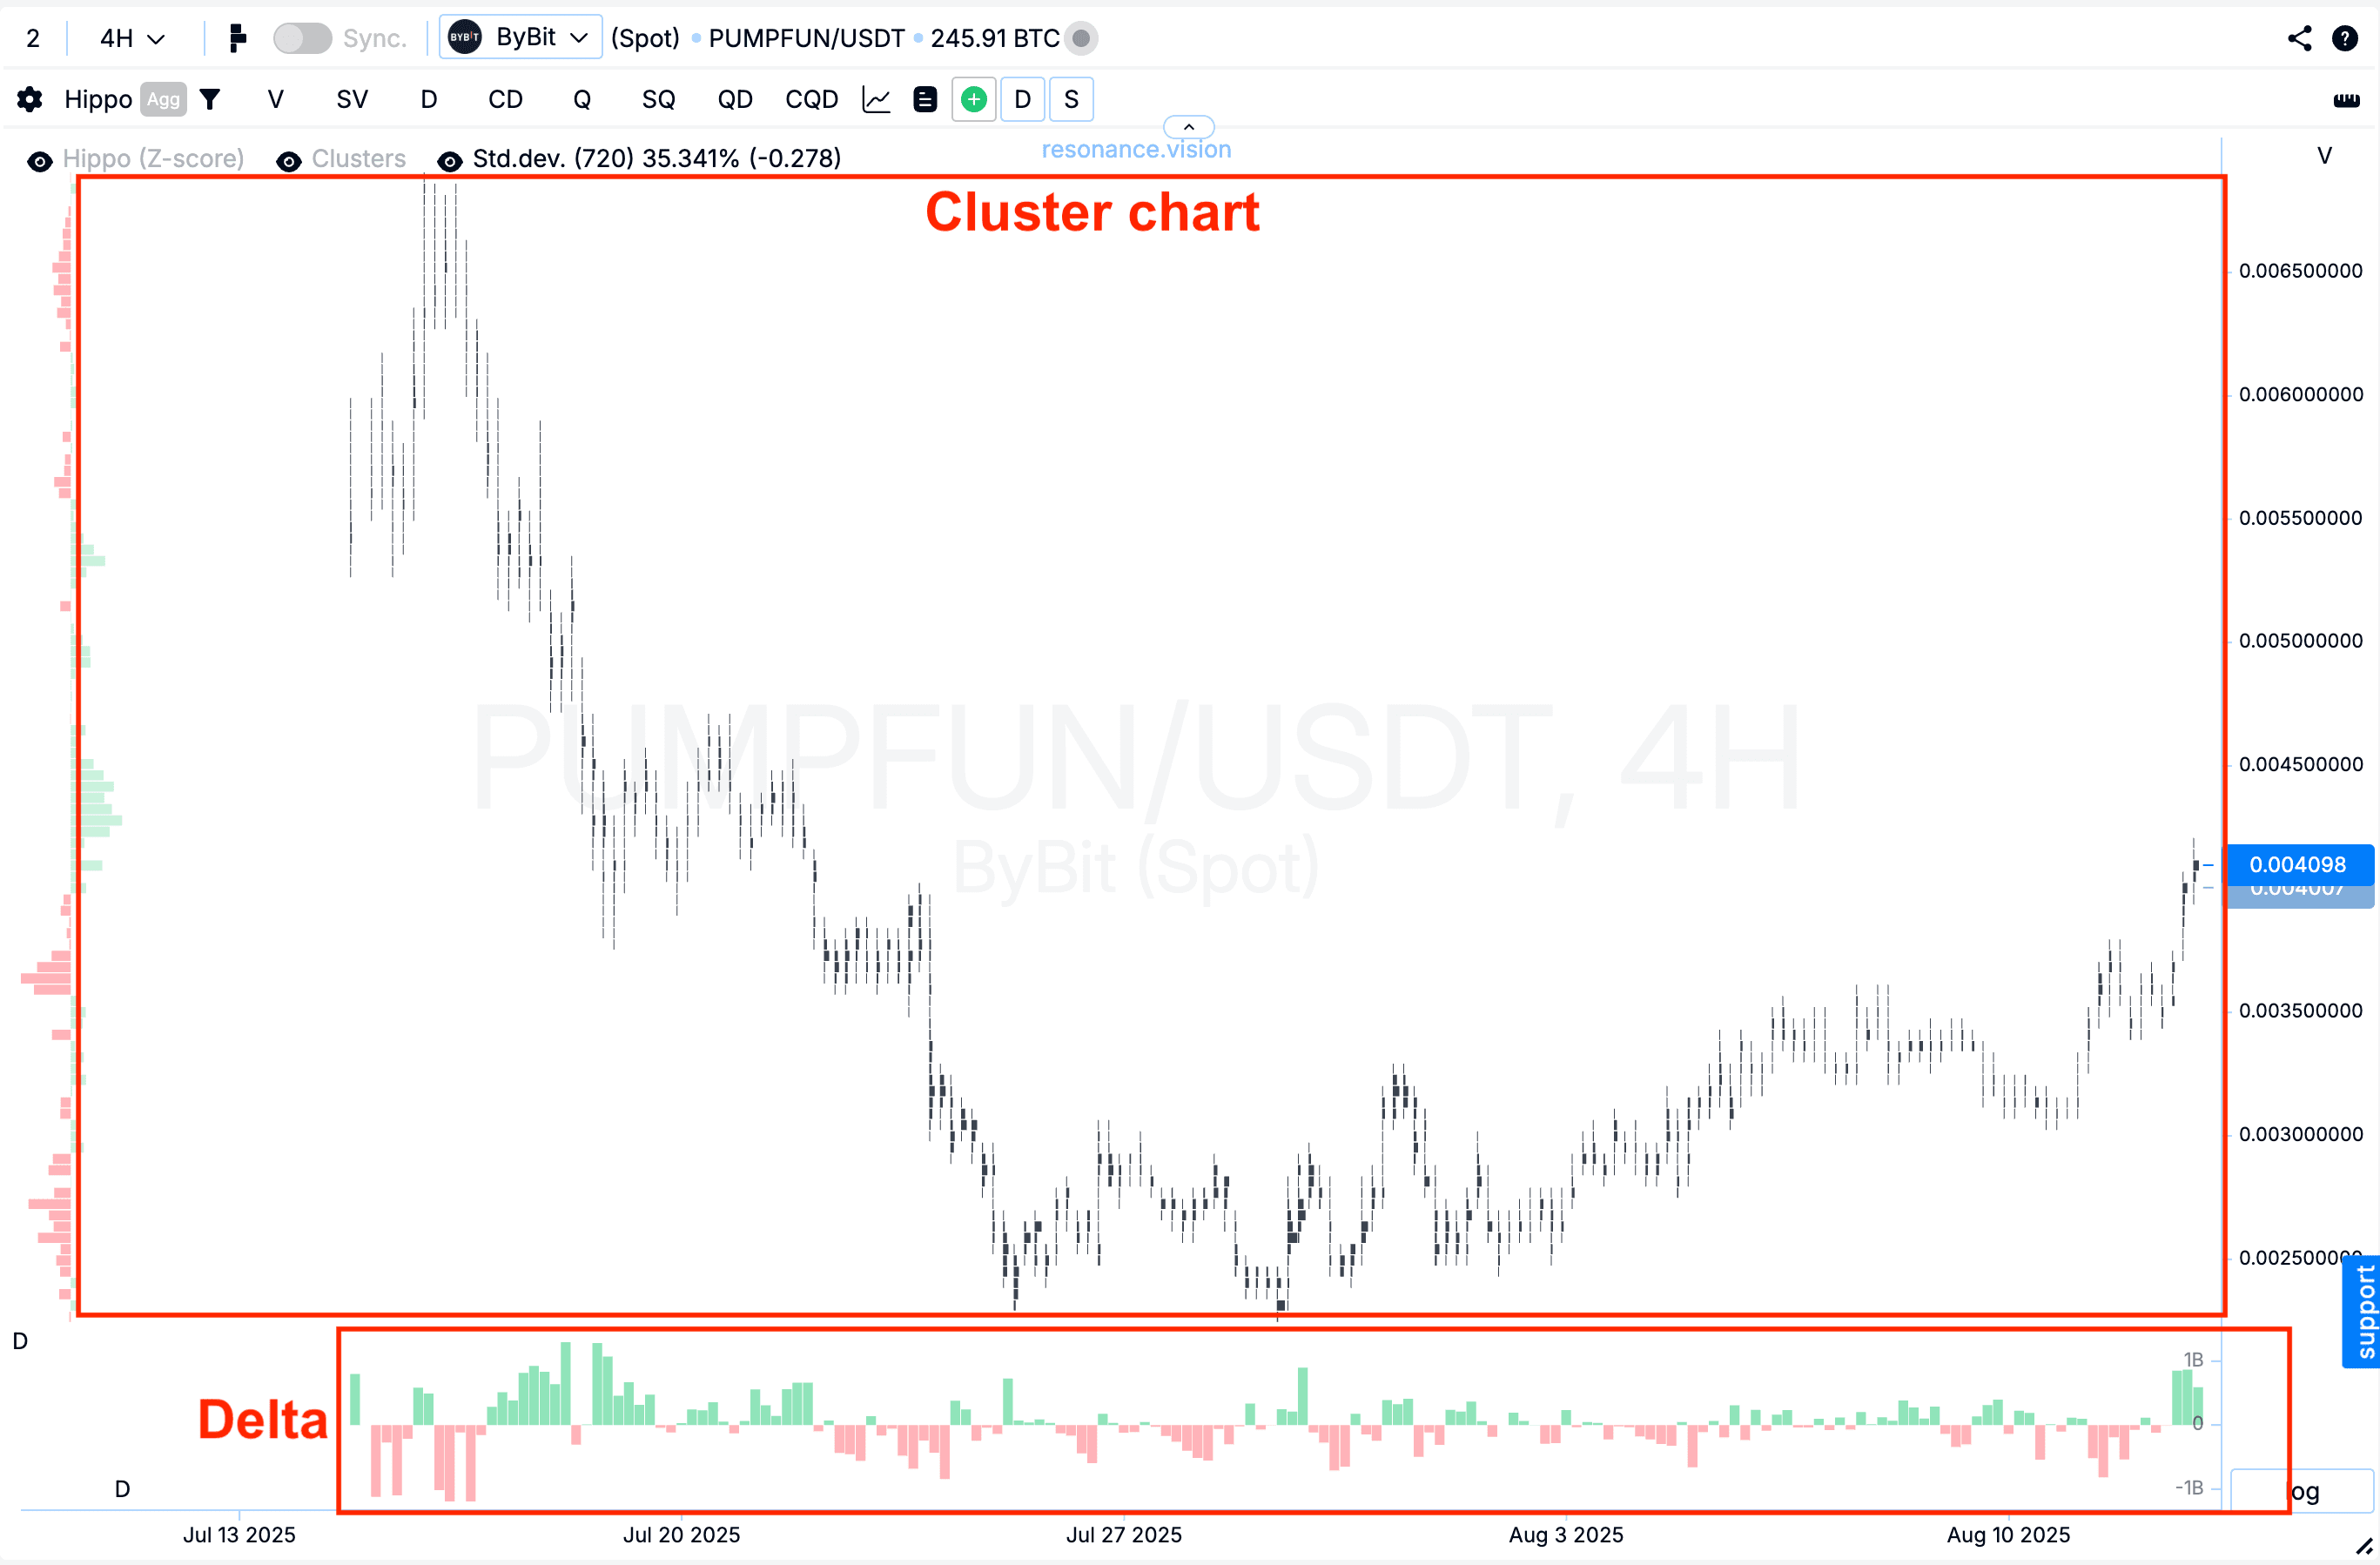
The influence of volume on price is the most honest indicator of who’s in control.
These tools explain why trend lines sometimes work and sometimes don’t. If a movement lacks real volume, an uptrend will crumble at the first sign of selling.
The Four Phases of the Market: From Accumulation to Distribution
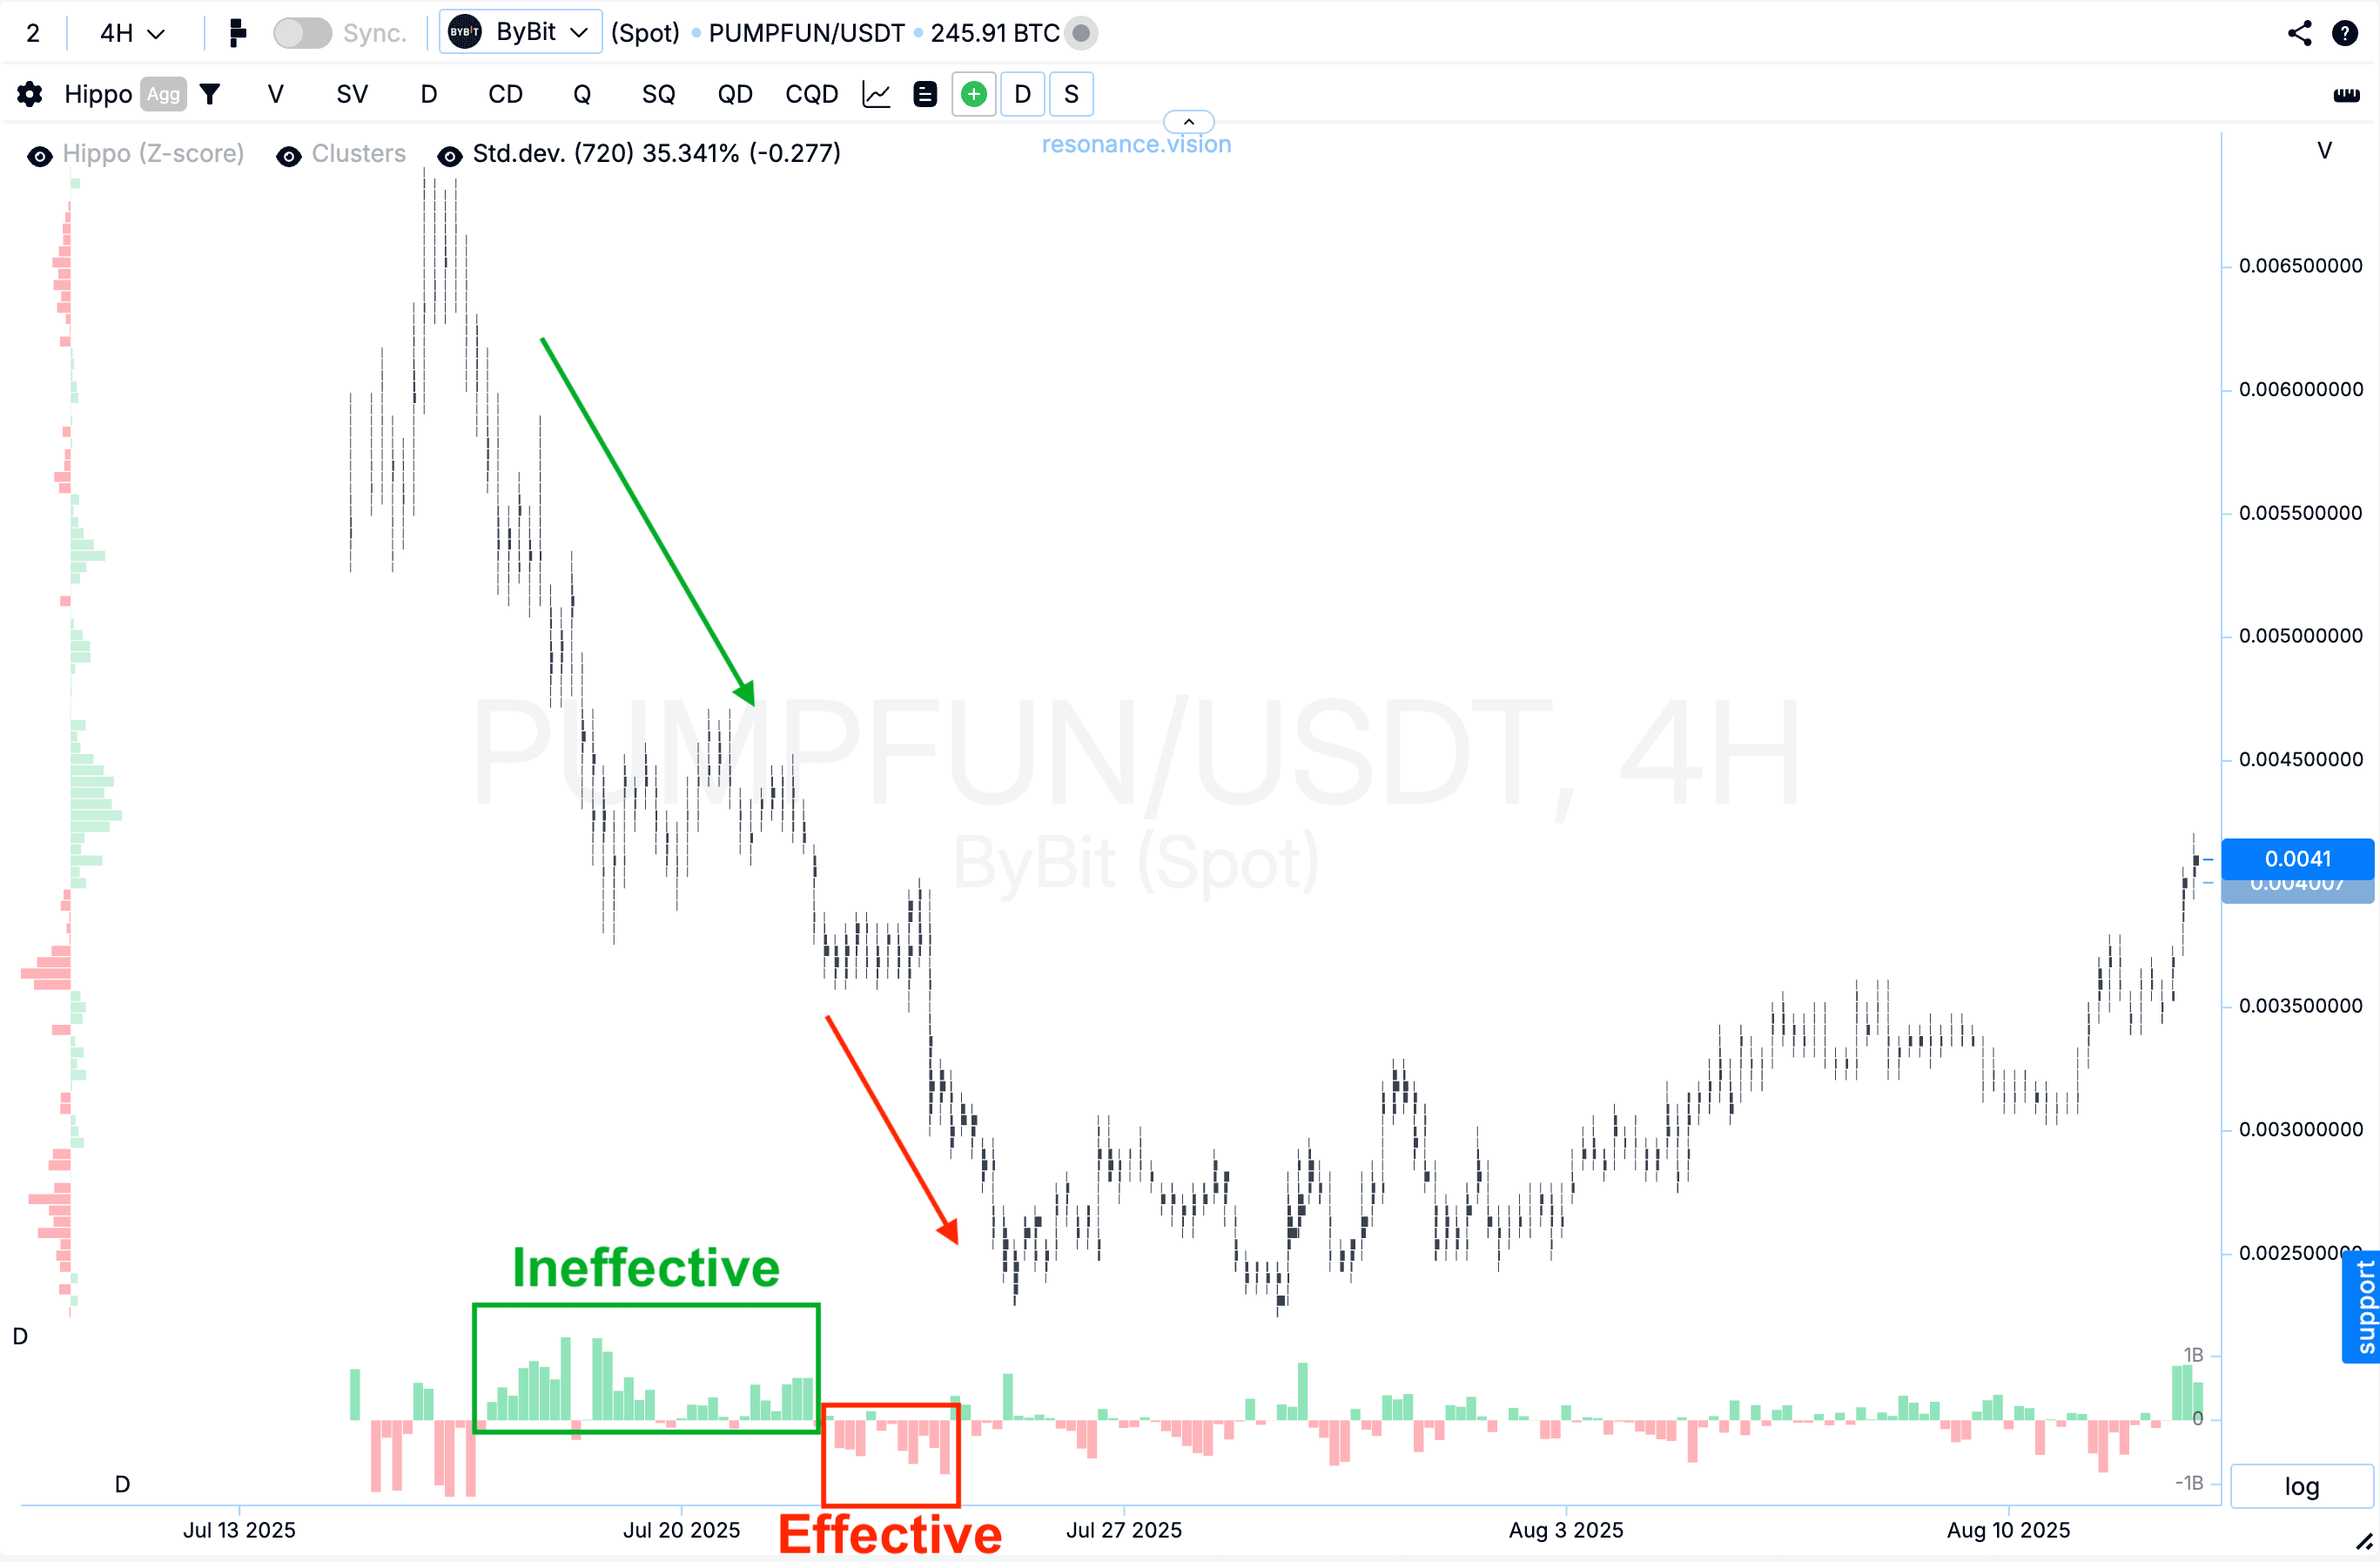
Every trend goes through four phases—and understanding this gives traders a real edge.
Accumulation Phase
The market calms after a downward move, entering a flat range. Sales no longer push the price lower—a first hint that buyers are absorbing enough supply and gradually accumulating volume, creating scarcity.Advancing Phase
Buying starts to effectively push the price upward. This is when trend lines become visible even without indicators—demand dominates, and the price rises.Consolidation Phase
The market “runs out of breath” from its own growth. Participants who bought lower start locking in profits. The balance evens out as the volume of supply nearly matches the volume of demand.Distribution Phase
A surplus of supply emerges. Sales effectively pressure the price, and a downward movement begins.
If you understand which phase the market is in, you already have a forecast without relying on indicators.
Trend lines simply help confirm what’s already evident in the volumes.
Why Pullbacks Happen and How to Use Them
Many blame market makers or “manipulators” when the market pulls back sharply. In reality, it’s simpler: participants are just taking profits. Those who bought early in the trend eventually hold too large a share of the asset in their portfolio and reduce their position, locking in gains.
This creates a short-term surplus, and the price dips.
For a trader, this isn’t a disaster—it’s an opportunity.
If the market pulls back but selling volumes don’t push the price below the previous low, it’s a sign that scarcity persists. This is where you can plan a new trade in the direction of the trend, especially if you already have a position at a lower level. New trades will carry higher risks.
This is how trend line strategies work: buy on bounces from support lines when volume shows active demand, and sell when you see a real increase in supply.
Conclusion: Who Shapes the Trend
Trends aren’t formed by algorithms, indicators, or analysts. They’re shaped by real people—their trades, their actions driven by rationality, fear, or greed.
When they buy, the price rises. When they sell, it falls.
Trend lines simply help you see this on the chart to navigate the movement.
If you want to truly understand the market, don’t ask how to draw a trend line—ask who holds the advantage in volume.
Because every line is a consequence of the battle between supply and demand.
If you learn to see this balance, you’ll move beyond just drawing lines—you’ll build your own market logic, construct your own trends, make your own decisions, and make your online trading profitable.
Key Takeaway
Understanding supply, demand, and market phases shows that trend lines aren’t magical—they’re just a graphical representation of the life inside the chart.
Those who see this can move from random trades to deliberate ones.
This is how real forecasting, risk calculation, and strategies that work not on paper but in the real market are born.
Continued in the article “Rules for Building and Confirming Trend Lines”.
Follow new insights in our telegram channel.
No need to invent complex schemes and look for the "grail". Use the Resonance platform tools.
Register via the link — get a bonus and start earning:
OKX | BingX | KuCoin.
Promo code TOPBLOG gives you a 10% discount on any Resonance tariff plan.
Recommended articles


