Fundamental Understanding of Trends

This isn’t dry theory or a set of rules to memorise. It’s a clear answer to why trends emerge and how the market truly behaves — why it moves in waves, where price inertia comes from, and why the “power of money” always outweighs emotion.
Here you’ll see the logic behind every price movement — only the real mechanics of supply and demand.
If you want to understand where the market is really heading and learn to see not the chart, but the movement of money itself — start here.
Table of contents

Trend Lines in Trading: How to Build and Use Them Correctly (Series of Articles)
This material is part of the series “Trend Lines in Trading: How to Build and Use Them Correctly”.
All articles are written as a step-by-step course for those who want to understand how trend lines work in online trading and learn to apply them in building their own framework for analysis and forecasting.
The series consists of:
- Fundamental Understanding of Trends. What a trend is, how it forms, types according to Dow, and the law of market inertia.
- Who Really Drives the Trend. Supply and demand, scarcity and surplus, volumes, delta, and market phases.
- Rules for Building and Confirming Trend Lines. How lines are constructed, the rule of two and three points, and validation through volumes.
This is a sequential series, best read from start to finish: each part builds on the previous one, forming a comprehensive understanding of how trend lines reveal the true behaviour of the market.
Introduction
Understanding market structure is the foundation of any analysis, whether you’re dealing with cryptocurrencies, equities or futures. Trend lines reveal the direction in which the market is moving and indicate who currently holds the upper hand — buyers or sellers.
In modern online trading, where everything happens instantly, trend lines help visualise the structure of price movements, identify support and resistance levels, and develop a logical trading strategy based on them.
This series of articles explains everything step by step—from a basic understanding of trends to their practical application. We will cover how to construct a trend line, how to verify its reliability, and how to use it for entering, exiting, and calculating risk.
Each part is grounded entirely in the real logic of supply and demand, without myths or magical indicators.
As a result, you will gain a cohesive system that not only reveals the market’s direction but also provides tools for forecasting future movements.
This is the foundation without which it’s impossible to understand price dynamics or the behaviour of market participants. Most importantly, it’s simple, logical and practical.
What Is a Trend and Why Does It Matter?
Let’s start with the basics.
A trend is the direction of price movement. That’s it. Nothing mystical. If the price is predominantly rising, it’s an uptrend. If it’s falling, it’s a downtrend. And if it’s bouncing up and down without a clear pattern, it’s a flat or sideways market.
The crux of it is that the trend lies at the heart of technical analysis. Trading isn’t about predicting; it’s about observing. We don’t guess where the price will go — we simply observe which way the market is already moving and align ourselves with it.
Imagine you see a crowd moving in one direction. If you stand against it, you’ll get swept away. It’s the same with the market: it’s easier and more profitable to move with the flow than to try to prove everyone else wrong.
A trend isn’t just lines on a chart. It’s the result of human money at work—the outcome of a constant battle between those buying and those selling. As long as one side is stronger, the price moves in the direction they push it.
The Three Types of Trends According to Charles Dow
Over a century ago, journalist and analyst Charles Dow noticed a pattern: market prices don’t move chaotically; they move in waves. He formulated a simple yet brilliant idea—trends come in three types:
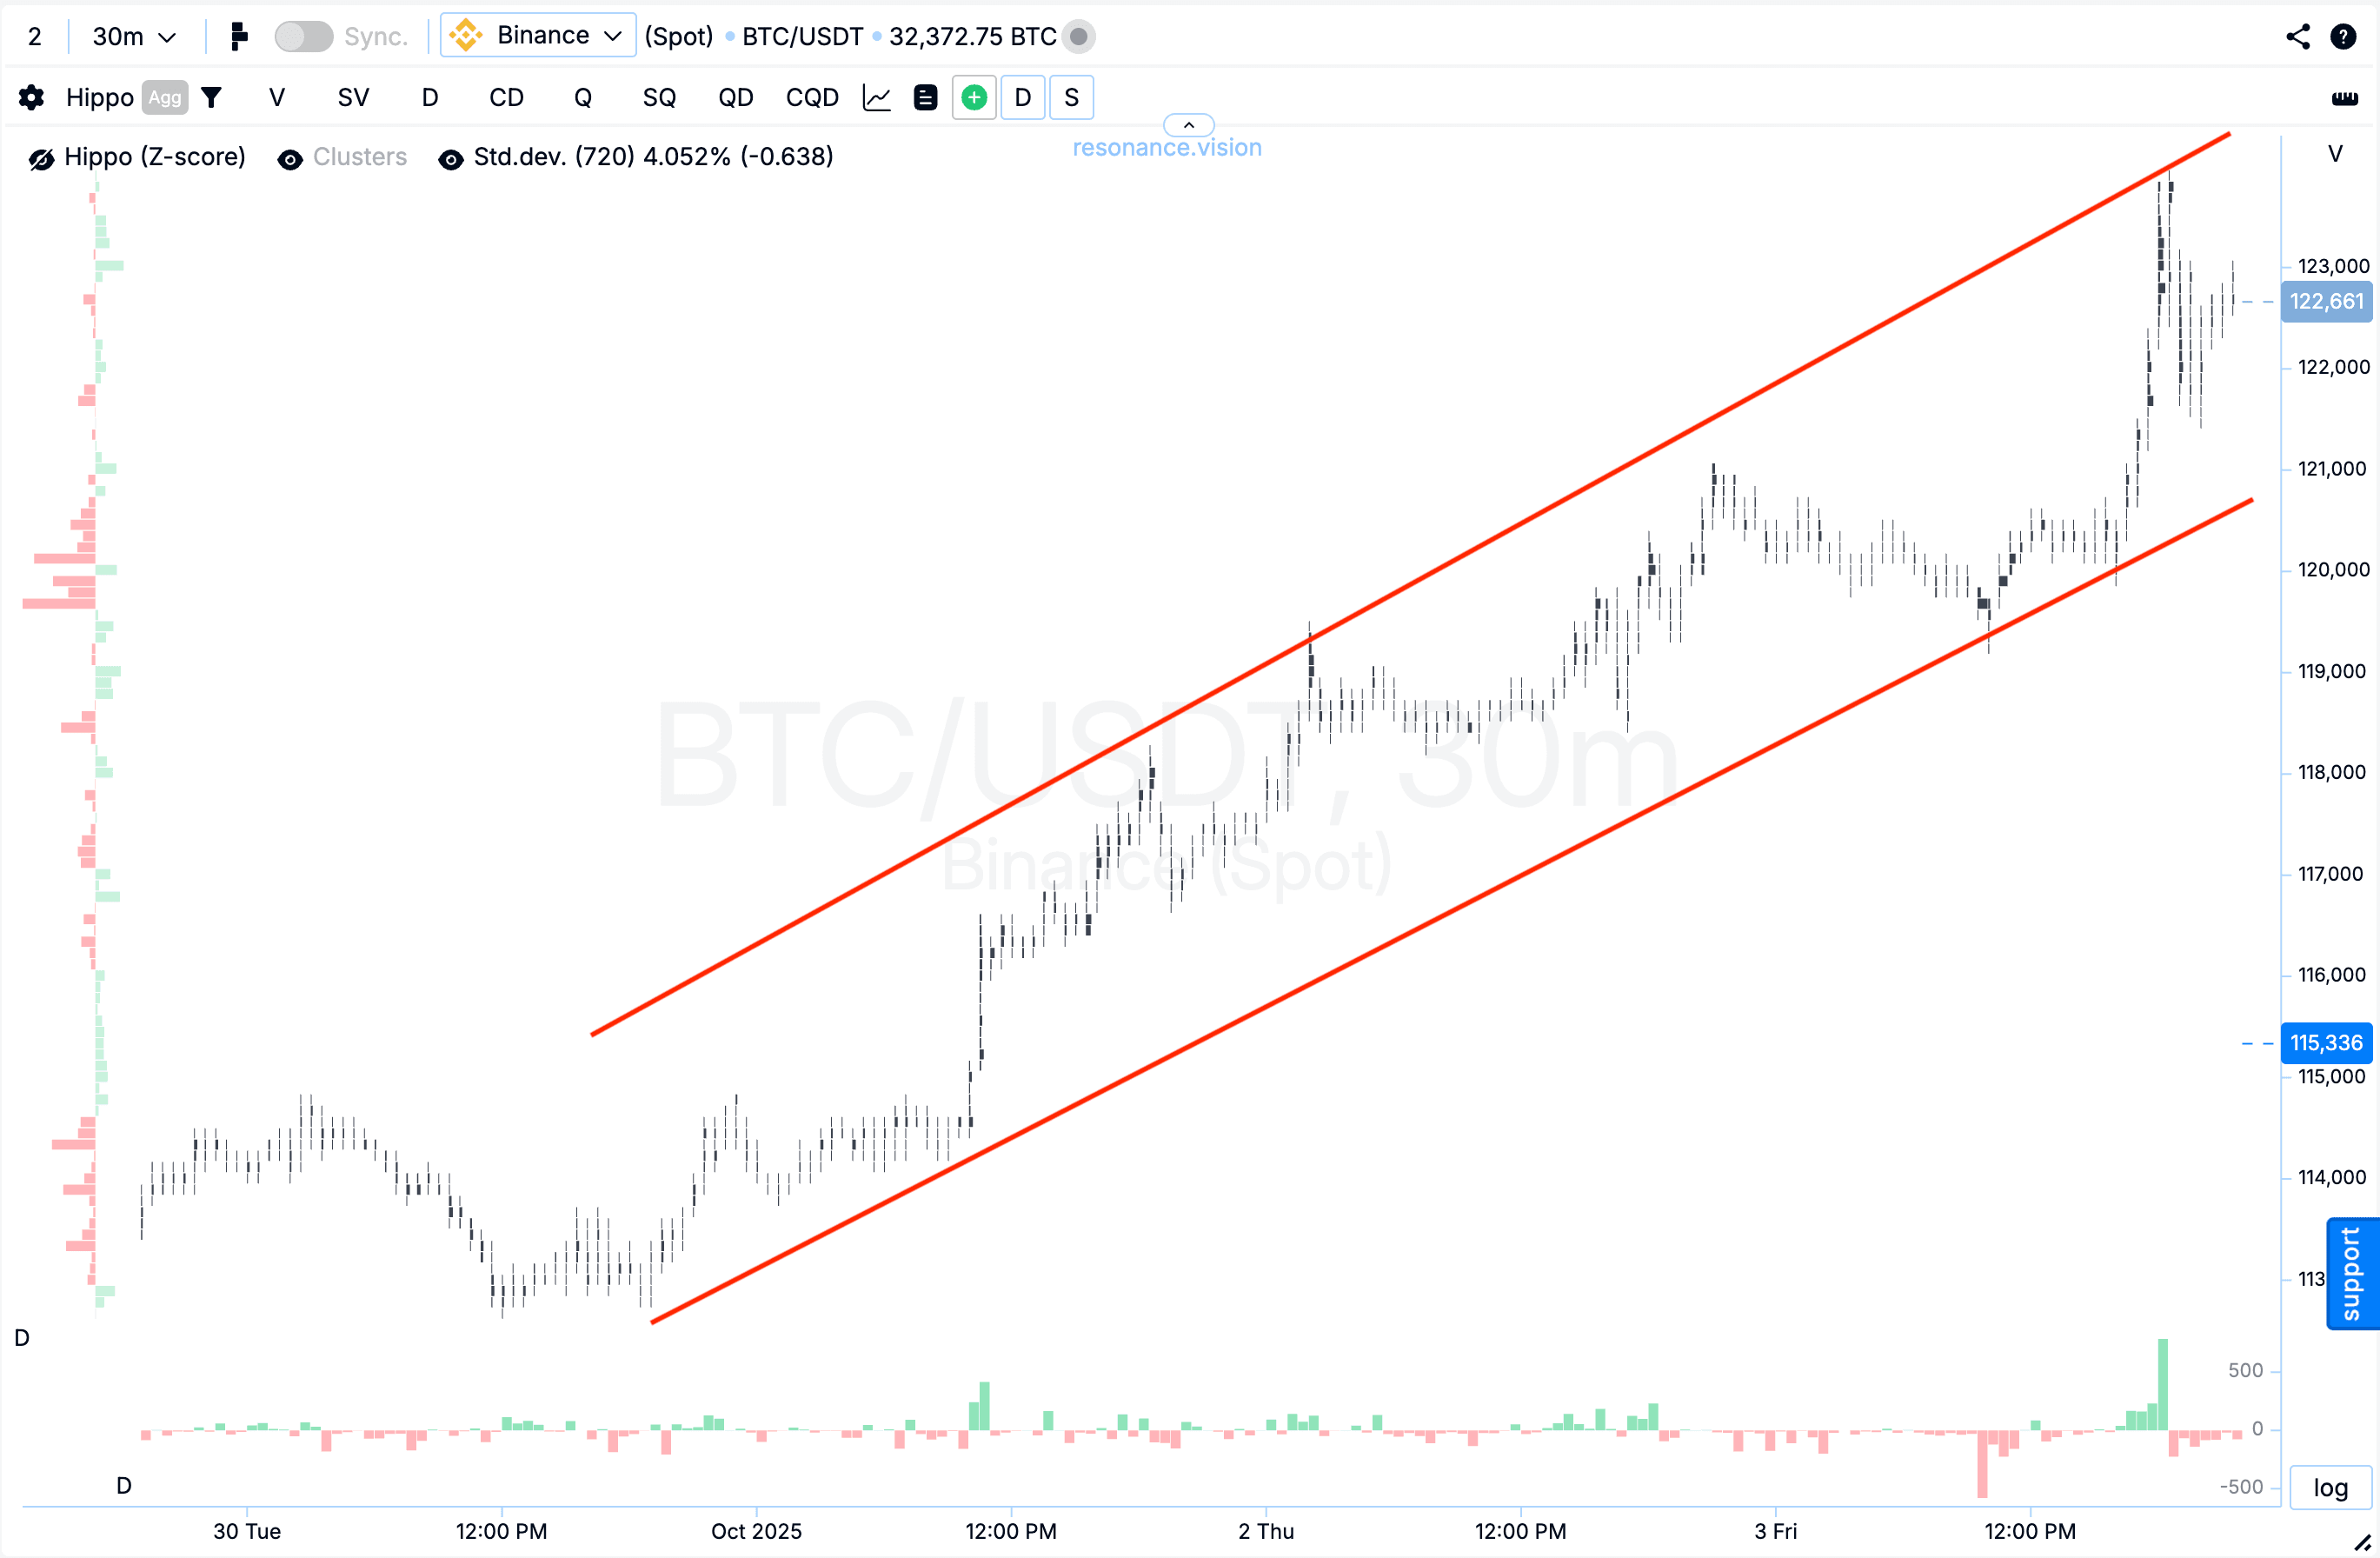
Uptrend (Bullish) — each new high and low is higher than the previous one. This is when the price steadily climbs upwards, like steps on a staircase.
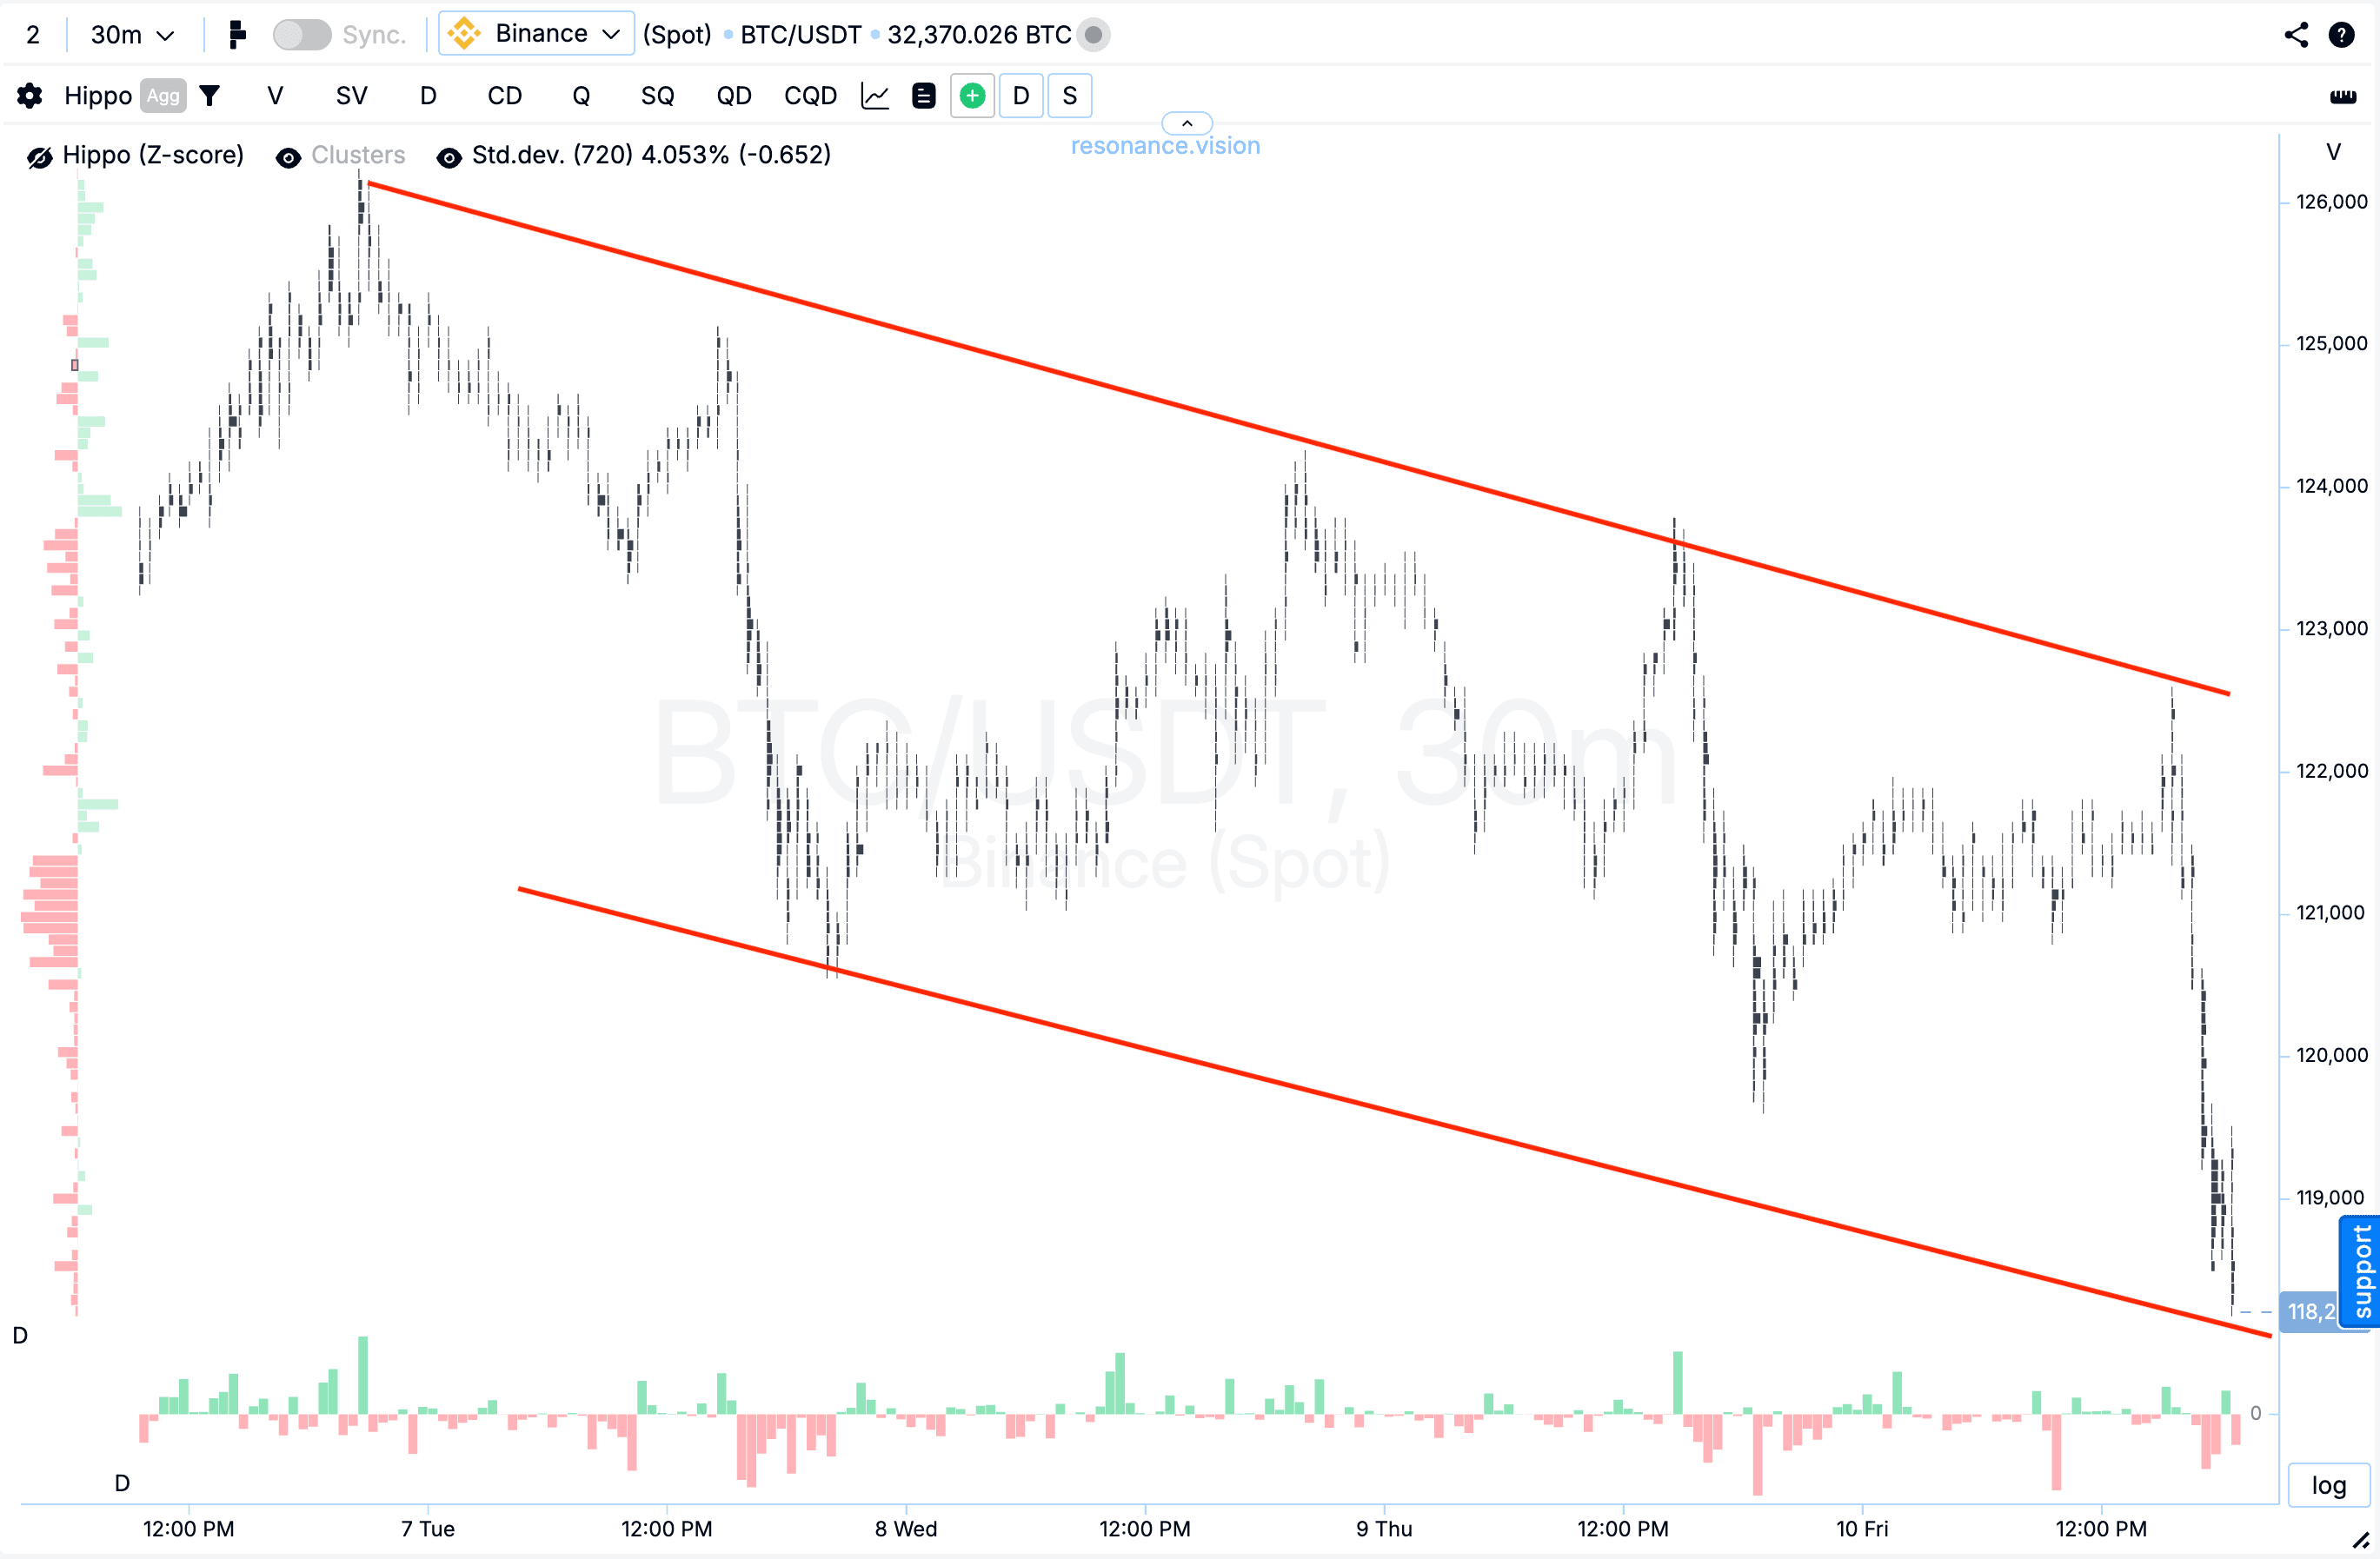
Downtrend (Bearish) — conversely, highs and lows get progressively lower. The market weakens, and sellers gain the upper hand.
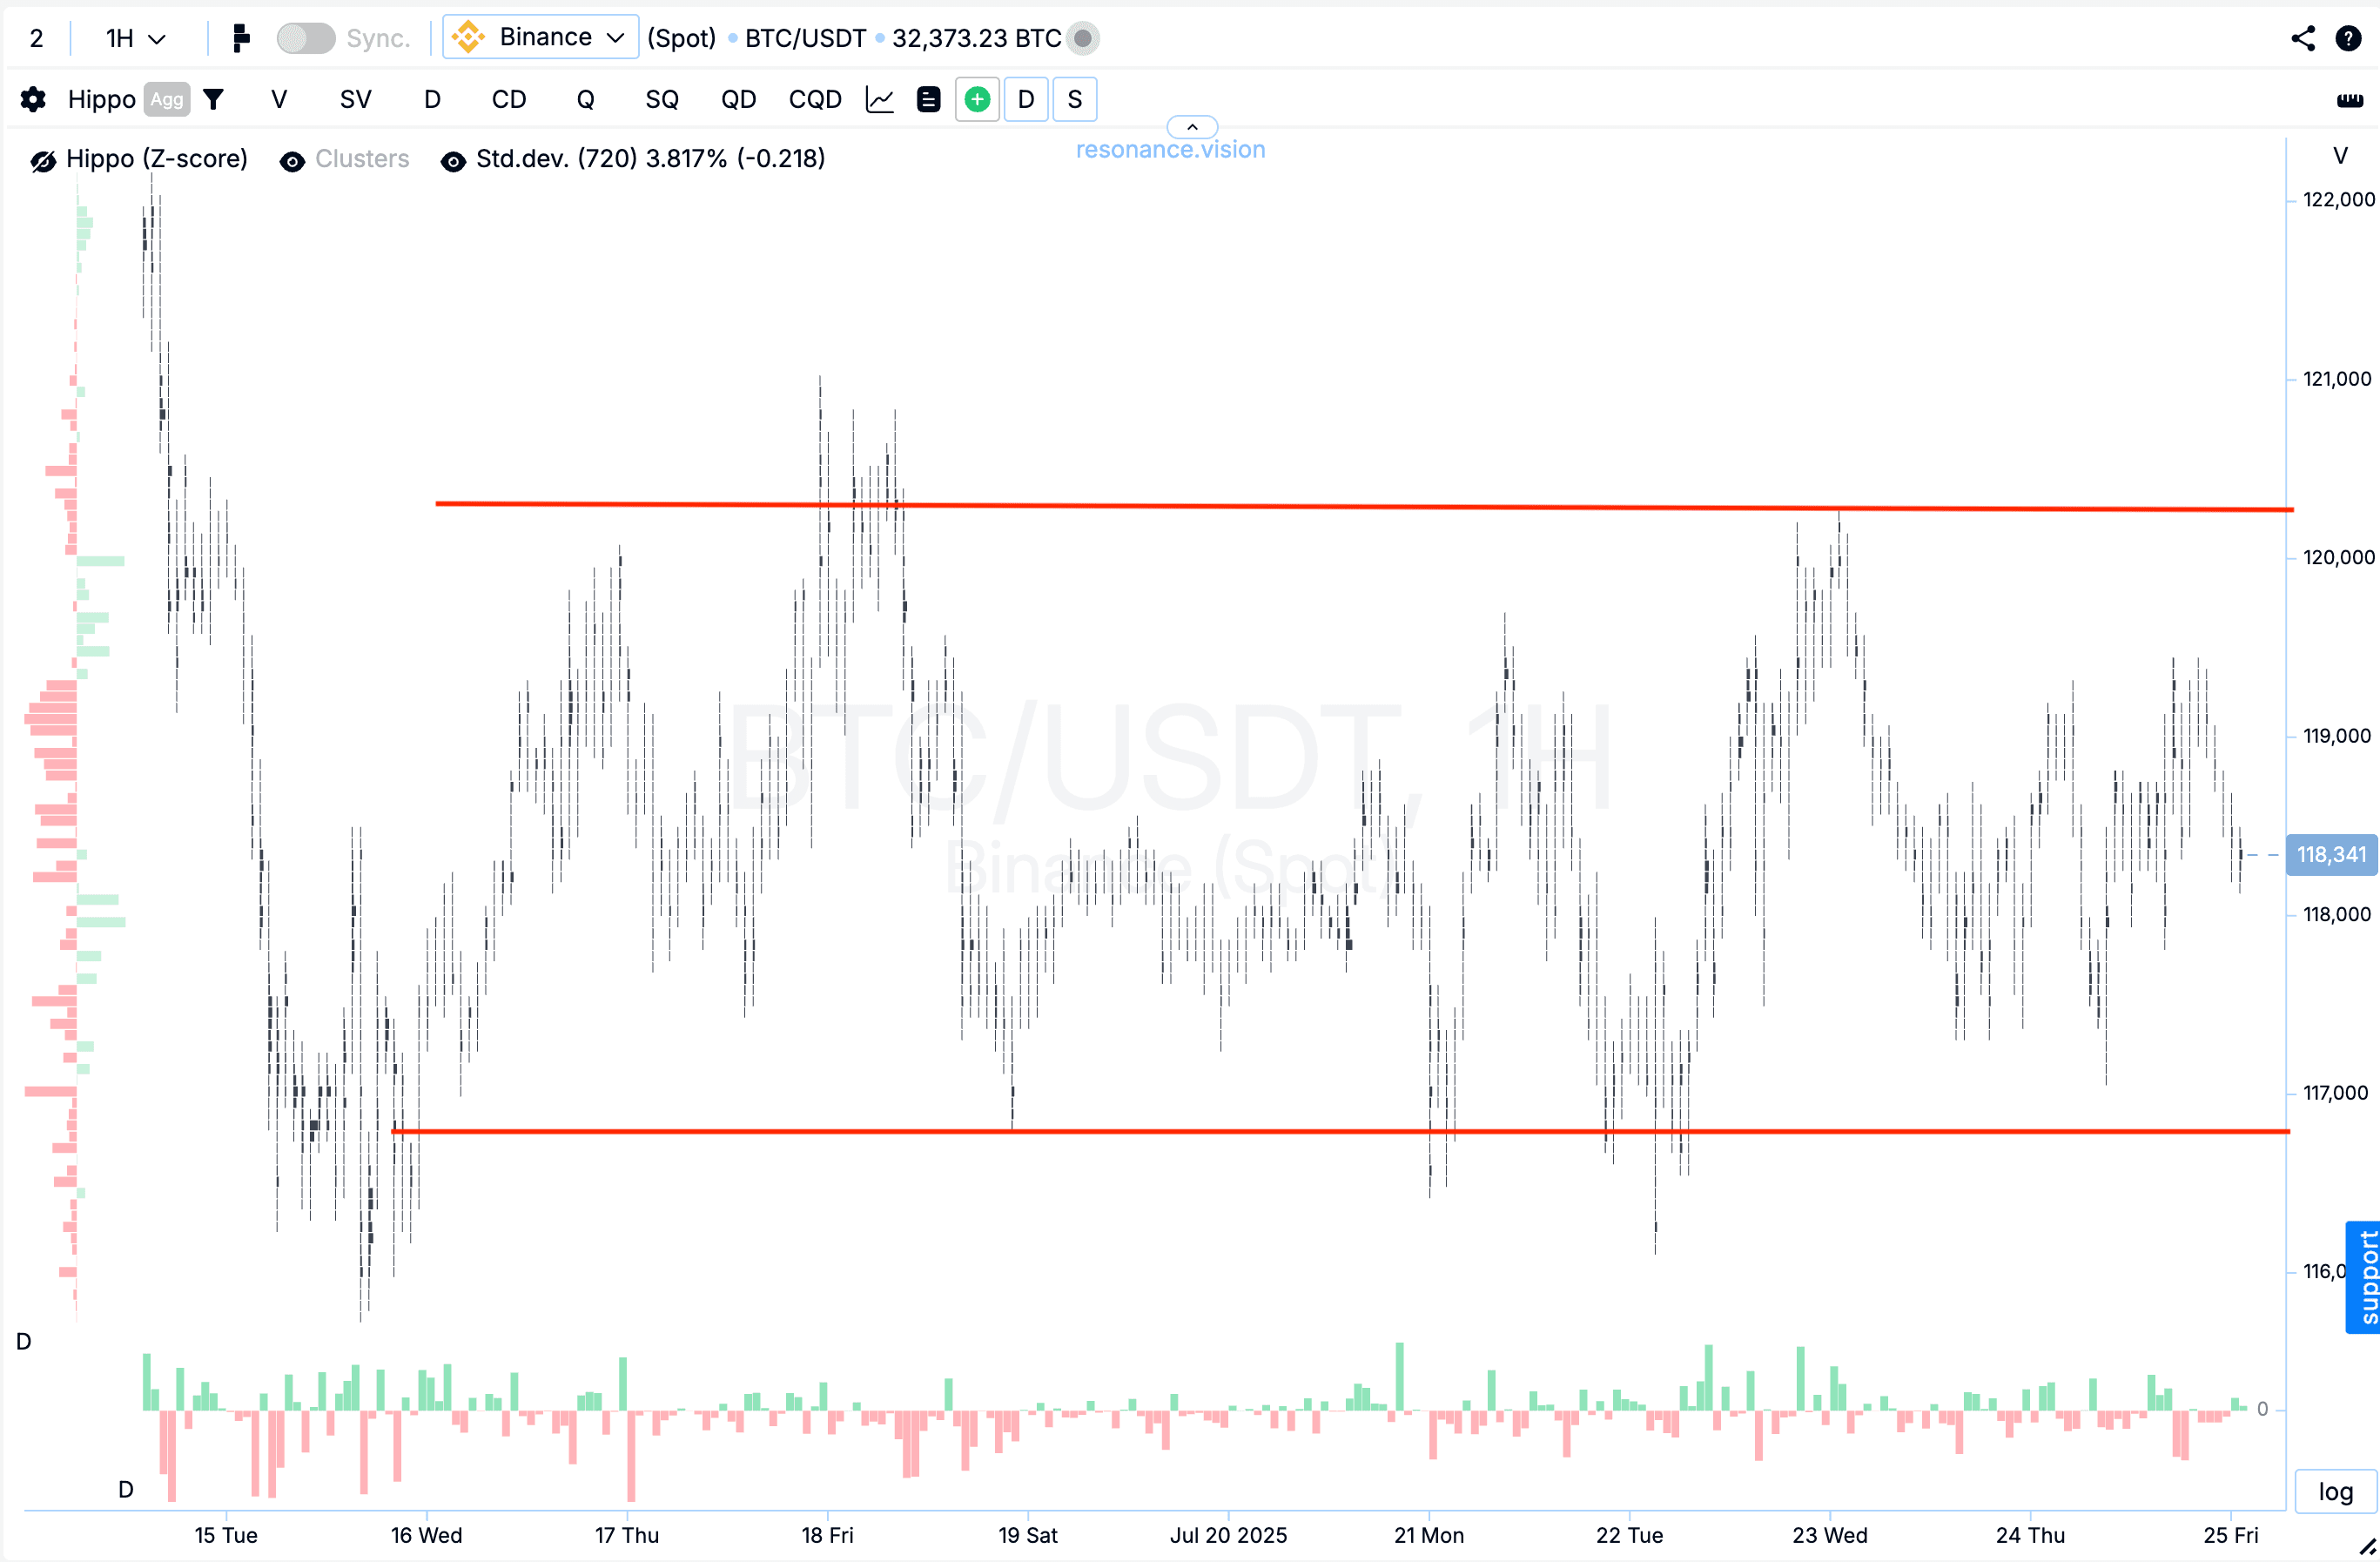
Sideways Trend (Flat, Consolidation) — a moment when the price seems lost: no clear new highs or lows, just oscillations within a range.
In Dow’s era, there were no analytical platforms, exchange APIs, or cluster charts. All he had were closing prices printed in daily newspapers. So, he analysed large movements—weeks, months, years. Yet even then, he observed: when the market starts rising, it tends to continue because people react with a delay.
Someone sees a stock rise by 10% and buys only after that. Others join even later. This “slow reaction” creates a wave effect—the movement persists until new buyers (or sellers) run out.
It’s simple but genius. This logic hasn’t changed in over a century.
All the indicators, algorithms, and models we have today are just attempts to more accurately capture those same three states: rising, falling, or flat.
The Law of Inertia: Why Price Keeps Moving
In physics, a body moves until the force pushing it dissipates. The market works the same way.
If the price is moving upward, it means someone is buying—and buying in large quantities. As long as that money keeps flowing in, the movement won’t stop.
Dow lived in a time when news travelled slowly. Investors learned of changes only the next day. So, even after stocks had risen, most people only started buying then—and the price continued climbing. Market inertia stems from the sluggishness of human decisions.
Now, exchanges operate 24/7, and news pours in every second, but the principle remains unchanged. It’s just that the “slow” ones are no longer individual people but large players. Funds can’t deploy billions in a second—they do it gradually, which is why trends last longer than you might expect.
Another key point: the market isn’t mathematics; it’s economics.
Mathematics deals with constants, but the market is about money and human decisions.
Today, people are inspired and buy everything in sight. Tomorrow, panic sets in, and they sell.
This is why prices move in waves, and why inertia persists: people don’t change their minds instantly.
Conclusion
A fundamental understanding of trends isn’t about drawing lines, indicators, or “magical” formulas.
It’s about the influence of money through human behaviour.
The price moves where the money pushes it.
A trend continues as long as demand outweighs supply (or vice versa).
A reversal begins when the balance shifts.
So, before drawing lines, pause and ask yourself: how much capital is behind this move?
The answer to that is the true understanding of a trend.
Watch for the next part in the series Who Really Drives the Trend.
Follow new insights in our telegram channel.
No need to invent complex schemes and look for the "grail". Use the Resonance platform tools.
Register via the link — get a bonus and start earning:
OKX | BingX | KuCoin.
Promo code TOPBLOG gives you a 10% discount on any Resonance tariff plan.
Recommended articles


