BANANAGAN +52.8% (Напрямкова стратегія Resonance)

Розбір угоди з опорою на кластерний аналіз та агреговані об’єми. Незважаючи на переважання ринкових продажів, ціна перестала знижуватися, що вказувало на локальний дефіцит та наявність лімітного попиту. Вихід виконаний після аномального руху та ознак перехоплення ініціативи продавцями, з фіксацією вже реалізованого імпульсу.
Зміст

Монета: BANANAGAN/USDT
Ризик: середній
Рівень розуміння: новачок
Причини входу
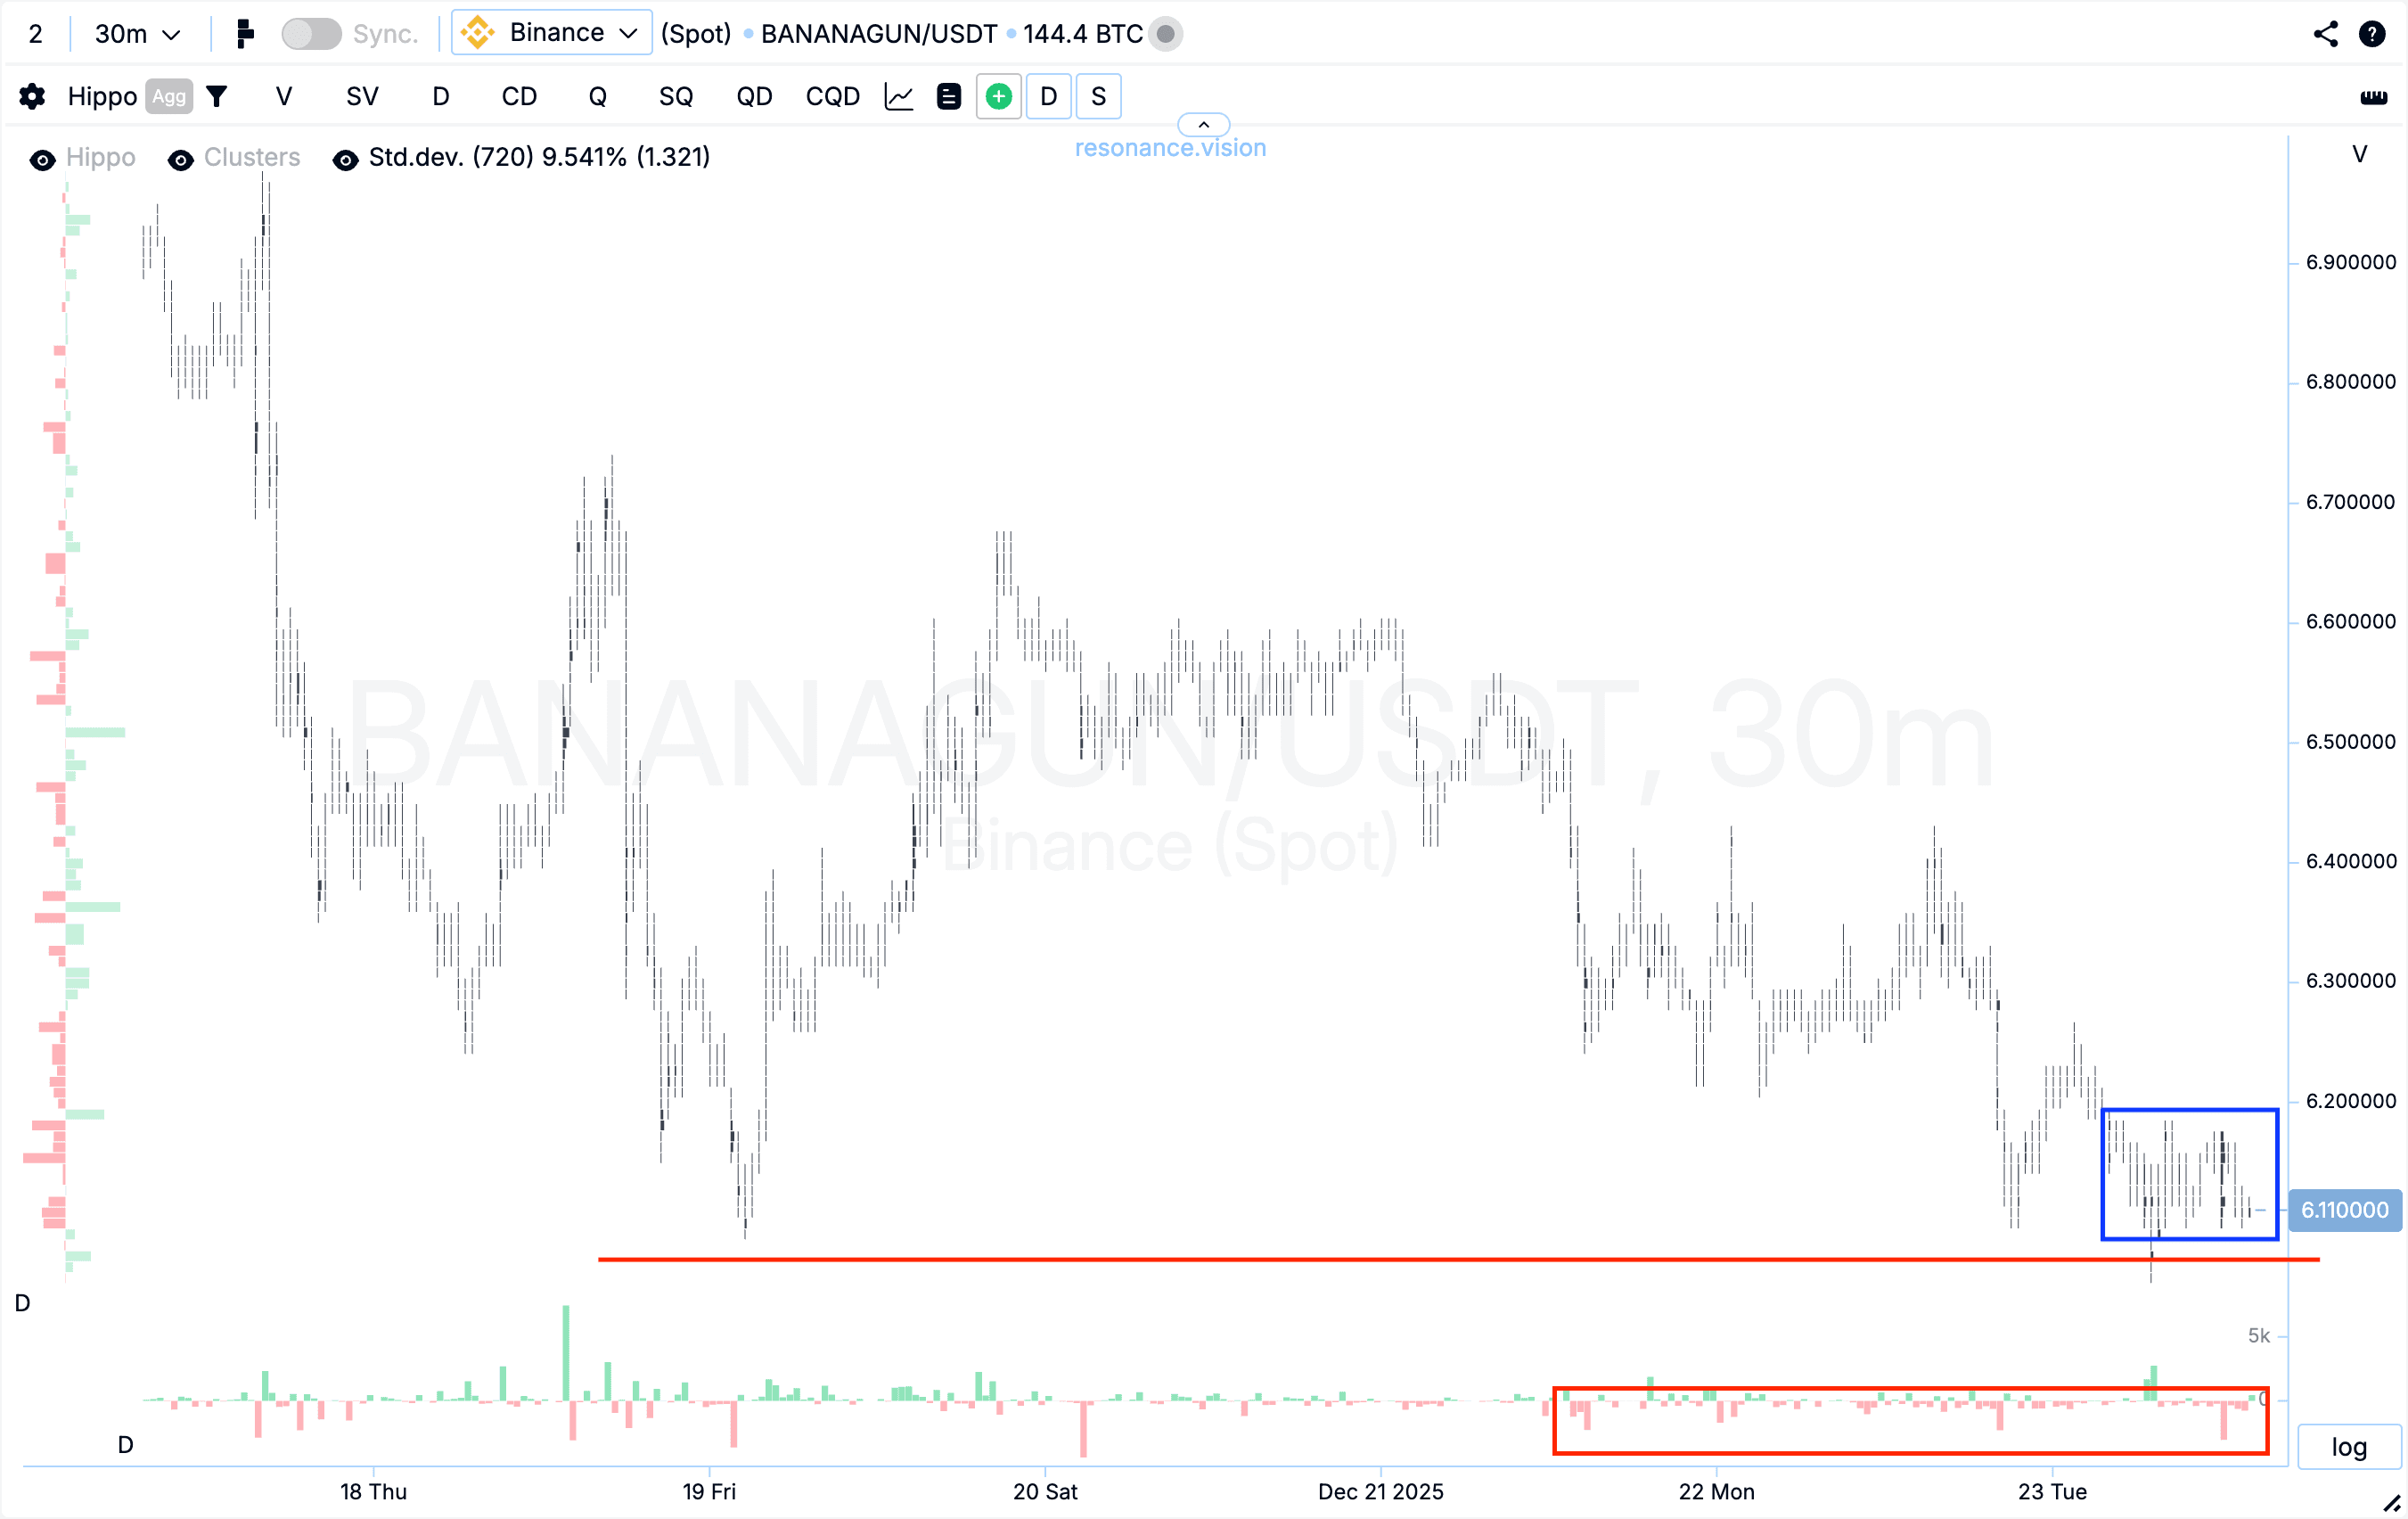
Кластерний графік: у фазі зниження почали формуватися великі об’ємні кластери (синій прямокутник). Протягом цього руху по ринку продовжували домінувати маркет-продаж, проте їх тиск виявився недостатньо для суттєвого оновлення локального мінімуму (червоний прямокутник і стрілка). Така реакція ціни вказує на появу ознак локального дефіциту та помітне ослаблення ініціативи з боку продавців.
У Дешборді
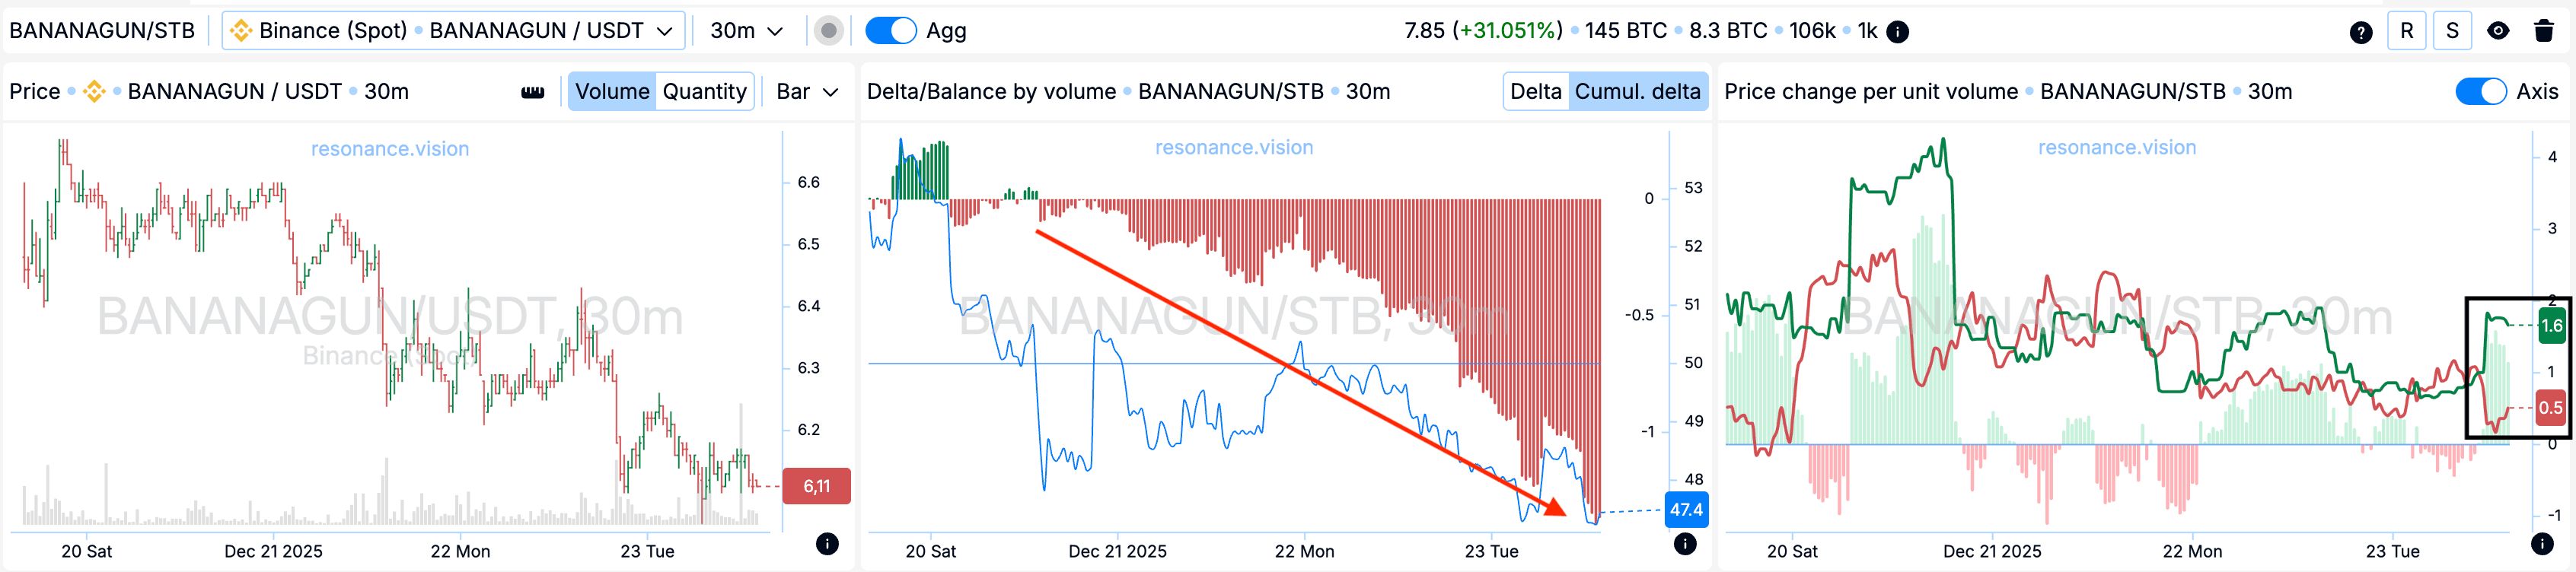
Дельта / Баланс за об’ємом: агреговані дані з усіх пар і бірж підтверджують спостереження з кластерного графіка. У аналізований період об’єми ринкових продажів збільшувалися, що виразно видно з гістограми кумулятивної дельти (червона стрілка). При цьому ціна перестала знижуватися, що говорить про готовність лімітних покупців поглинати весь вхідний маркет-об’єм. Така ситуація формує локальну підтримку та додатково підтверджує ослаблення тиску продавців.
Зміна ціни на одиницю об’єму: додатково видно, що ефективність впливу ринкових ордерів розійшлася на користь покупців (чорний прямокутник), що вказує на зростання ефективності покупок.
Причини виходу
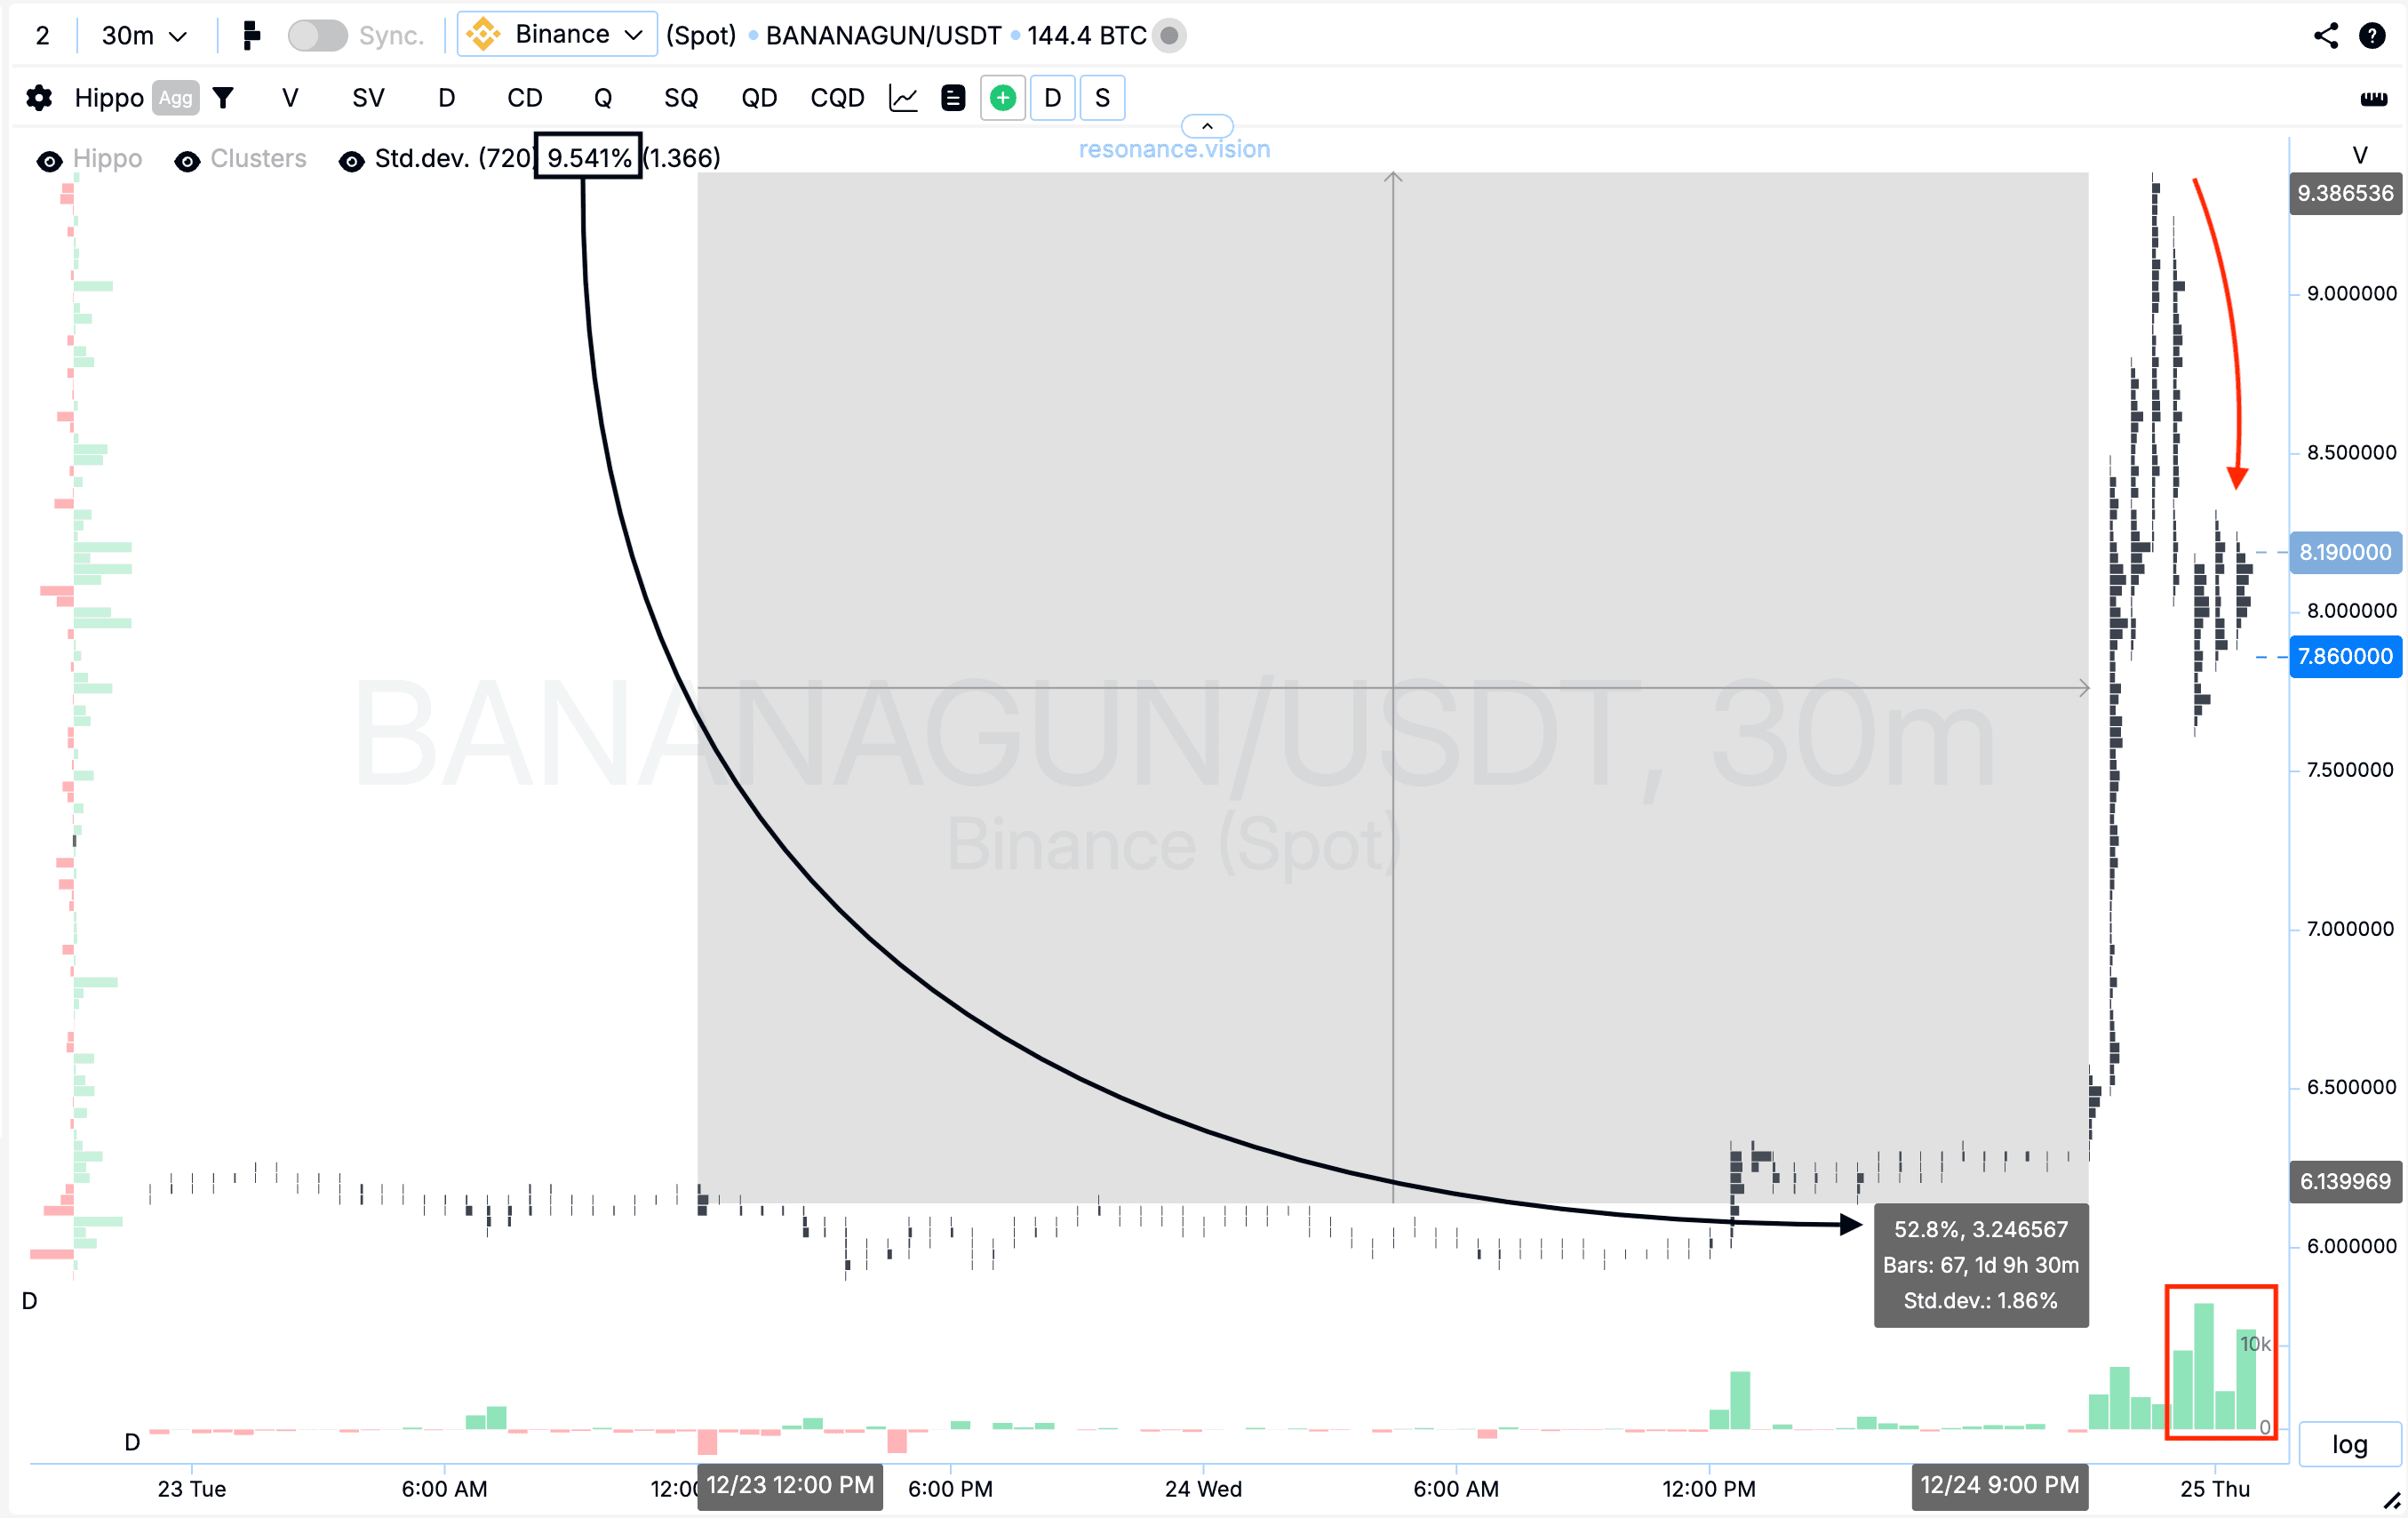
Кластерний графік: після точки входу ціна зросла на 52,8%, при цьому в даному діапазоні помітно зросла волатильність. На тлі покупок сформувався виражений відкат (червоний прямокутник і стрілка), що свідчить про перехід ініціативи до продавців. Варто також зазначити, що цей рух перевищив 5 стандартних відхилень, тоді як одне стандартне відхилення для активу становить 9,541% (чорний прямокутник та стрілка). Такий рух належить до категорії значущих і аномальних. У умовах подальше утримання позиції призводило б лише зростання ризику, тому фіксація прибутку виглядала найбільш логічним і зваженим рішенням.
Висновок
Розглянута ситуація є наочним прикладом того, як поєднання кластерного аналізу та агрегованих даних за обсягом дозволяє виявляти моменти ослаблення продавців та формування локального дефіциту. Вхід було здійснено у фазі зниження ефективності продажів, а вихід – після реалізації аномального руху та появи ознак зміни ініціативи. Такий підхід дозволяє працювати системно, контролюючи ризик і фіксуючи результат в умовах ринкової динаміки, що змінюється.
Стеж за новими статтями у нашому телеграм каналі.
Не треба вигадувати складних схем та шукати “грааль”. Використовуйте інструменти платформи Resonance.
Реєструйся за посиланням - отримуй бонус і починай заробляти:
OKX | BingX | KuCoin.
Промокод TOPBLOG дає тобі 10% знижки на будь-який тарифний план Resonance.
Рекомендовані статті


