Обзор рынка по ALT - 23.01.2026

Преобладающие маркет-продажи привели к откату, однако снижение было остановлено аномальными лимитными покупками. Цена остаётся в боковом диапазоне и проторговывается вблизи его нижней границы.
Содержание

В данном обзоре рынка мы не пытаемся прогнозировать будущее, наша задача констатировать факты которые мы имеем на текущий момент. И строить свои действия на основании текущих фактов, а не наших ожиданий и надежд.
Рыночные ордера и лимитные заяки
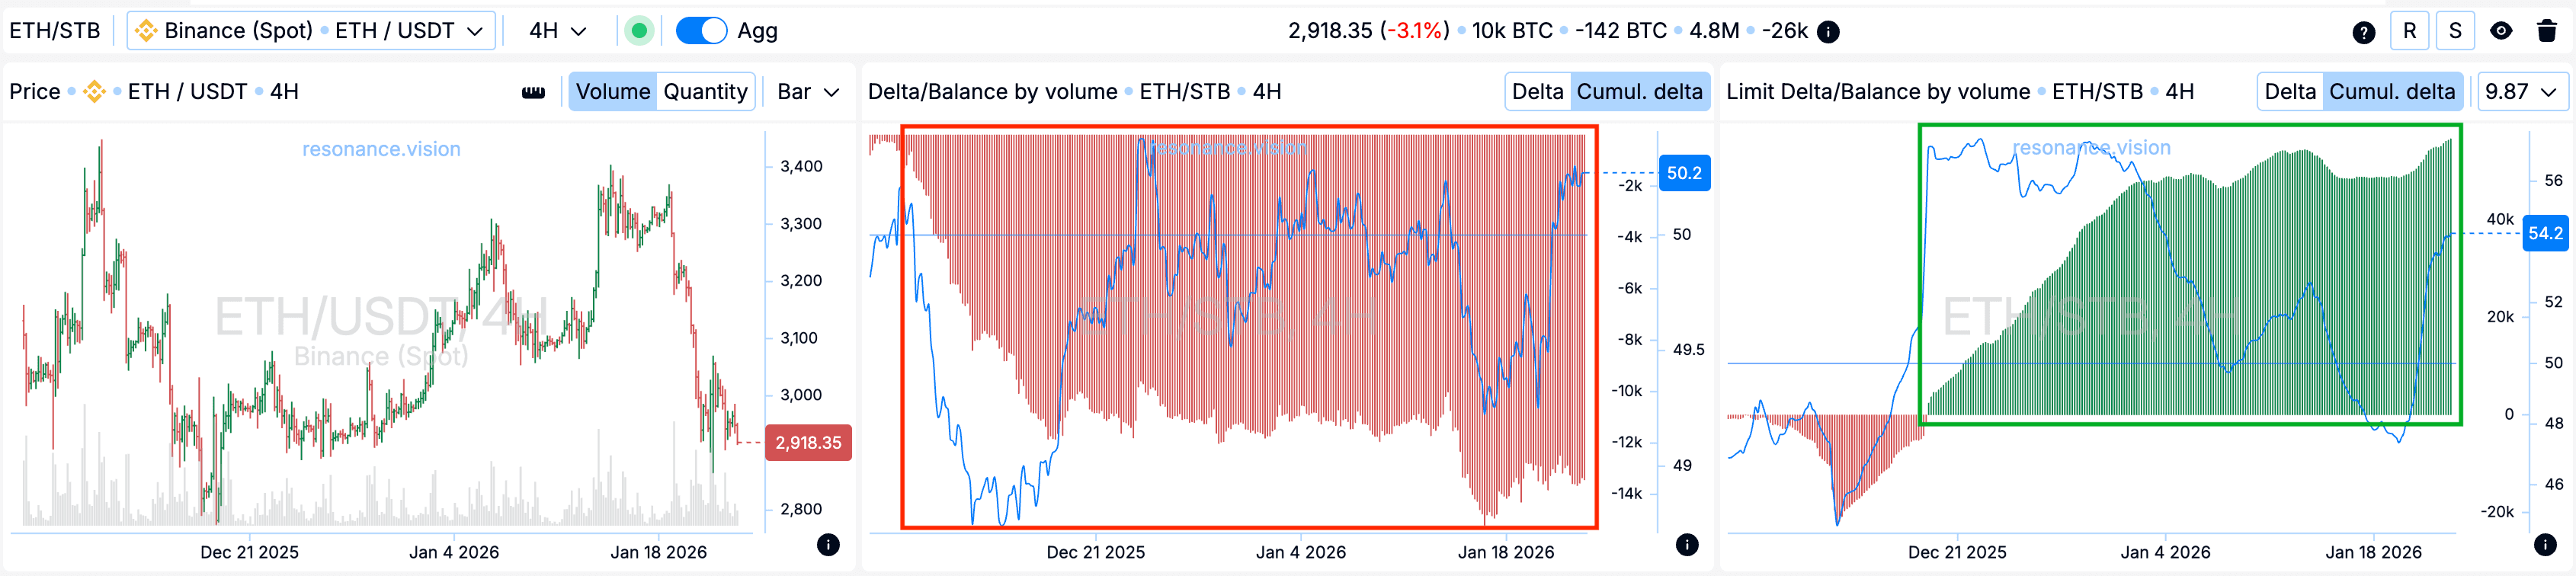
В агрегированном виде на протяжении продолжительного периода по маркет-ордерам сохраняется преобладание сделок на продажу (красный прямоугольник). Это отчётливо отражено на гистограмме кумулятивной маркет-дельты и указывает на устойчивое давление со стороны рыночных продаж.
Одновременно с этим по лимитным ордерам накопительно доминируют заявки на покупку (зелёный прямоугольник). В текущий момент данные объёмы выступают в роли поддержки, удерживая цену в рамках широкого бокового диапазона. При этом локально был зафиксирован достаточно существенный откат цены вниз.
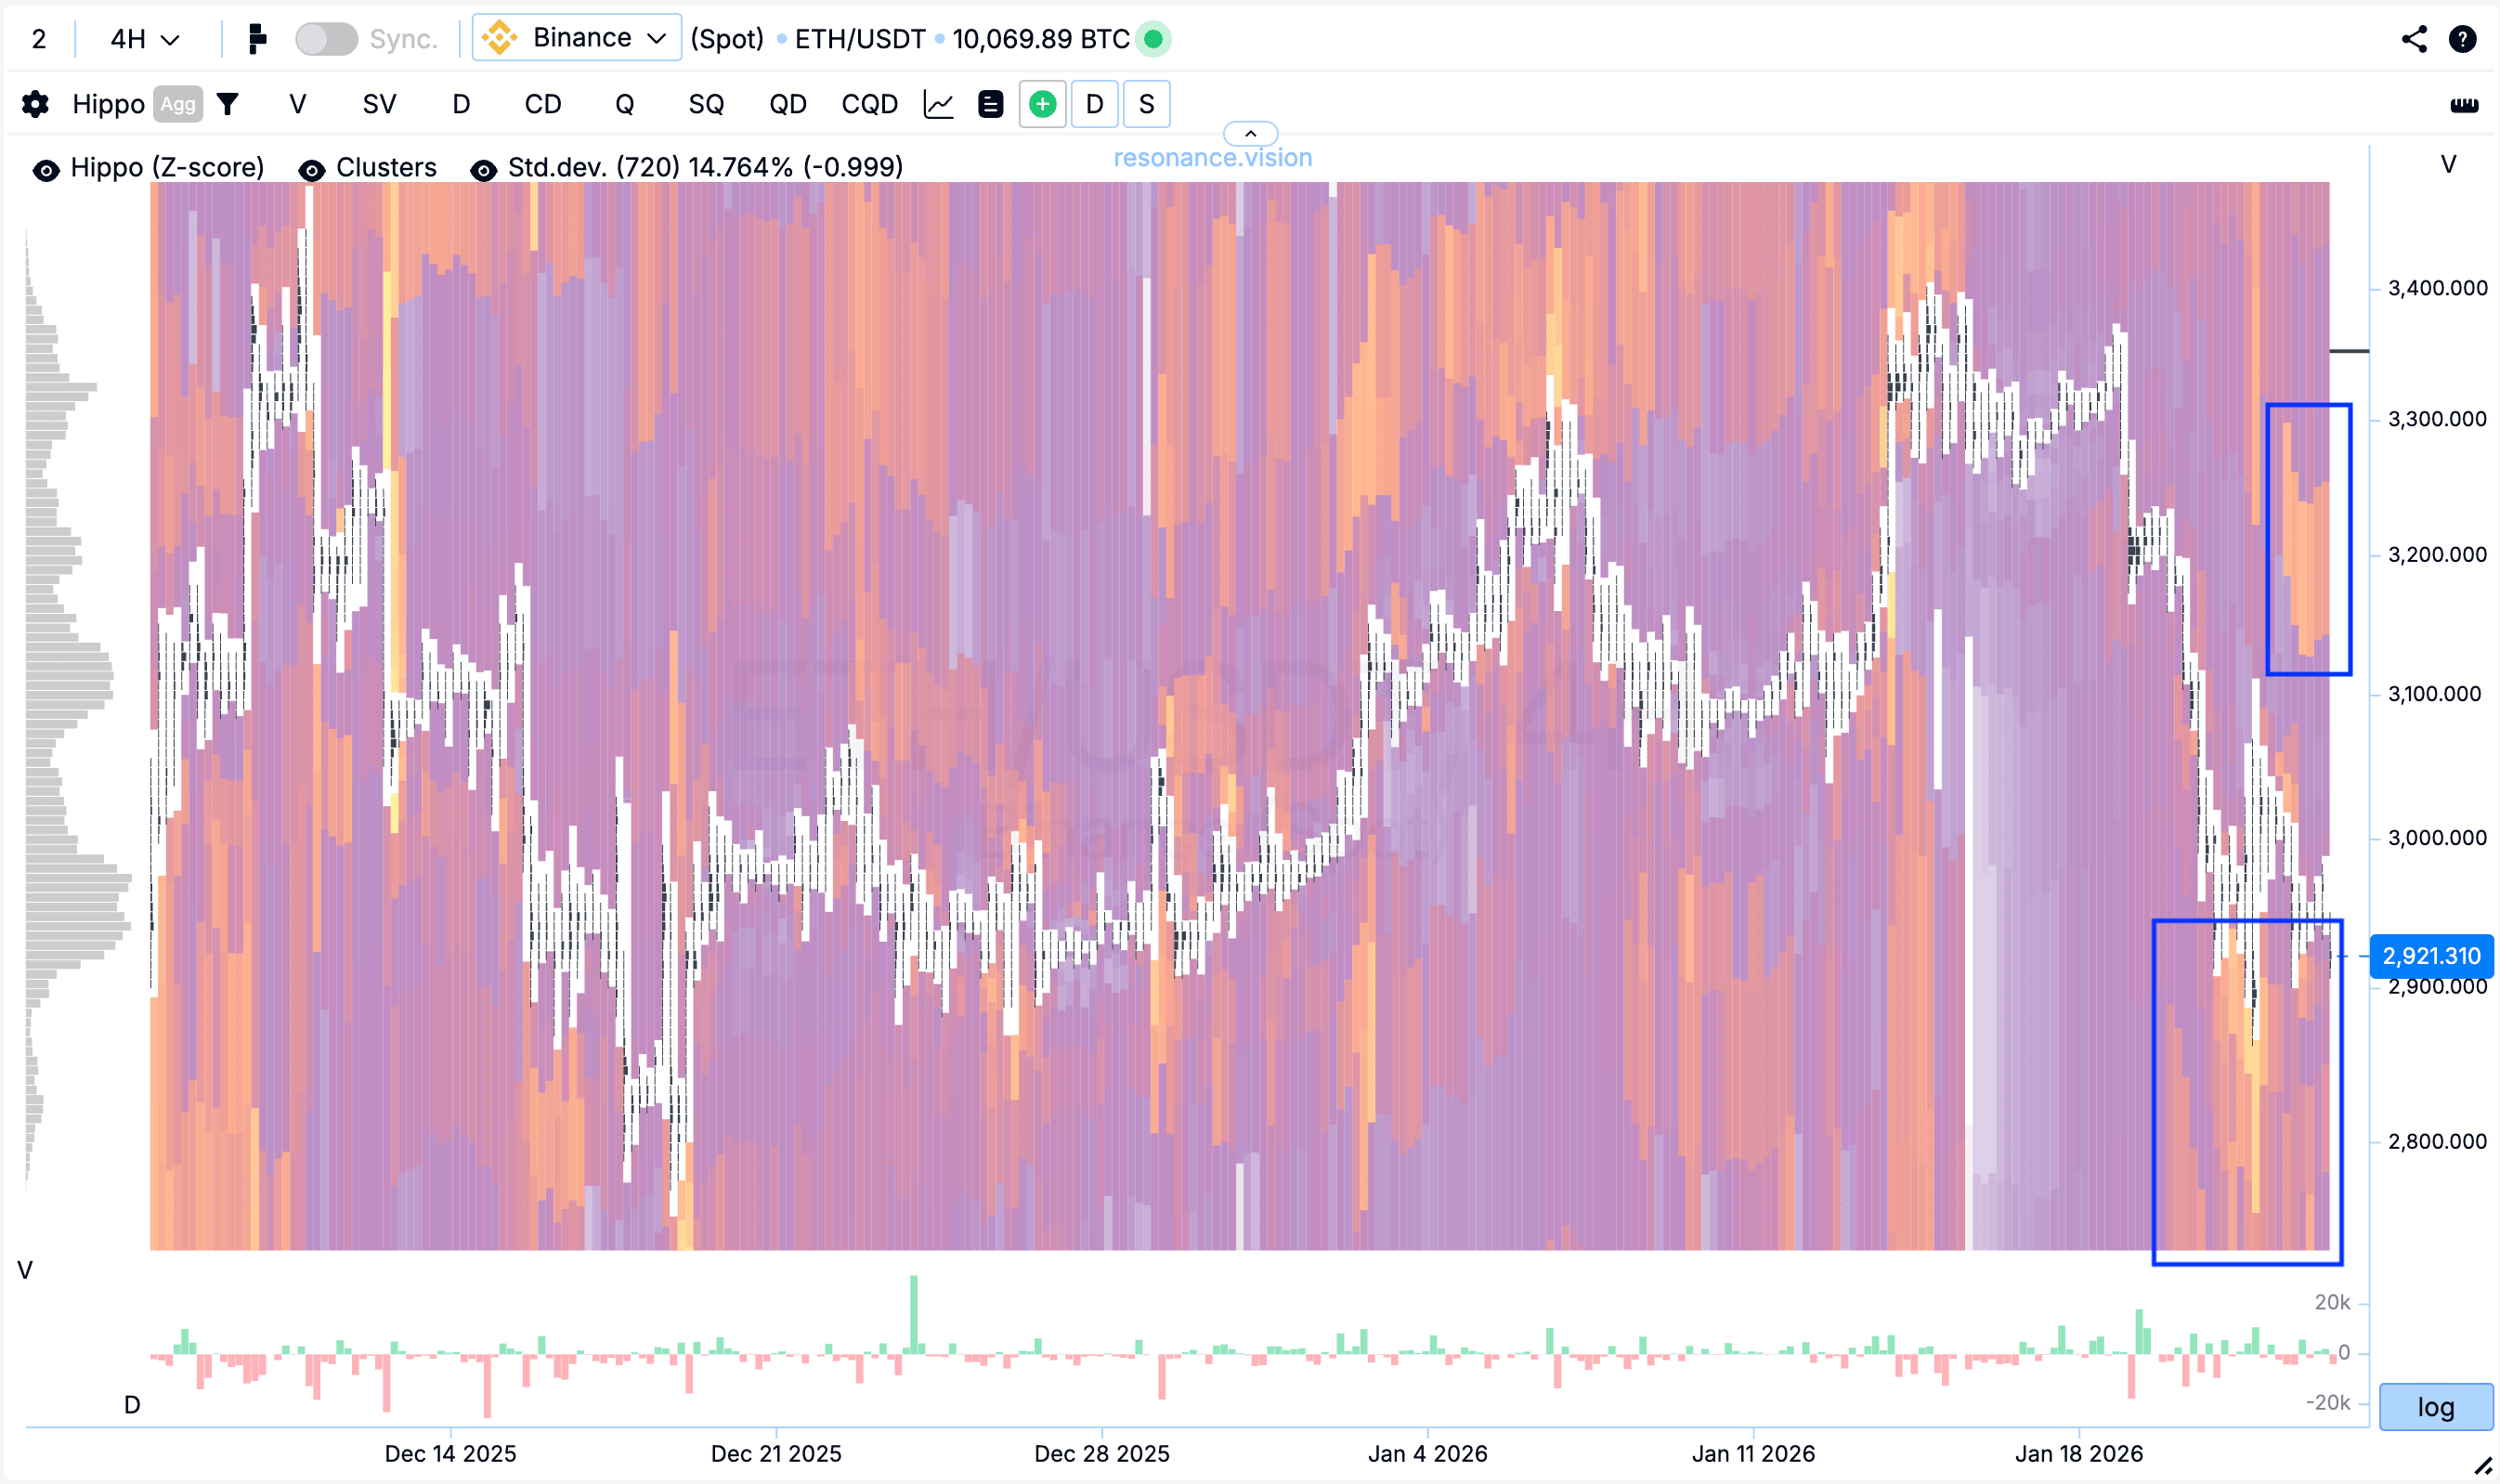
Тепловая карта в режиме Z-Score (синие прямоугольники)
На тепловой карте в режиме Z-Score фиксируются аномальные скопления лимитных заявок на покупку. Эти объёмы частично поглотили маркет-объём продаж, вследствие чего цена локально остановила снижение. Также аномальные плотности наблюдаются и выше текущей цены.
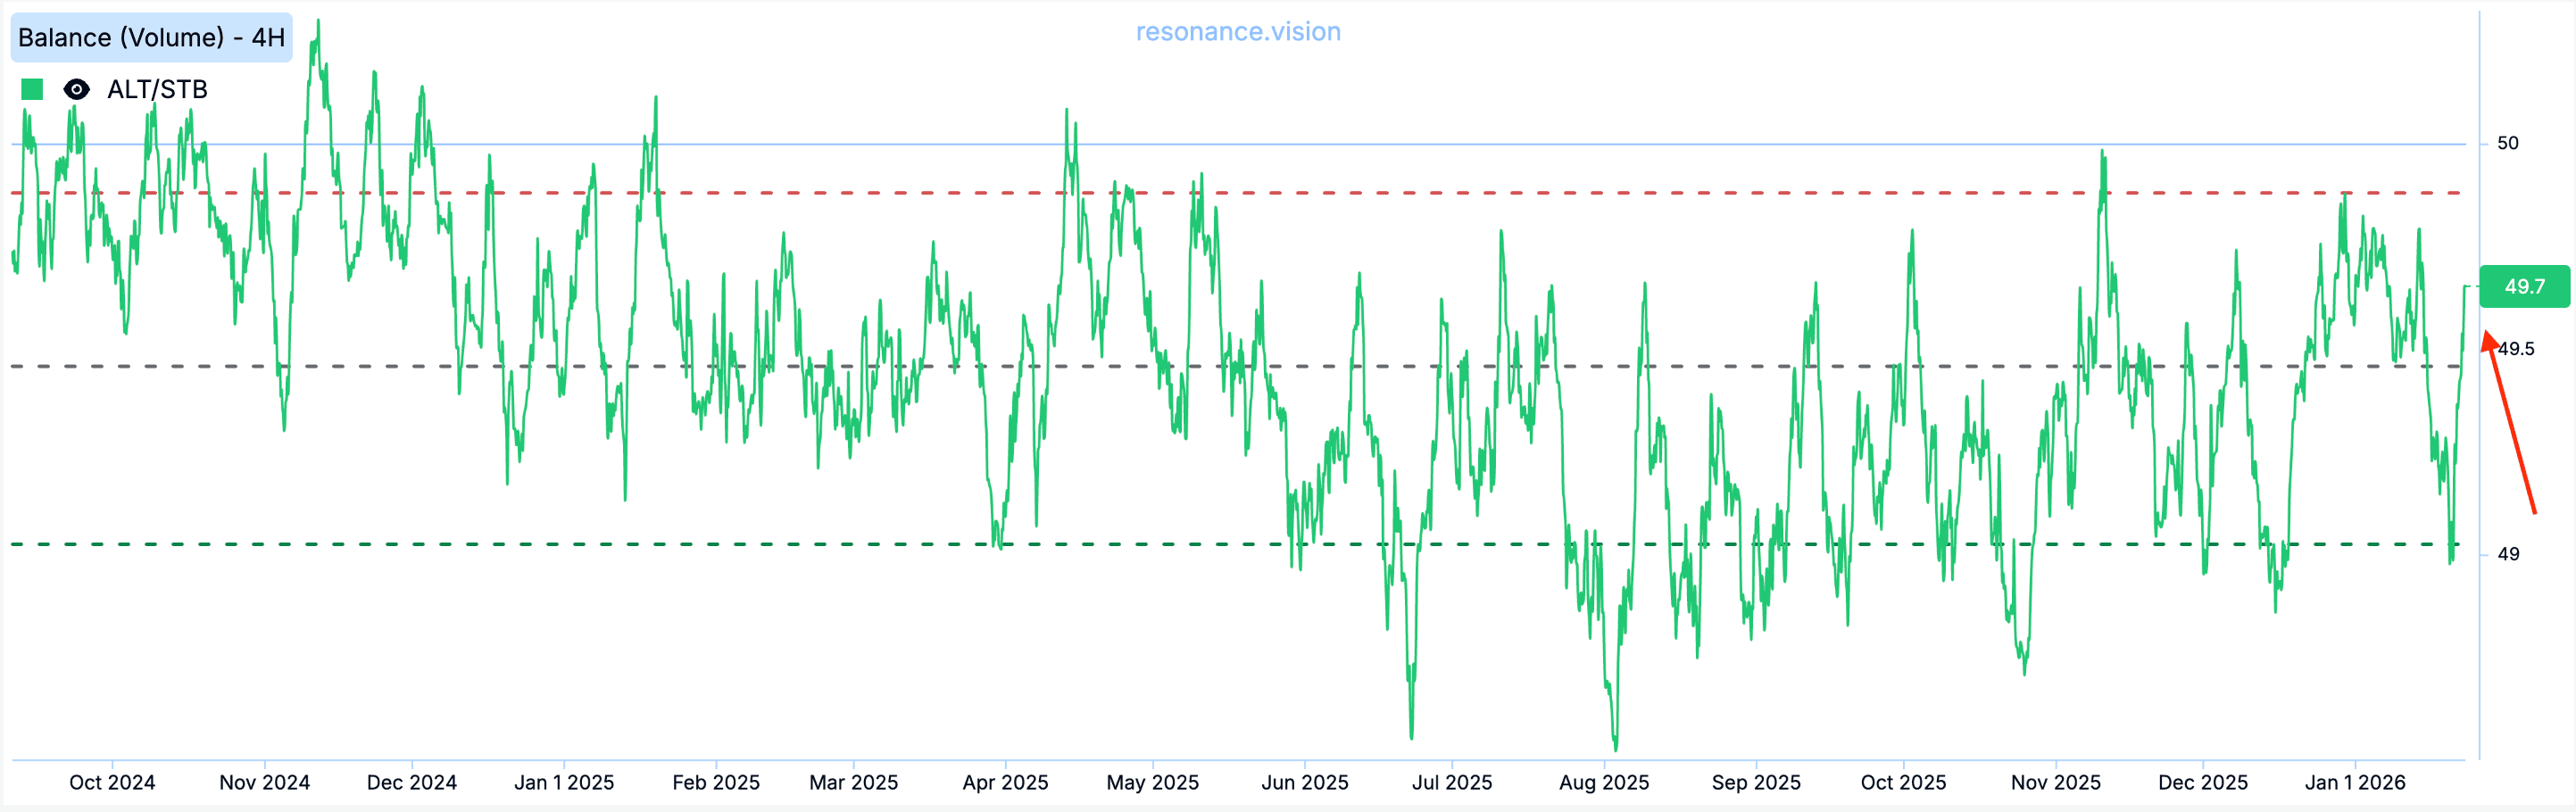
Индекс баланса
Индекс баланса в настоящий момент сместился и находится в средней зоне по перцентилю, без выраженного перекоса в сторону покупателей или продавцов.
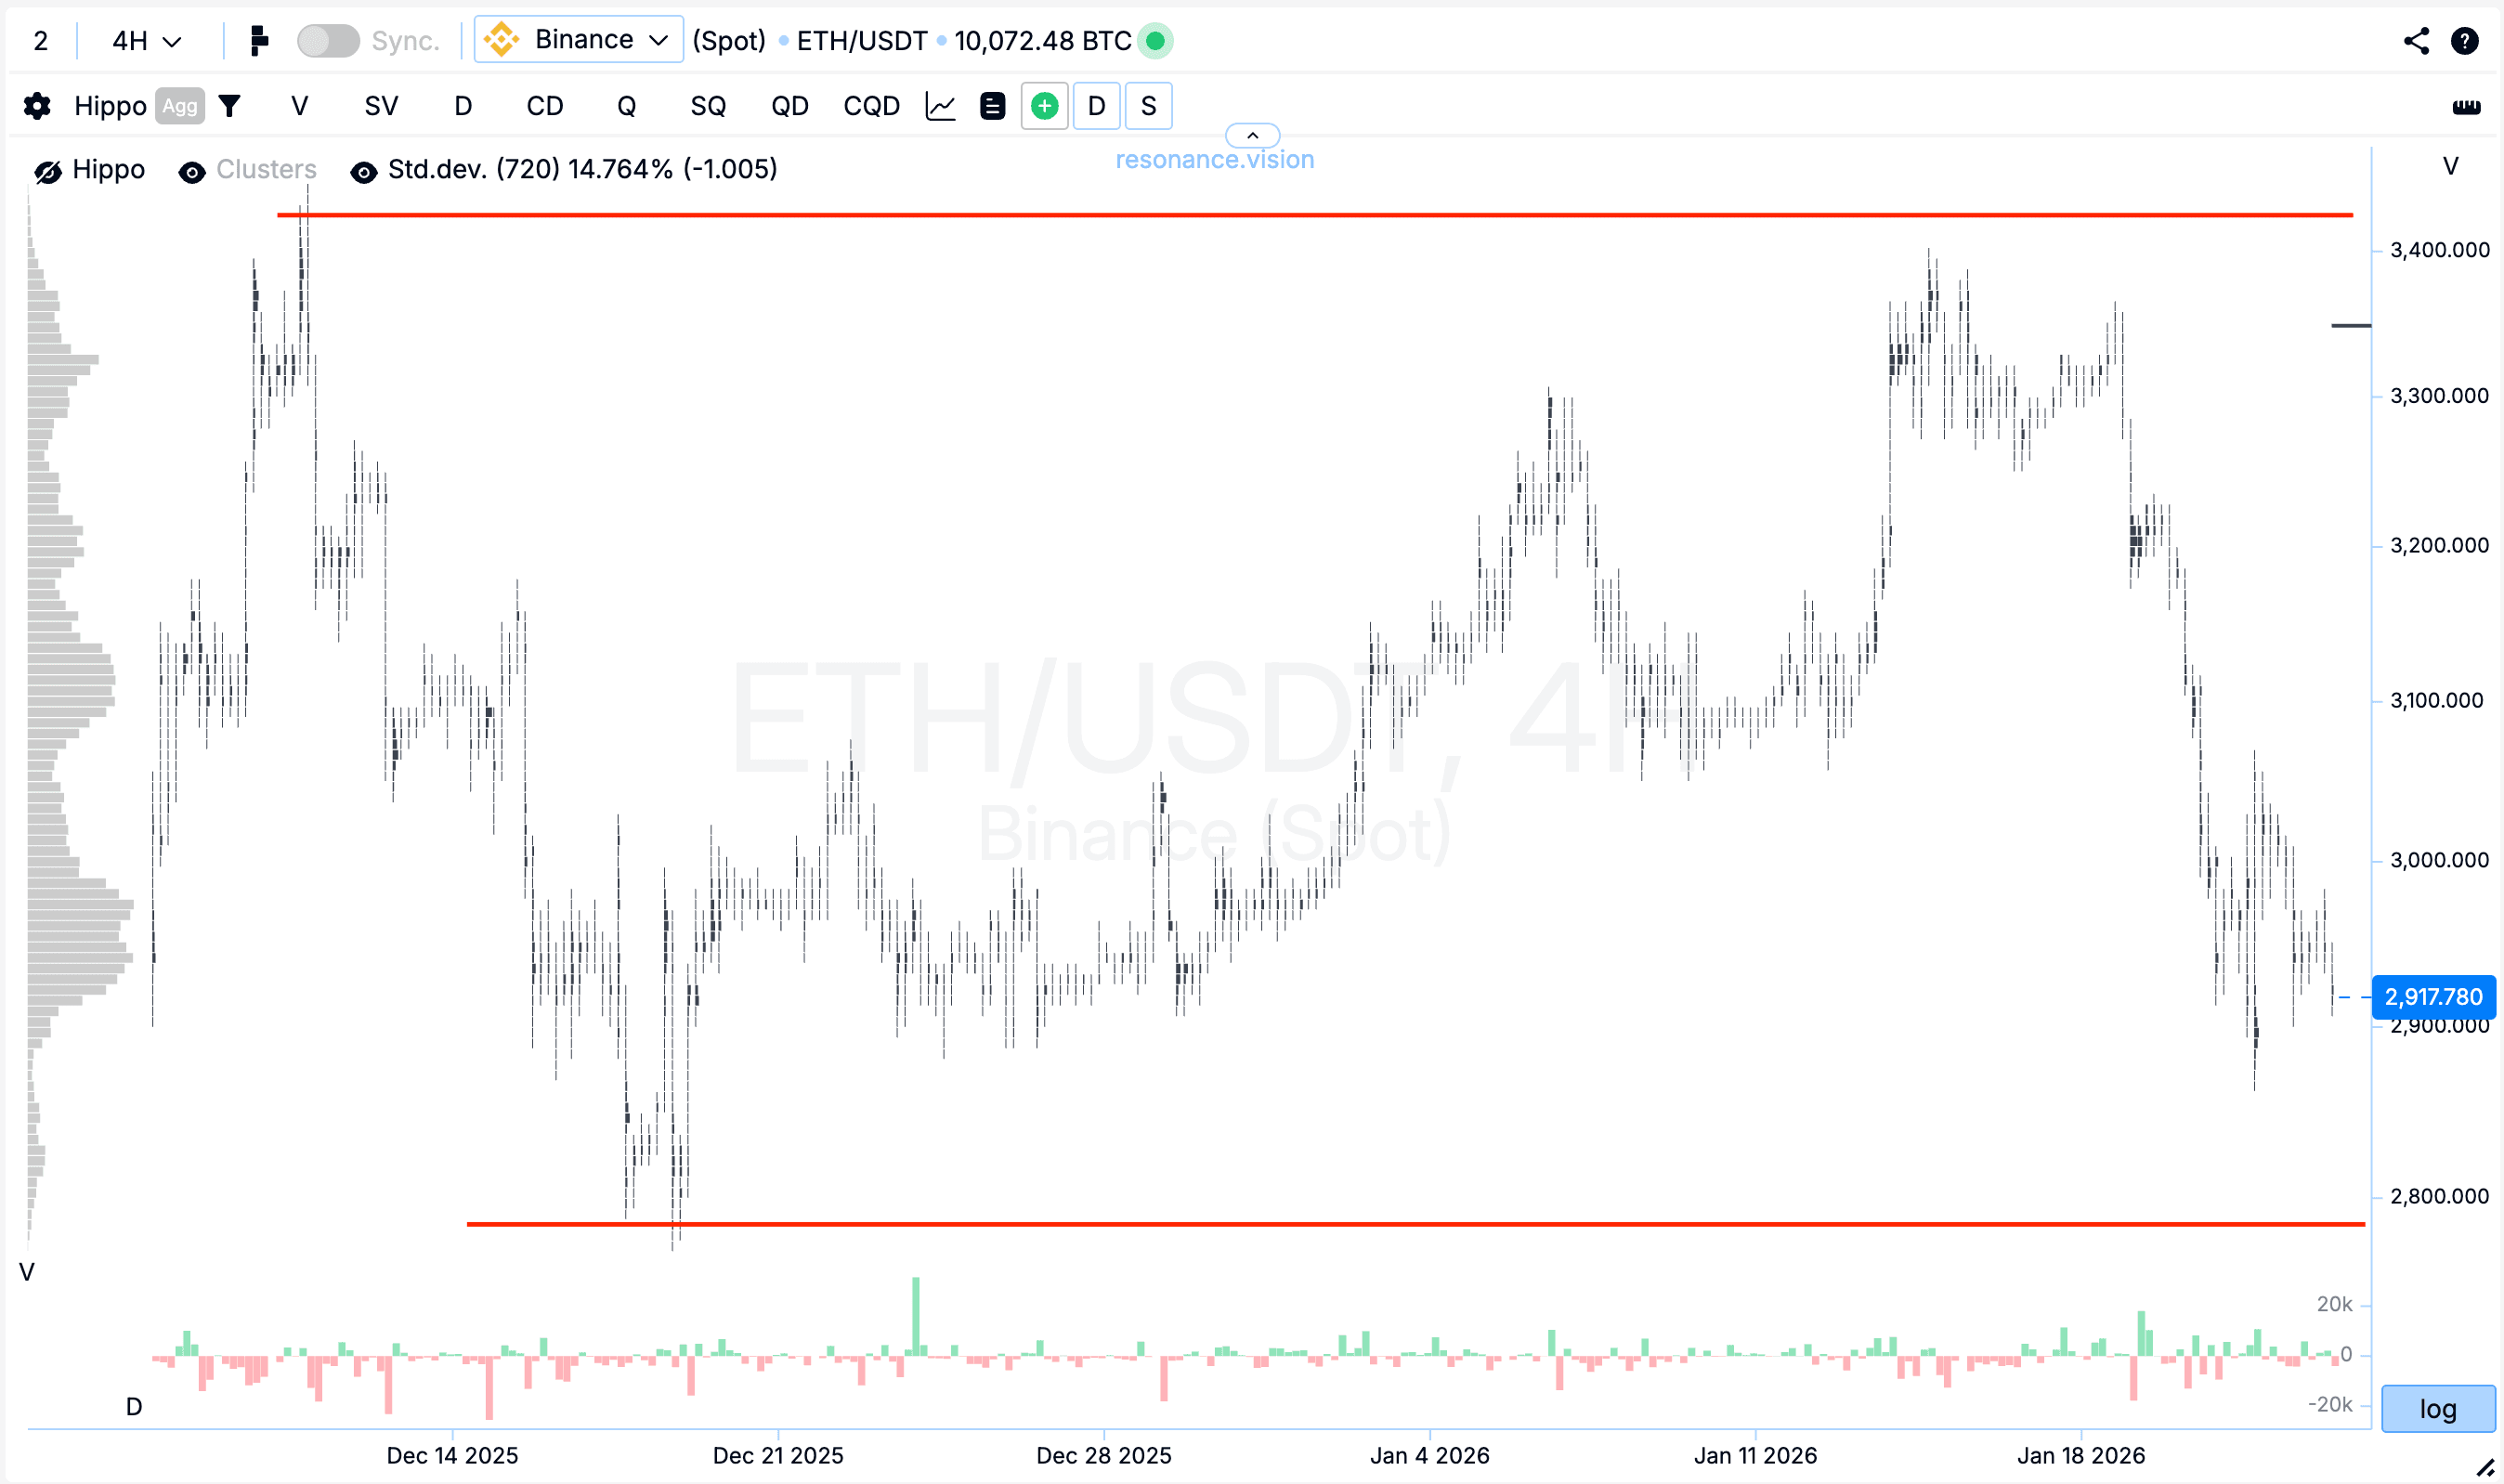
Динамика цены
На фоне преобладающих маркет-продаж произошёл заметный ценовой откат. Однако снижение было остановлено в зоне аномальных лимитных скоплений, что указывает на наличие значимого встречного объёма.
Итог:
Цена по-прежнему не выходит за границы сформированного диапазона и остаётся в боковом движении: ни локальный максимум, ни локальный минимум не обновлены. В текущий момент рынок находится в фазе проторговки вблизи локального минимума.
Каким образом ты бы реализовал торговую идею в такой ситуации?
Следи за новыми статьями в нашем телеграм канале.
Не нужно выдумывать сложных схем и искать “грааль”. Используй инструменты платформы Resonance.
Регистрируйся по ссылке — получай бонус и начинай зарабатывать:
OKX | BingX | KuCoin.
Промокод TOPBLOG дает тебе 10% скидки на любой тарифный план Resonance.
Рекомендуемые статьи


