Огляд ринку по BTC - 10.02.2026

Низхідний рух зберігається: маркет-продаж домінують, а зростання об’ємів при зниженні підтверджує активну участь ринку. Лімітний попит формує локальну підтримку.
Зміст

У даному огляді ринку ми не намагаємося прогнозувати майбутнє, наше завдання констатувати факти, які ми маємо на поточний момент. І будувати свої дії на основі поточних фактів, а не наших очікувань та надій.
Ринкові ордери та лімітні ордери
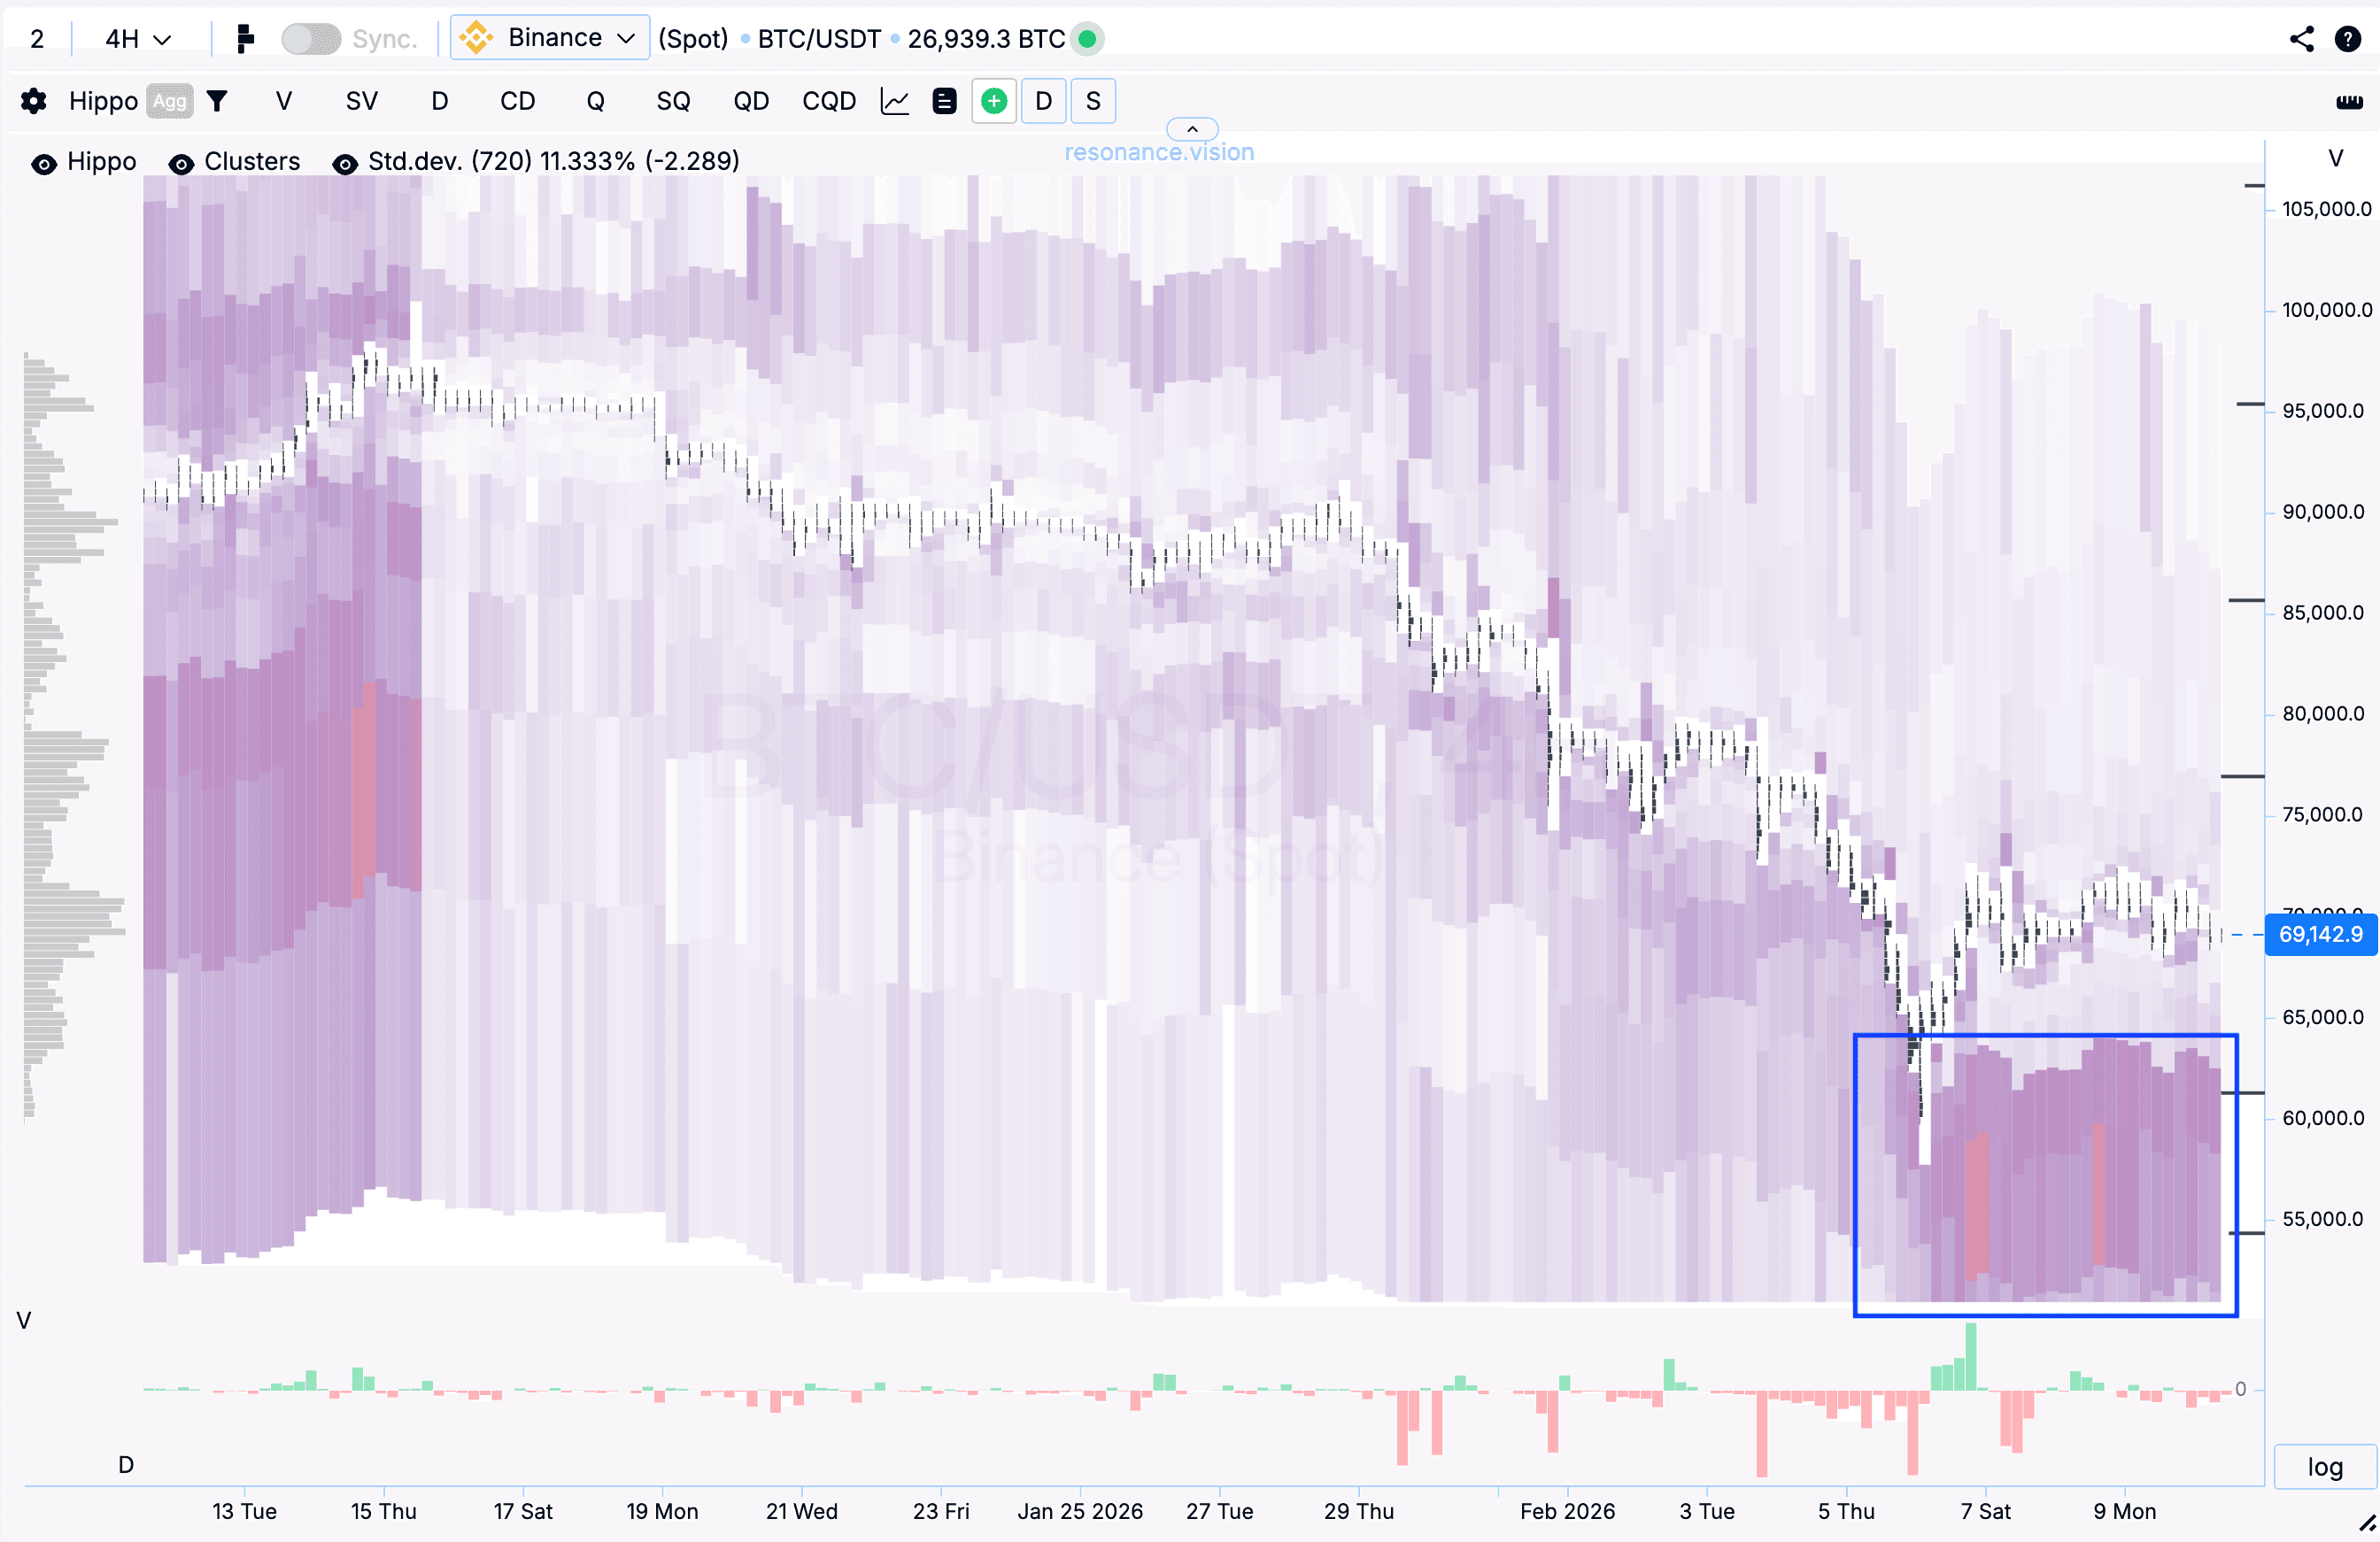
За аналізований період в агрегованому вигляді за маркет-ордерами спостерігається накопичувальне переважання угод на продаж. Це виразно видно на гістограмі кумулятивної дельти (червоний прямокутник) і свідчить про стійке тиск із боку ринкових продавців.
Одночасно з цим за лімітними заявками локально фіксується накопичувальна перевага ордерів на купівлю (зелений прямокутник). Це свідчить про формування зустрічного лімітного попиту.

Теплова карта в режимі об’єму (синій прямокутник)
На тепловій карті фіксуються аномальні скупчення лімітних заявок на покупку трохи нижче за поточну ціну. Ці об’єми частково поглинули маркет-продаж і локально стримали подальше зниження ціни.
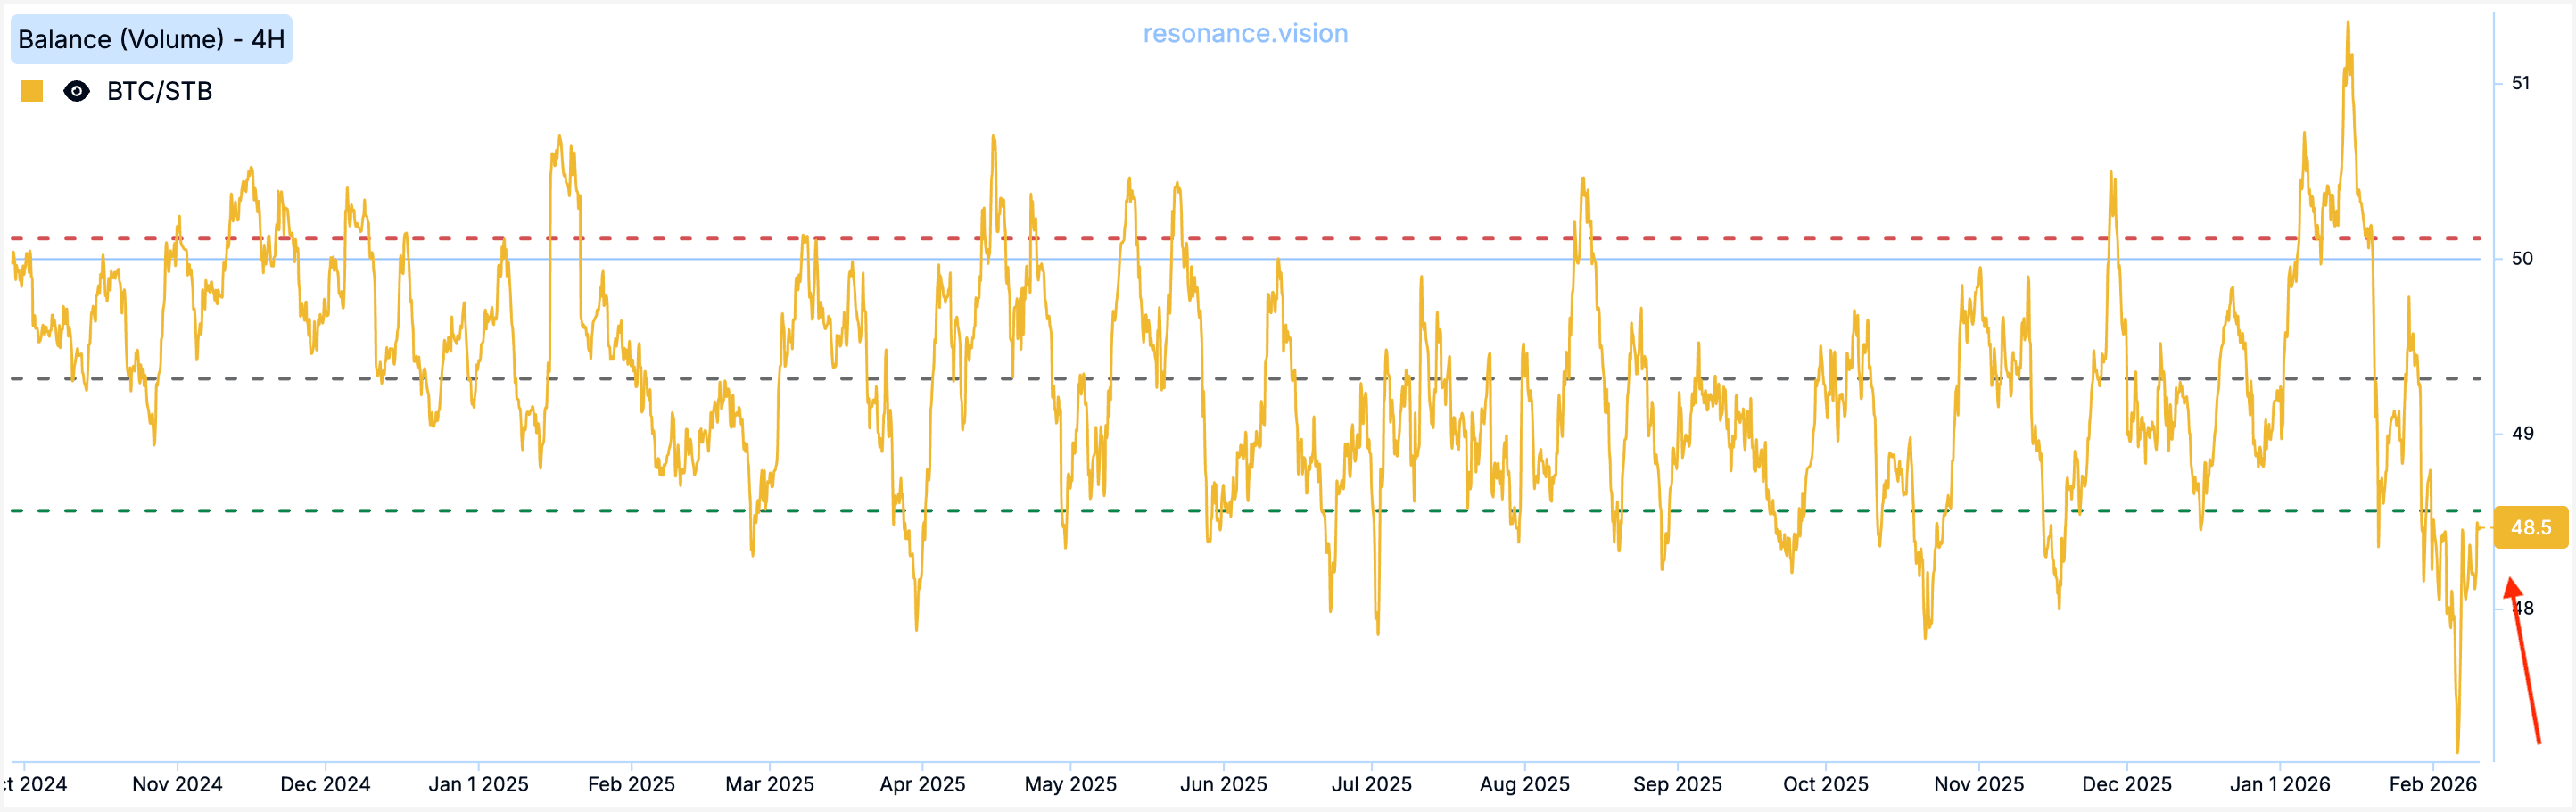
Індекс балансу
Індекс балансу зміщений вниз і знаходиться в зоні аномальних значень по перцентилю, що відображає посилення тиску з боку продажів.
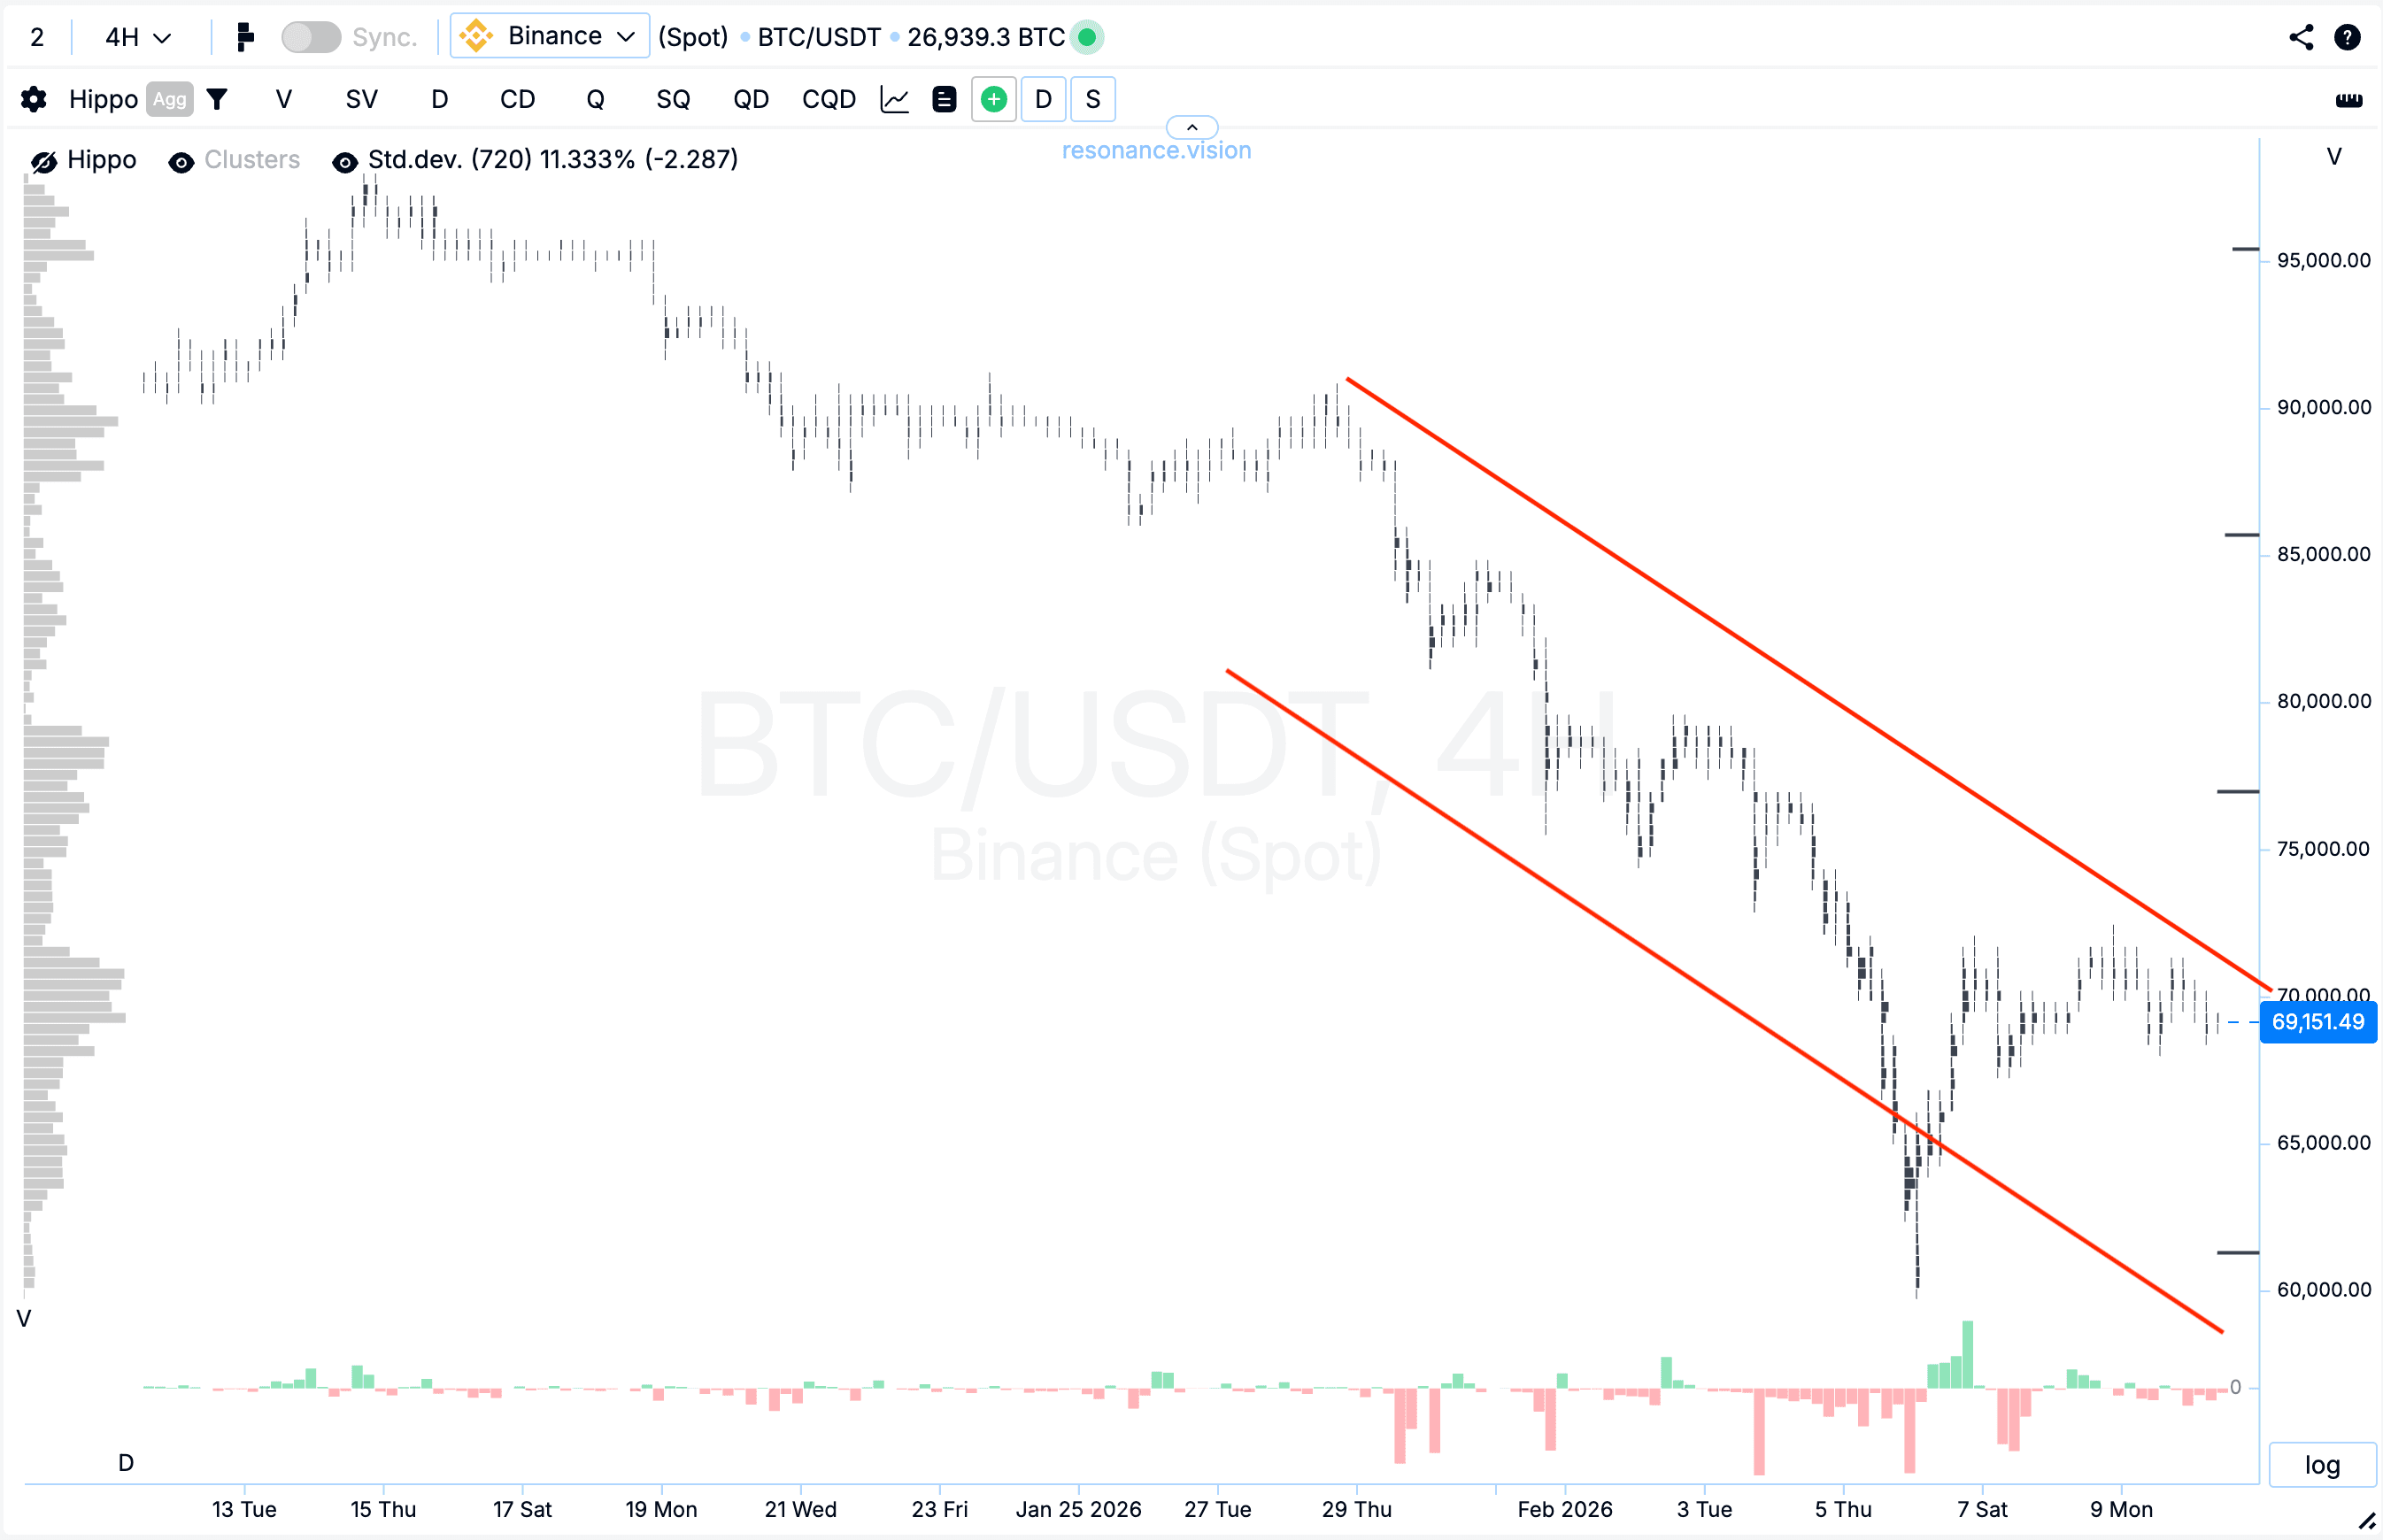
Динаміка ціни
Маркет-ордери продовжують чинити тиск на ціну. При цьому за лімітними заявками спостерігається зміщення балансу в верх, формуючи локальну підтримку з боку лімітного попиту.
Підсумок:
На даний момент, згідно з теорією Чарльза Доу, зберігається низхідна структура: мінімуми продовжують оновлюватися, тоді як максимуми залишаються без оновлення. Додатково за кластерним графіком спостерігається зростання обсягів у процесі зниження, що вказує на підвищену активність учасників ринку.
Який підхід до реалізації торгових ідей ти застосовуєш на практиці?
Стеж за новими статтями у нашому телеграм каналі.
Не треба вигадувати складних схем та шукати “грааль”. Використовуйте інструменти платформи Resonance.
Реєструйся за посиланням - отримуй бонус і починай заробляти:
OKX | BingX | KuCoin.
Промокод TOPBLOG дає тобі 10% знижки на будь-який тарифний план Resonance.
Рекомендовані статті


