Cryptocurrency Screener: How to Find Trades Instead of Guessing the Market

A cryptocurrency screener helps you systematically select trading ideas rather than guess at the market. In this article, we’ll discuss how to narrow the market by parameters, identify activity through volumes and clusters, and initiate a trade only after analyzing the context.
Table of contents
- 01Why Manual Trade Search Is Ineffective
- 02What parameters are important at the initial selection stage?
- 03Why Resonance prioritizes market mechanics over indicators
- 04Density Screener and Cluster Analysis for Different Trading Timeframes
- 05FTT as a feature within the Resonance screener
- 06Use scenarios: scalping, Grid Bot selection, and arbitrage
- 07Step-by-step logic: from filtering to trade
- 08Conclusion

Why Manual Trade Search Is Ineffective
Many beginners come to trading and begin opening trades based on intuition. But professionals know: success comes from a systematic approach. Most trading mistakes begin not at the entry point, but earlier—at the asset selection stage. While one trader randomly scrolls through dozens of coins, trying to figure out where the move is about to begin, another takes a systematic approach: first, narrowing the market to the required parameters, then opening only those instruments that truly offer liquidity, volatility, and a clear context. This is precisely what a cryptocurrency screener is for.
The digital asset market operates around the clock. Some coins may have already finished moving, others are just beginning to see momentum, and in others, the price is in a range, suitable, for example, for arbitrage or grid trading. Reviewing everything manually is inconvenient and ineffective. When a trader tries to take in the entire market, they almost always either miss a setup or open a trade too late. Therefore, the best approach is to first make a selection and then move on to analyzing a specific situation.
A good screener for crypto trading isn’t needed to “predict” the market, but to dramatically narrow the search field. It helps sort assets online by volume, activity, exchange, category, price change, and other parameters. This is especially important in fast-moving markets, where decisions need to be made based on facts rather than emotions.
What parameters are important at the initial selection stage?
Any effective selection of trading ideas begins with a simple question: which coins are worth pulling up on your screen? Even the free basic functionality already helps eliminate noise and focus on those instruments with activity and liquidity. Resonance uses the following for this:
- Filtering options: select index group, category, and specific exchange.
- Sorting: by volume, price increase/decrease in %, or absolute values.
- Visualization: customize the chart grid, drill down into clusters, and select a timeframe.
- Session lists: grouping tickers for focused monitoring.
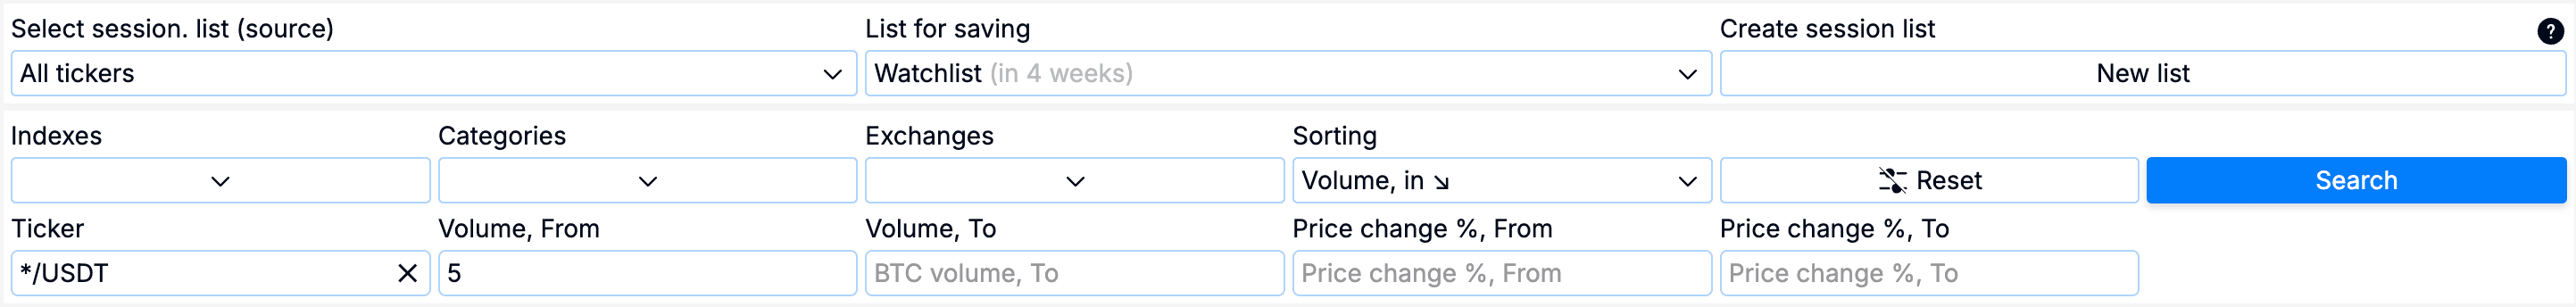
Even in the free version, this first layer of filtering already helps reduce noise and highlight active instruments faster.
In practice, a trader typically looks at several factors at once: volume, current activity, price change, overall volatility, and movement structure. The same chart may look visually appealing but be unsuitable for trading due to weak liquidity. Conversely, a seemingly calm asset may offer a promising scenario if it has a clear setup and the right market context. Therefore, systematic selection, rather than manual selection, yields the best results. This matters most when the market is moving fast and decisions have to be made in real-time.This makes it easier to focus on top setups instead of wasting time on random coins.
It’s especially important that this format makes it convenient to monitor the market online for several instruments in real-time. This speeds up work and reduces the likelihood that a trader will make a decision simply because they “like” one random coin.
Why Resonance prioritizes market mechanics over indicators
Many are accustomed to building their analysis around indicators. RSI is most often used in this role because it’s well-known and seems universal. However, in Resonance’s approach, indicators are not the primary source of information. The RSI can be useful as a trigger (to analyze a coin through volume data), just like other popular technical analysis tools, but not as a basis for entry.
The reason is simple: technical indicators recalculate past price movements, whereas the market is driven by the actual actions of market participants. Therefore, Resonance prioritizes data that is closer to market mechanics: volume, delta, number of trades, and price reaction to activity near large limit orders. When a trader sees not only the candlestick chart but also what’s happening within the movement, their trading becomes more informed.
This approach is especially useful where speed of decision-making is crucial. Instead of trying to guess market movement based on the indicator, a trader first looks at whether there is real activity in the asset, whether pressure is increasing around the level, and how the price behaves near it.
Density Screener and Cluster Analysis for Different Trading Timeframes
When we talk about profitable trading, the main issue comes down to the efficiency of selecting the best trading ideas.
Density screeners and cluster analysis are useful not only for scalping. Their purpose is broader: to help traders or investors quickly identify market segments with significant participant activity, price response to liquidity, and volume anomalies.
The only difference is the timeframe used for selection and the position holding horizon considered.
A crypto screener for scalping helps identify fast, localized scenarios, such as short-term imbalances. Speed is important here, so traders often look at lower timeframes and look for assets with high current activity.
For day trading, the logic is the same, but the focus shifts from micromovements to intraday structure. A screener helps select coins where directional pressure emerges during the day, market pressure is maintained, accumulations are formed, or losses are formed.
Notable volume zones (levels) from which a continuation or reversal scenario may develop.
In medium-term trading, density screeners and cluster analysis are no longer used to search for local momentum, but to select coins with larger zones of interest. On higher timeframes, such tools help identify where significant volume has occurred, where the price has encountered a strong reaction from participants, and which zones (levels) may remain important for several days or weeks.
Even in an investment approach, such analysis remains valuable. An investor can use a screener not just to find an entry point “here and now,” but to select assets worthy of attention: where sustained interest is emerging, where the price is holding important zones, and where accumulation is forming on increased volumes. In this case, screening serves as a way to narrow the market and select assets for deeper analysis.
That’s why at Resonance, such tools are not tied exclusively to scalping. The same principle can be applied to different position holding horizons: from short-term intraday trades to medium-term scenarios and investment selection. Only the scale of analysis changes, not the logic itself—first selection, then context, then decision.
FTT as a feature within the Resonance screener
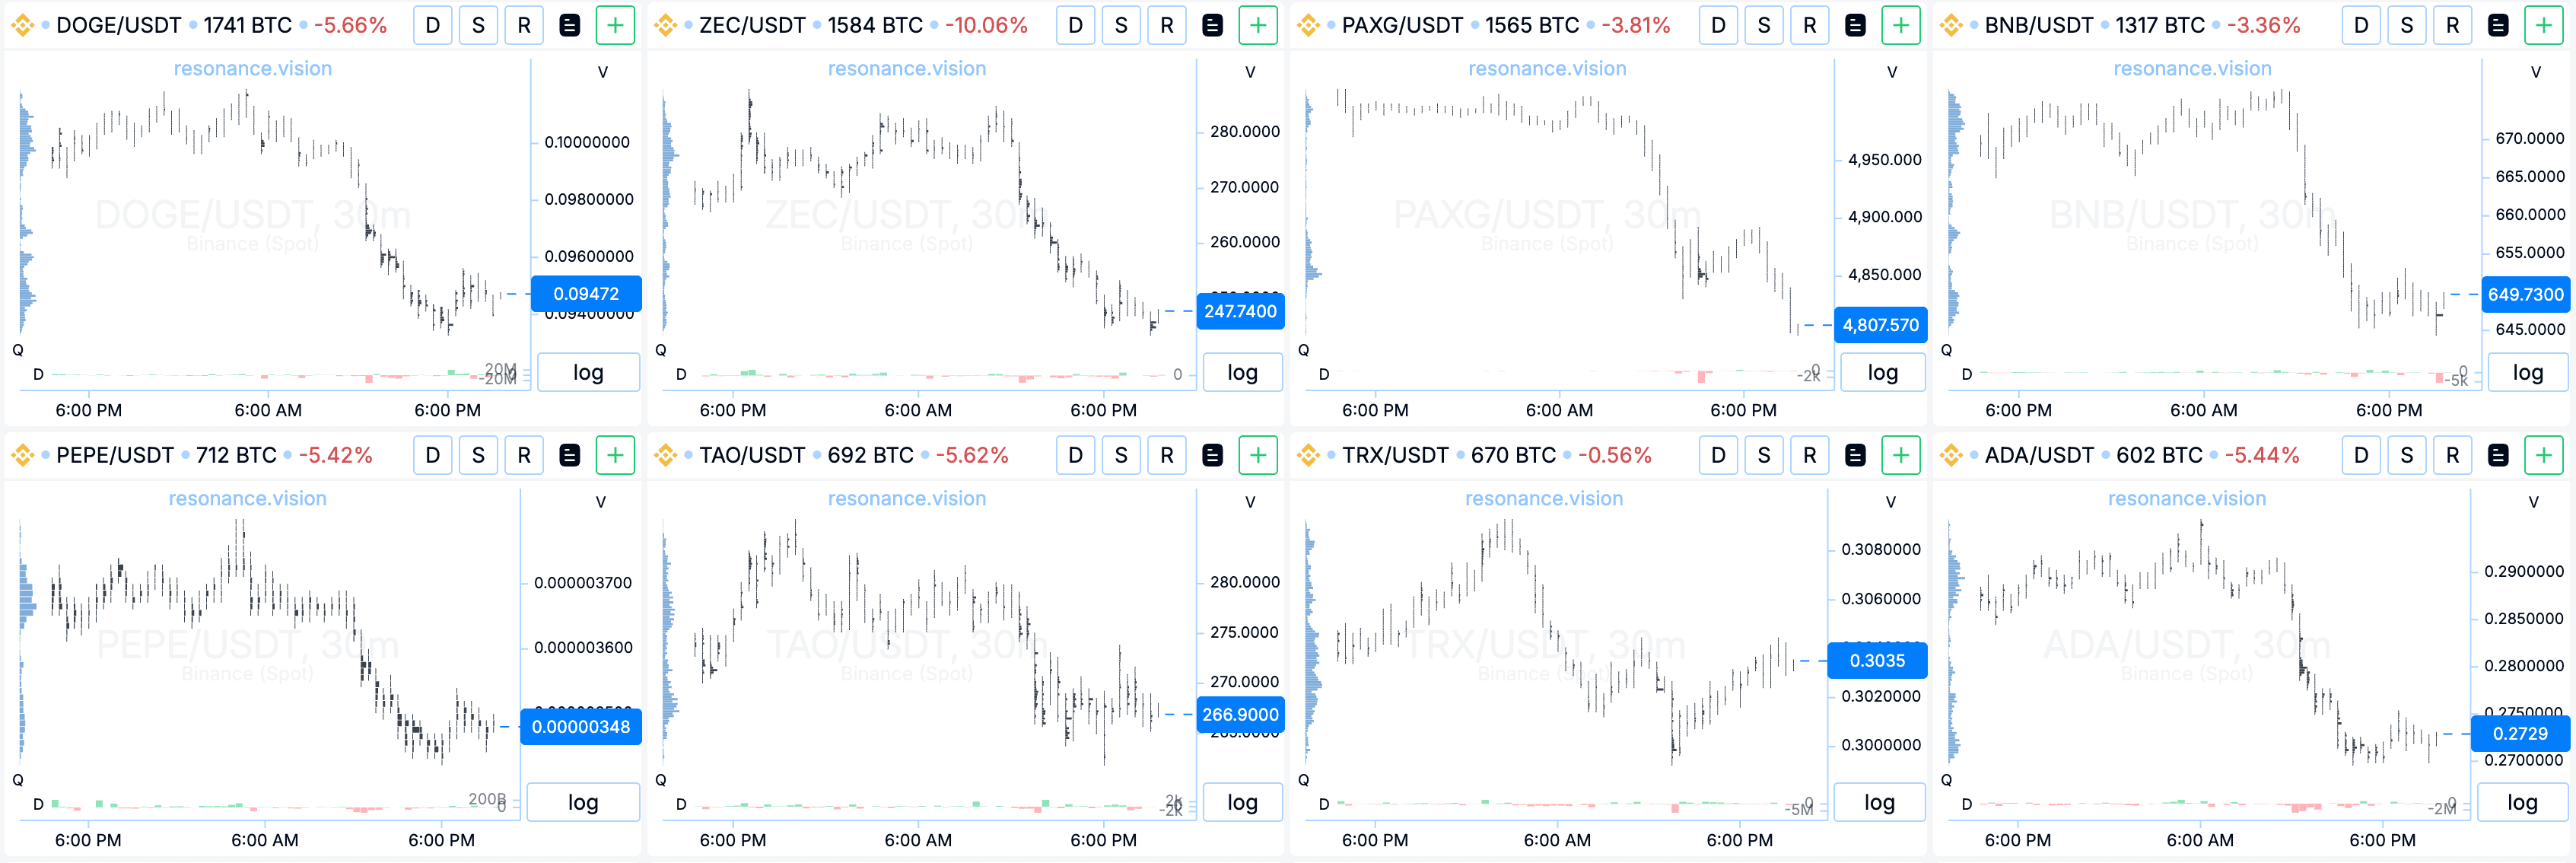
A modern crypto screener is more than just a table of charts. One of the strengths of the Resonance platform screener is the built-in FTT search engine. Its purpose is to speed up the search for cluster accumulations at price peaks and help you quickly navigate to those coins that are truly worth examining in more detail.
If the algorithm detects abnormal cluster compaction, markers appear on the chart.
- The red line is the accumulation found at a local maximum.
- The green line is the accumulation found at a local minimum.
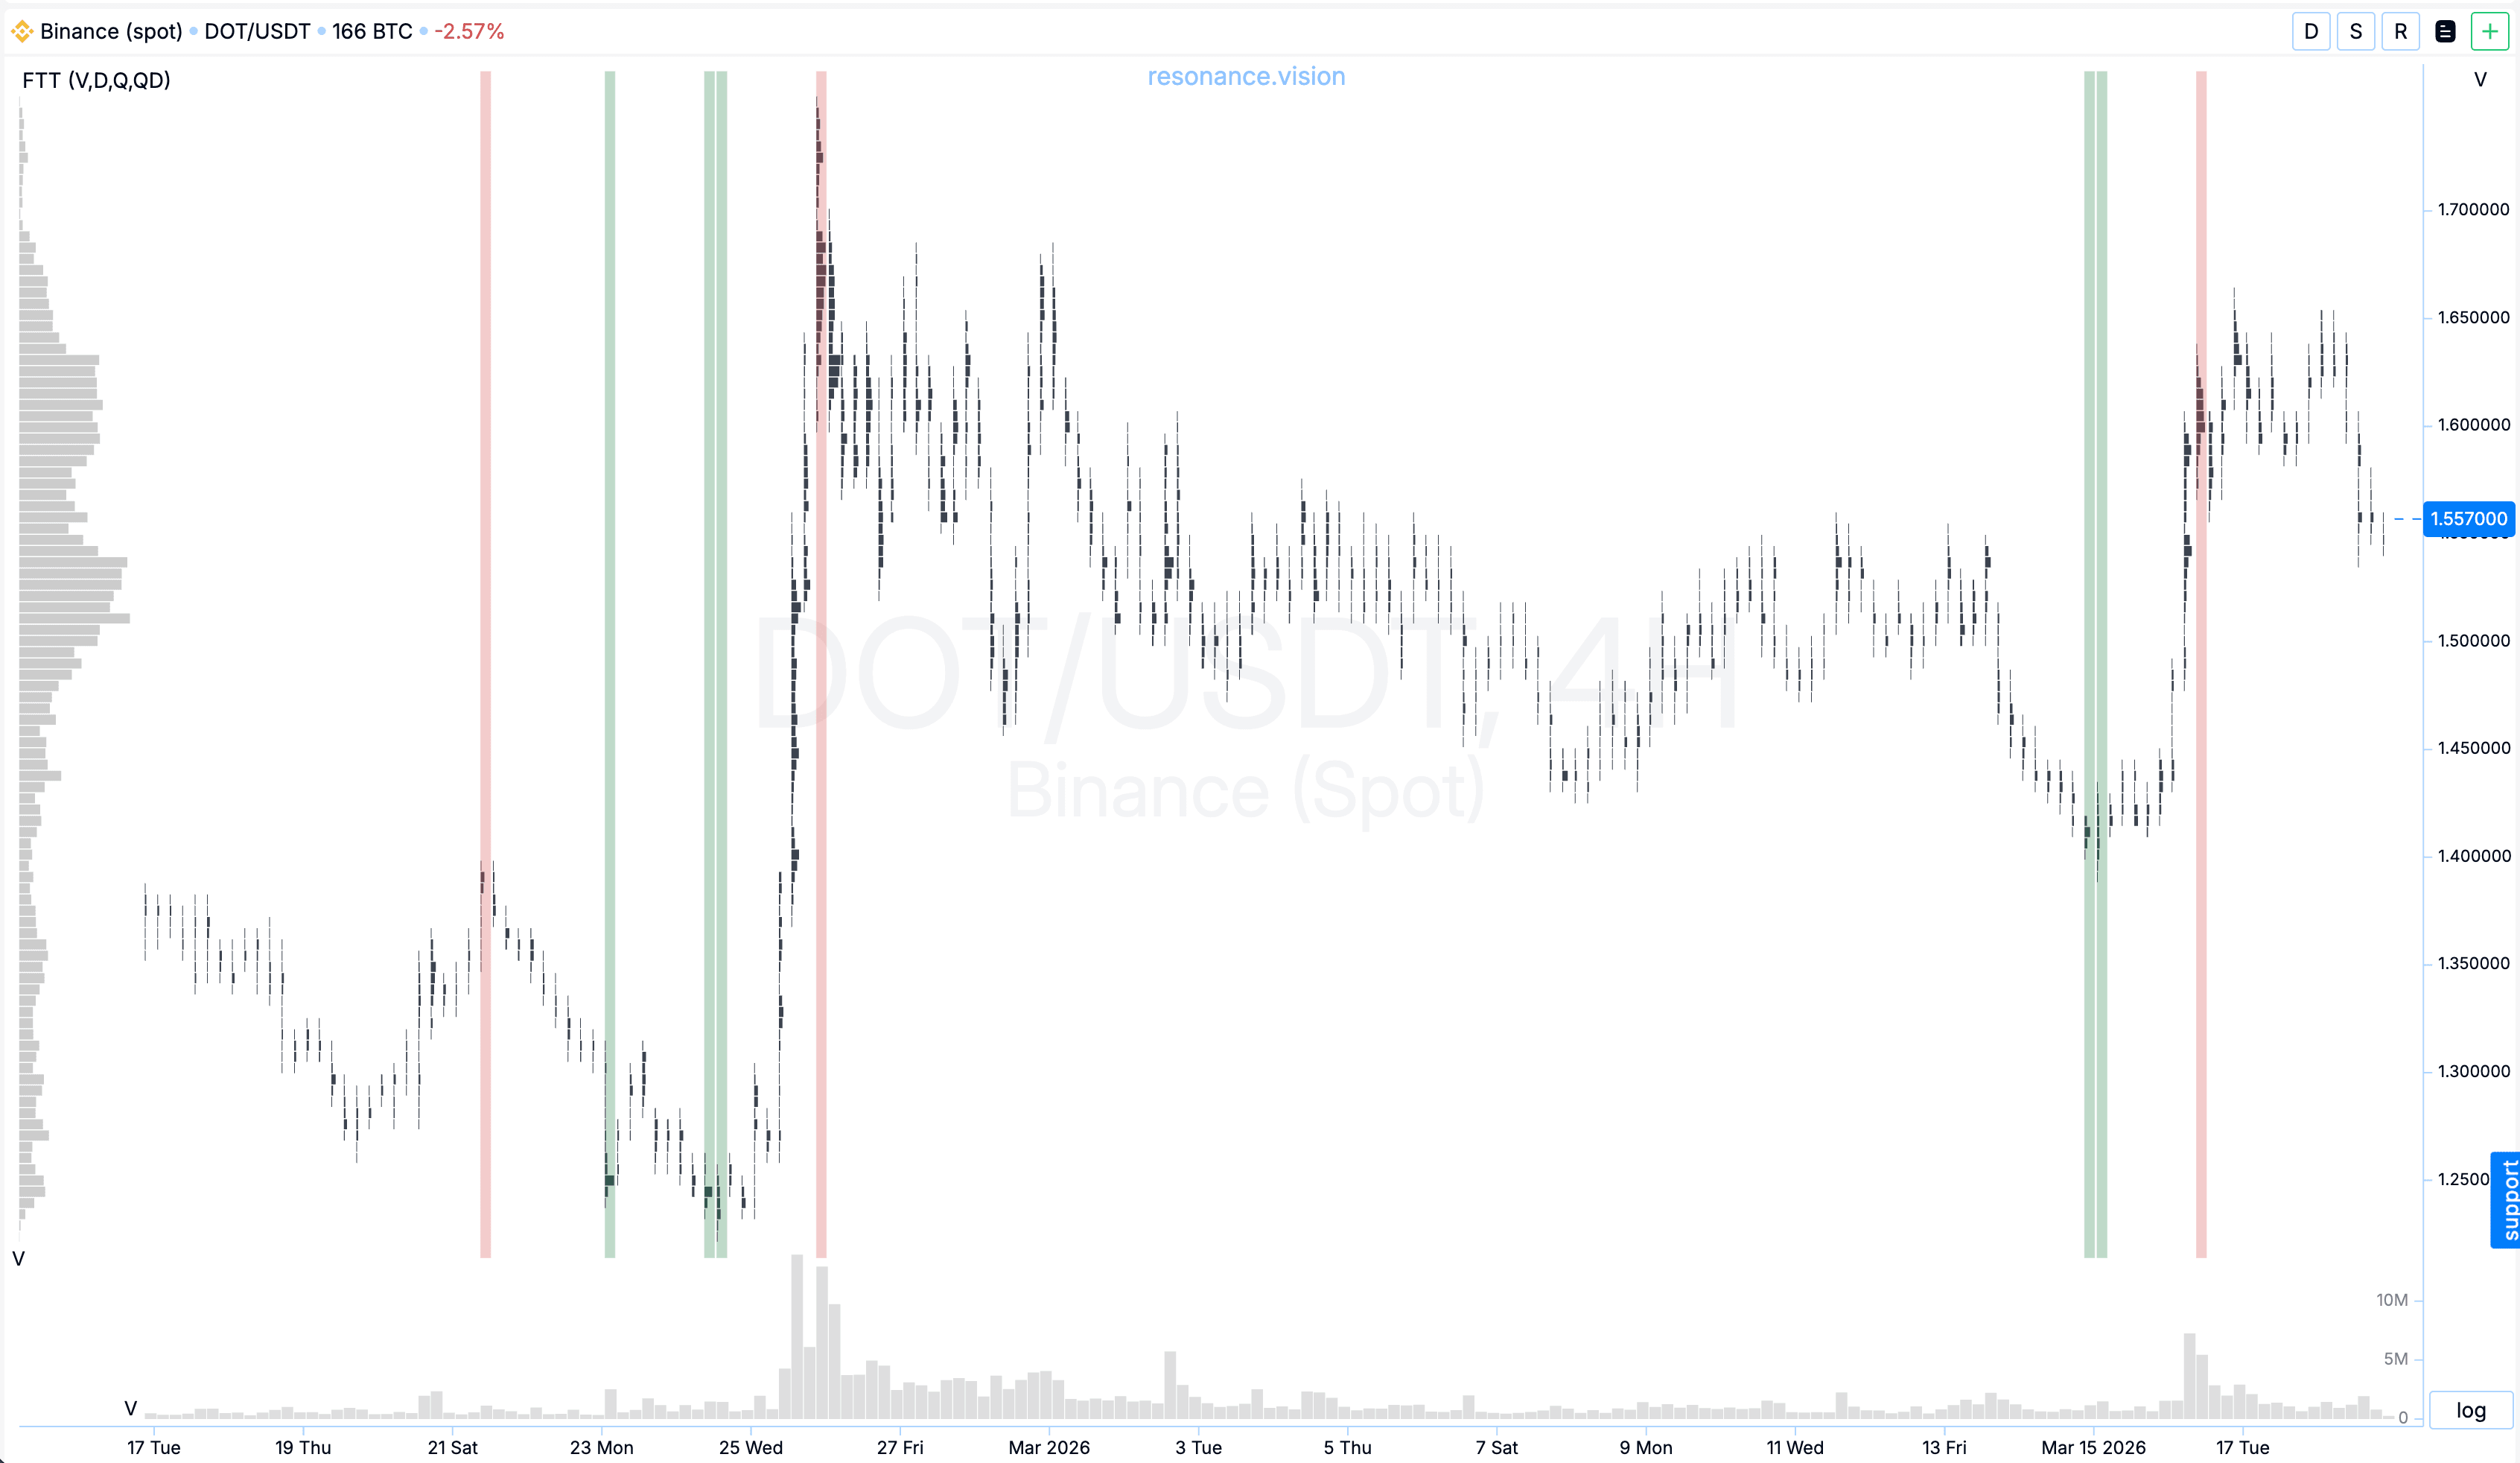
In the legend of each chart, you will see the word “FTT,” and in parentheses, the specific data types (for example, Delta or Volume) on which the cluster was found. This allows for a high-quality selection of situations without wasting time on idle market noise. This is important because the trader receives a high-quality preliminary screening, rather than a ready-made “enter” button.
This crypto screener is especially useful when you need to quickly scan the market online and understand which coins are worth paying attention to. Instead of randomly browsing dozens of pairs, the trader gets pairs that have already shown anomalous activity and where a more detailed context can be assessed.
Use scenarios: scalping, Grid Bot selection, and arbitrage
The screener is useful not only for scalping or searching for individual trades. It can be used for other tasks, depending on your trading style and the logic of your strategy:
- Statistical arbitrage: pair trading deserves a special mention. The “Categories” sorting field allows you to group coins by sectors and search for instruments within the same market segment. This is especially useful when a trader wants to analyze not just the absolute movement of a single coin, but the relative performance of assets within the same category. For example, if a sector as a whole is showing strength, but one coin stands out noticeably relative to similar assets, this could form the basis for a pair-trading idea.
- Grid Bot: For grid trading, a screener helps select coins with sufficient liquidity, sufficient volatility, and a clear range. In such scenarios, the market state (phase) is more important than the movement itself. The screener helps find coins that are ideal for grid trading.
- Arbitrage: A cryptocurrency screener helps quickly identify discrepancies between exchanges and spot price inefficiencies. However, a detected spread alone does not necessarily mean a ready-made arbitrage trade: it is important to consider fees, liquidity, execution speed, and slippage risk.
As you can see, a density screener and cluster analysis also remain useful in these scenarios because they provide an additional layer of understanding: where significant liquidity appears in the selected assets, how the price reacts to volume, and which zones are truly worth paying attention to.
Therefore, the Resonance screener is a tool not for a single trading style, but for a variety of tasks: from short-term trades to medium-term selection, pair trading, and more relaxed investment scenarios.
Step-by-step logic: from filtering to trade
To turn data into profit, use a clear algorithm:
- Primary filter: Adjust volume (from 100 BTC) and volatility parameters to find “live” coins.
- Deep filtering: Use the density screener to see supply and demand imbalances.
- Context assessment: Open cluster charts and evaluate the overall structure of the market movement.
- Build a scenario: where to enter, where to cancel an idea, where is risk acceptable, and to what extent does the movement justify this risk.
This is how professional trading is built: not through guesswork, but through consistent selection and hypothesis testing.
Conclusion
The screener for crypto trading does not replace analysis and does not make decisions for the trader. But by using a quality crypto screener, you save hours of time. Your trading becomes more disciplined: you first conduct a professional selection, analyze cluster charts online, context, and liquidity, and only then proceed to the trade. This makes market operations much more systematic. It is better to avoid using technical indicators, replacing them with supply and demand analysis.
The best crypto screener not only helps you find quick trades but also select assets for different market timeframes—from intraday trading to more relaxed medium-term and investment scenarios.
Remember that even the best tool is only a guide. But with Resonance tools, decision-making will be much easier. The goal is not to watch every asset, but to quickly narrow the list down to the top opportunities for your trading style. Try the Resonance crypto screener and improve your efficiency today.
Follow new insights in our telegram channel.
No need to invent complex schemes and look for the "grail". Use the Resonance platform tools.
Register via the link — get a bonus and start earning:
OKX | BingX | KuCoin.
Promo code TOPBLOG gives you a 10% discount on any Resonance tariff plan.
Recommended articles


