Directional Long-Term Strategy: From a Flow Anomaly to a Portfolio Position
How to turn “I kind of have a strategy” into a repeatable route: Screener →
Selection → Management. Six stages of a trade, the funnel in an hour a day.
Table of contents
- 01Directional Long-Term Strategy: From a Flow Anomaly to a Portfolio Position
- 02Why a “Strategy in Your Head” Is the Problem
- 03The Strategy Idea in 60 Seconds
- 04Step 1. Screener — Collect Raw Ideas
- 05Step 2. Selection — Second Pass and Plan
- 06Step 3. Management — Portfolio Support
- 07Strategy Highlight: Rotation Into the Sector Leader
- 08Summary

Directional Long-Term Strategy: From a Flow Anomaly to a Portfolio Position
We asked traders whether they have a strategy. Only 18% said it is documented.
Another 14% “keep it in their head.” The remaining ~68% answered “well,
kind of,” “not sure,” “probably not,” and even “what points should a strategy
include in the first place?”
Second question: where does the time go? 88% spend most of it on finding
ideas, analysis, and validation — the top of the funnel, before the first
trade. And time is scarce: 55% dedicate about an hour a day to the market.
That paints the pain clearly: there is no system, it does not repeat, and almost
all available time is consumed by the most expensive stage — finding and
confirming an idea. This article is about turning “I kind of have a strategy”
into a route you can name step by step and follow in an hour a day.
Why a “Strategy in Your Head” Is the Problem
A strategy you cannot name step by step falls apart on the first emotion. You
cannot test it, repeat it, or — most importantly — improve it, because there is
nothing to improve except feelings. A real strategy is named stages and a
sequence of actions, where each step has a specific question and a clear
“exit.”
These are the stages in the lifecycle of a single trade:
| Stage | Stage question | Where on the platform |
|---|---|---|
| Trigger | What did we notice? | Screener |
| Analysis | Deficit or surplus now? | Screener |
| Validation | Is confirmation in place? | Selection |
| Execution | How do we open the position? | Selection |
| Management | Is the idea still alive? What to do? | Management |
| Exit | Is the idea exhausted? Time to close? | Management |
Below — each stage in order. The platform is built exactly for this sequence:
three tabs Screener → Selection → Management. The active tab is stored in
the page URL, so you can always return to the same place.
The Strategy Idea in 60 Seconds
Price moves where a supply and demand imbalance appears.
- Deficit (demand exceeds supply) → upward pressure → we look for a long.
- Surplus (supply exceeds demand) → downward pressure → we look for a short.
“Long-term” means we care about sustained flow skews — volume, delta,
balance — not a single impulse candle. And the key difference in the approach:
we work not with one coin, but with categories and lists of ideas. That
reveals the picture across the whole market, and ideas assemble into a
portfolio, not a set of random trades.
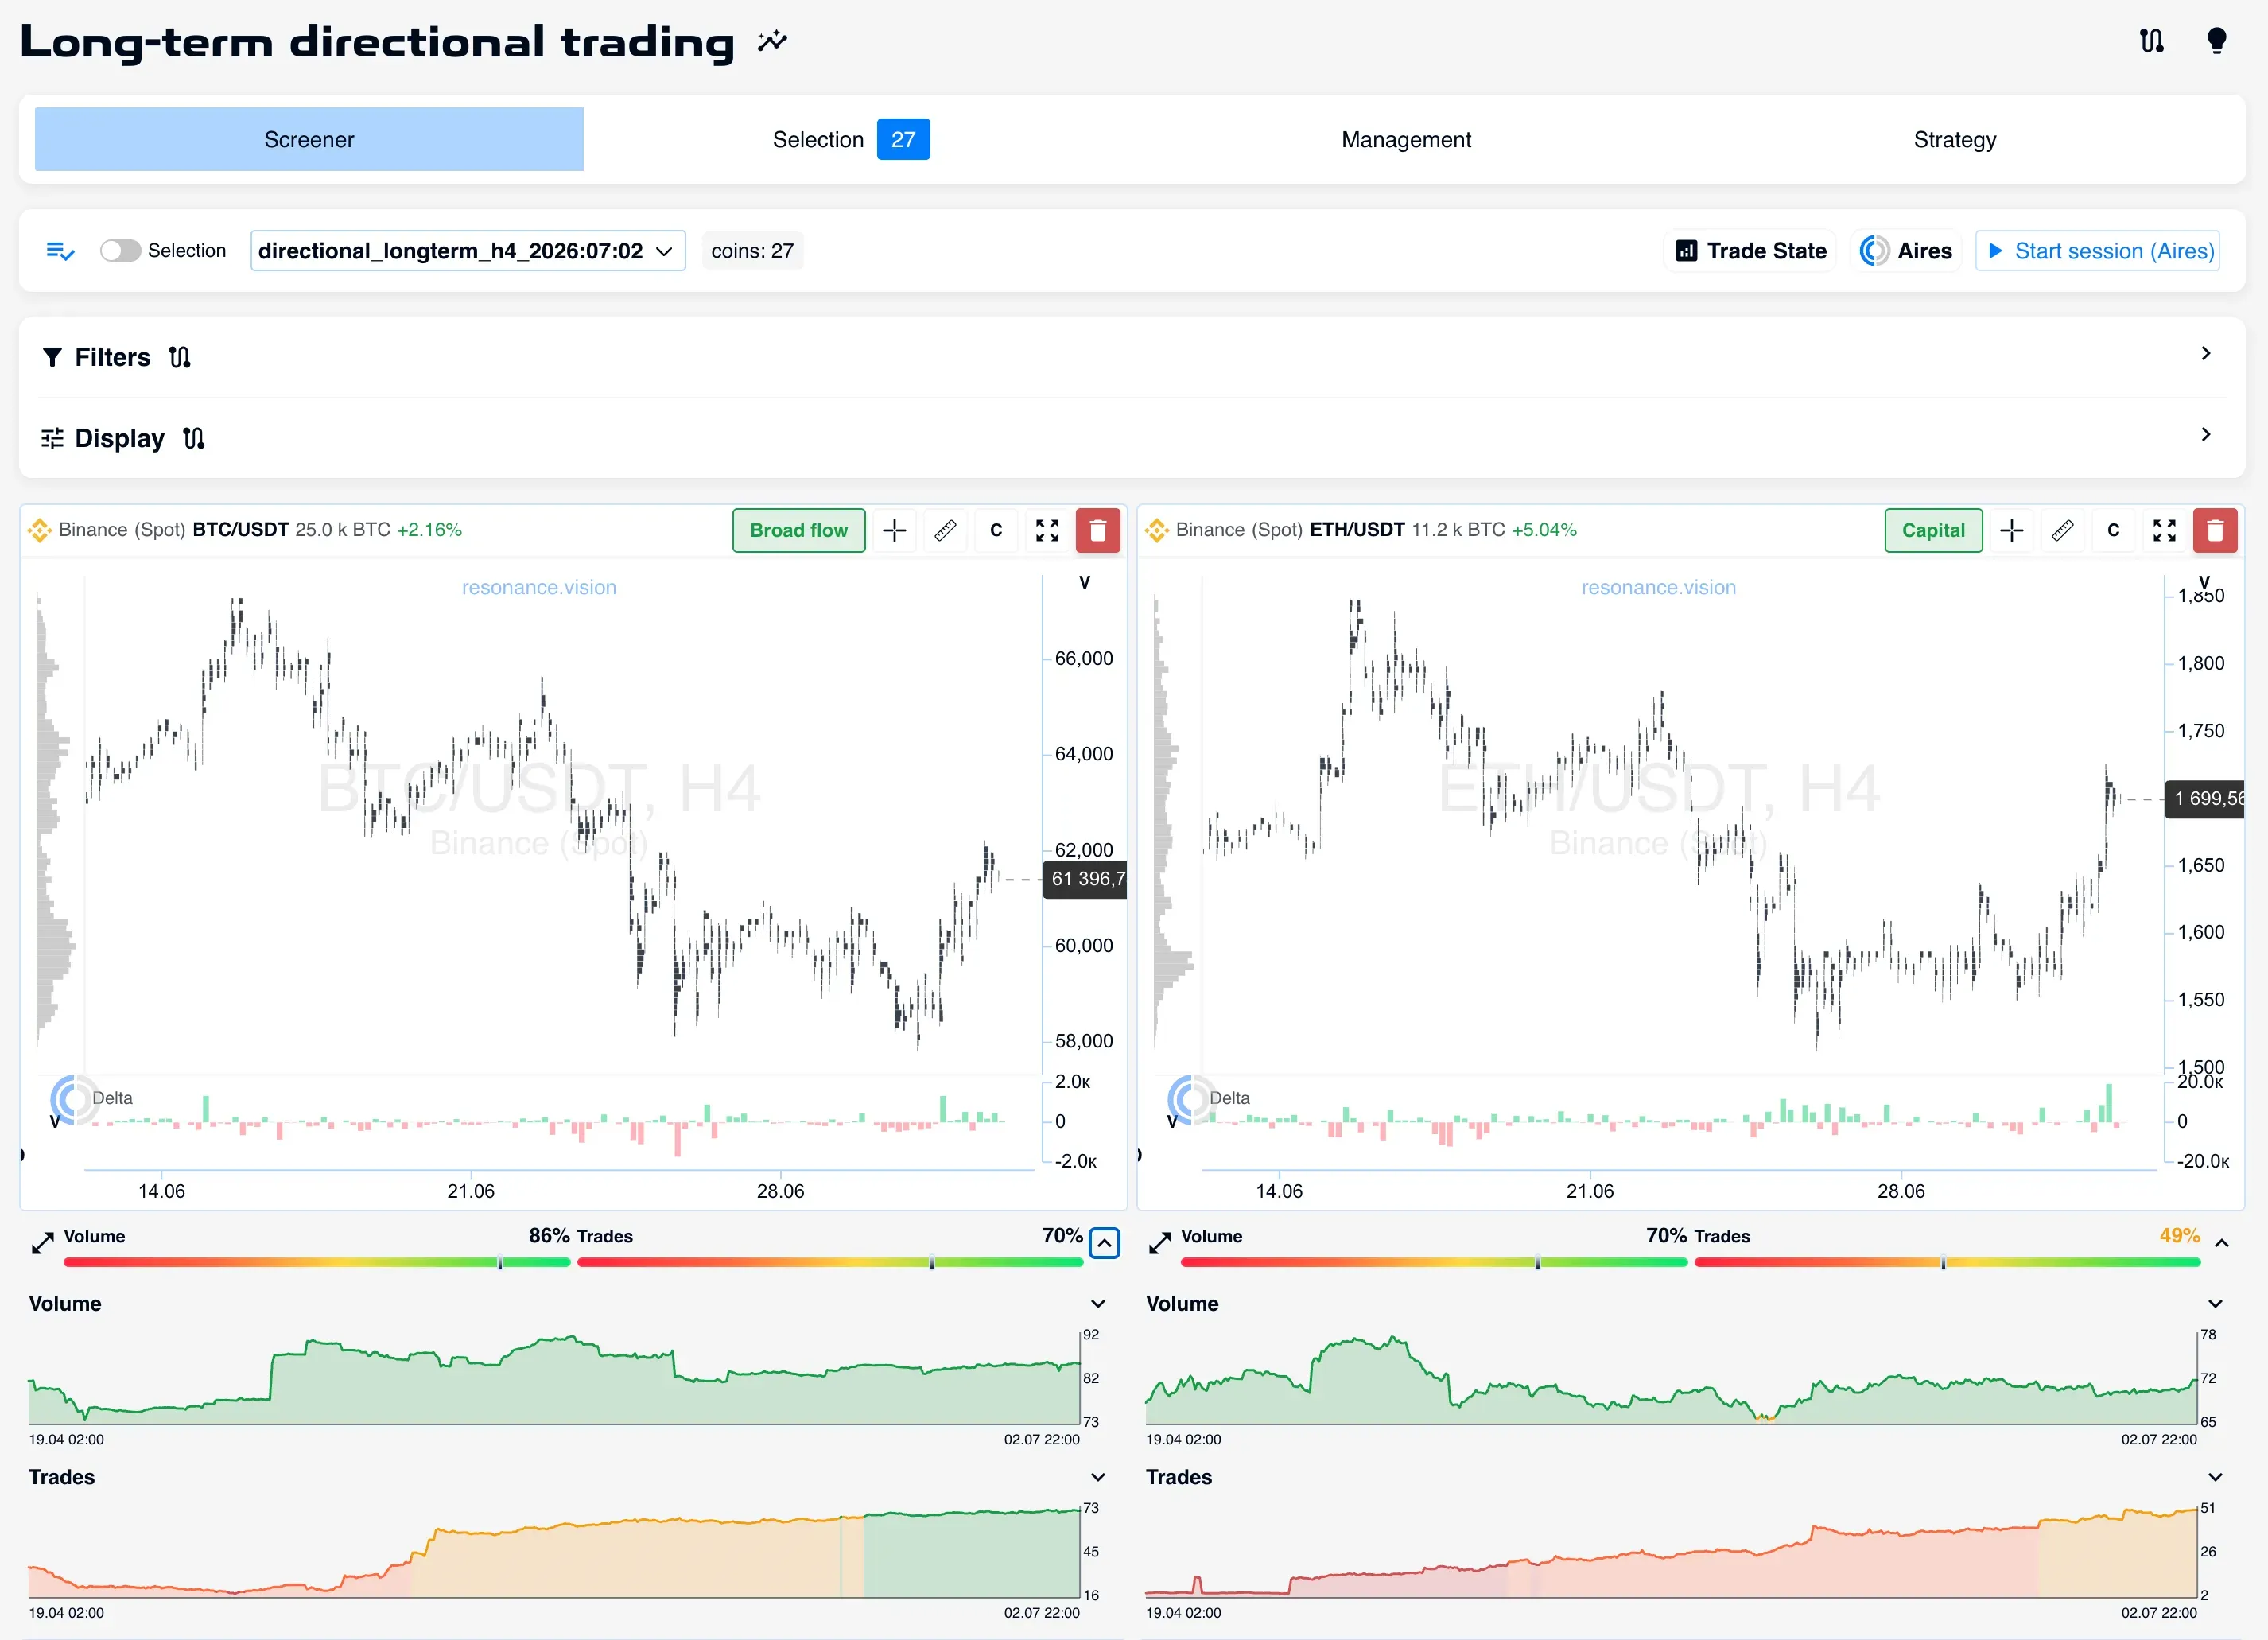
Step 1. Screener — Collect Raw Ideas
This is the tab where most traders spend the most time: trigger and analysis.
This is where we save it.
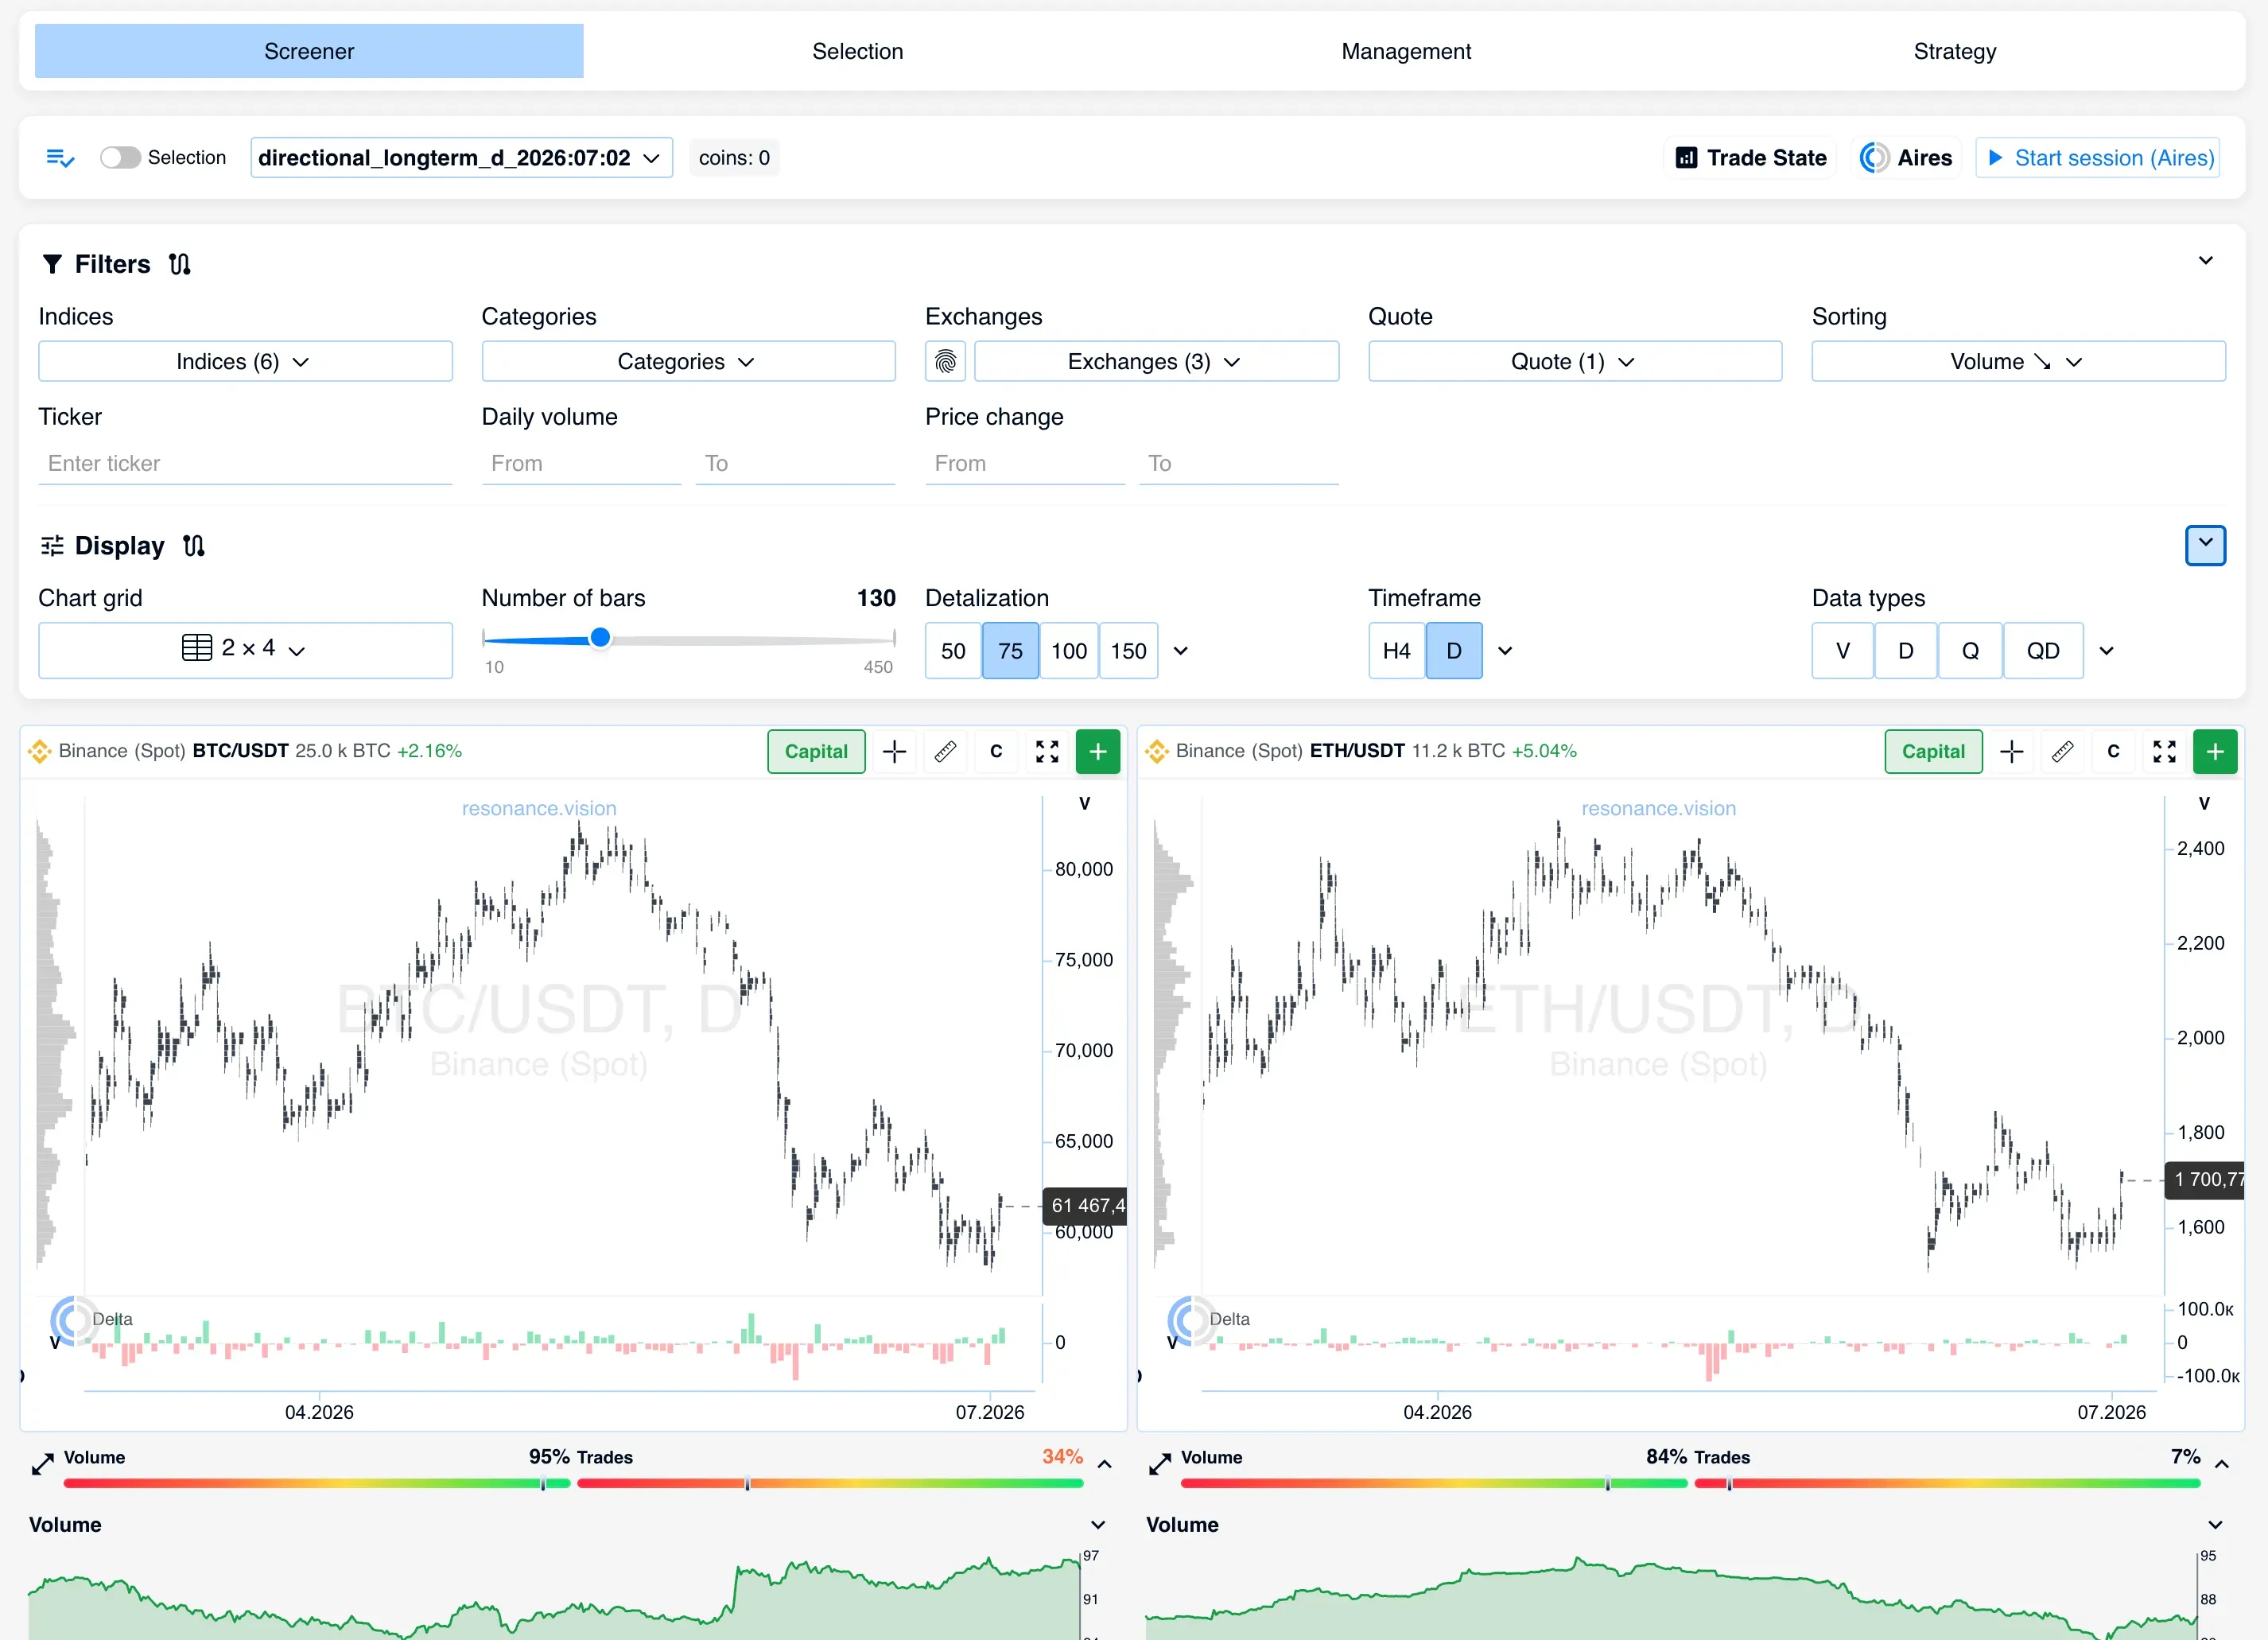
How it works, step by step:
- Set the session market. At the top, choose a timeframe (daily by default).
When you change the TF, a session gate kicks in — it enforces a simple rule:
one session list = one timeframe, so ideas do not mix. - Narrow the universe with filters. Quote currency, exchanges (with ready
presets “Spot only” and “Futures only”), categories, indices, daily volume,
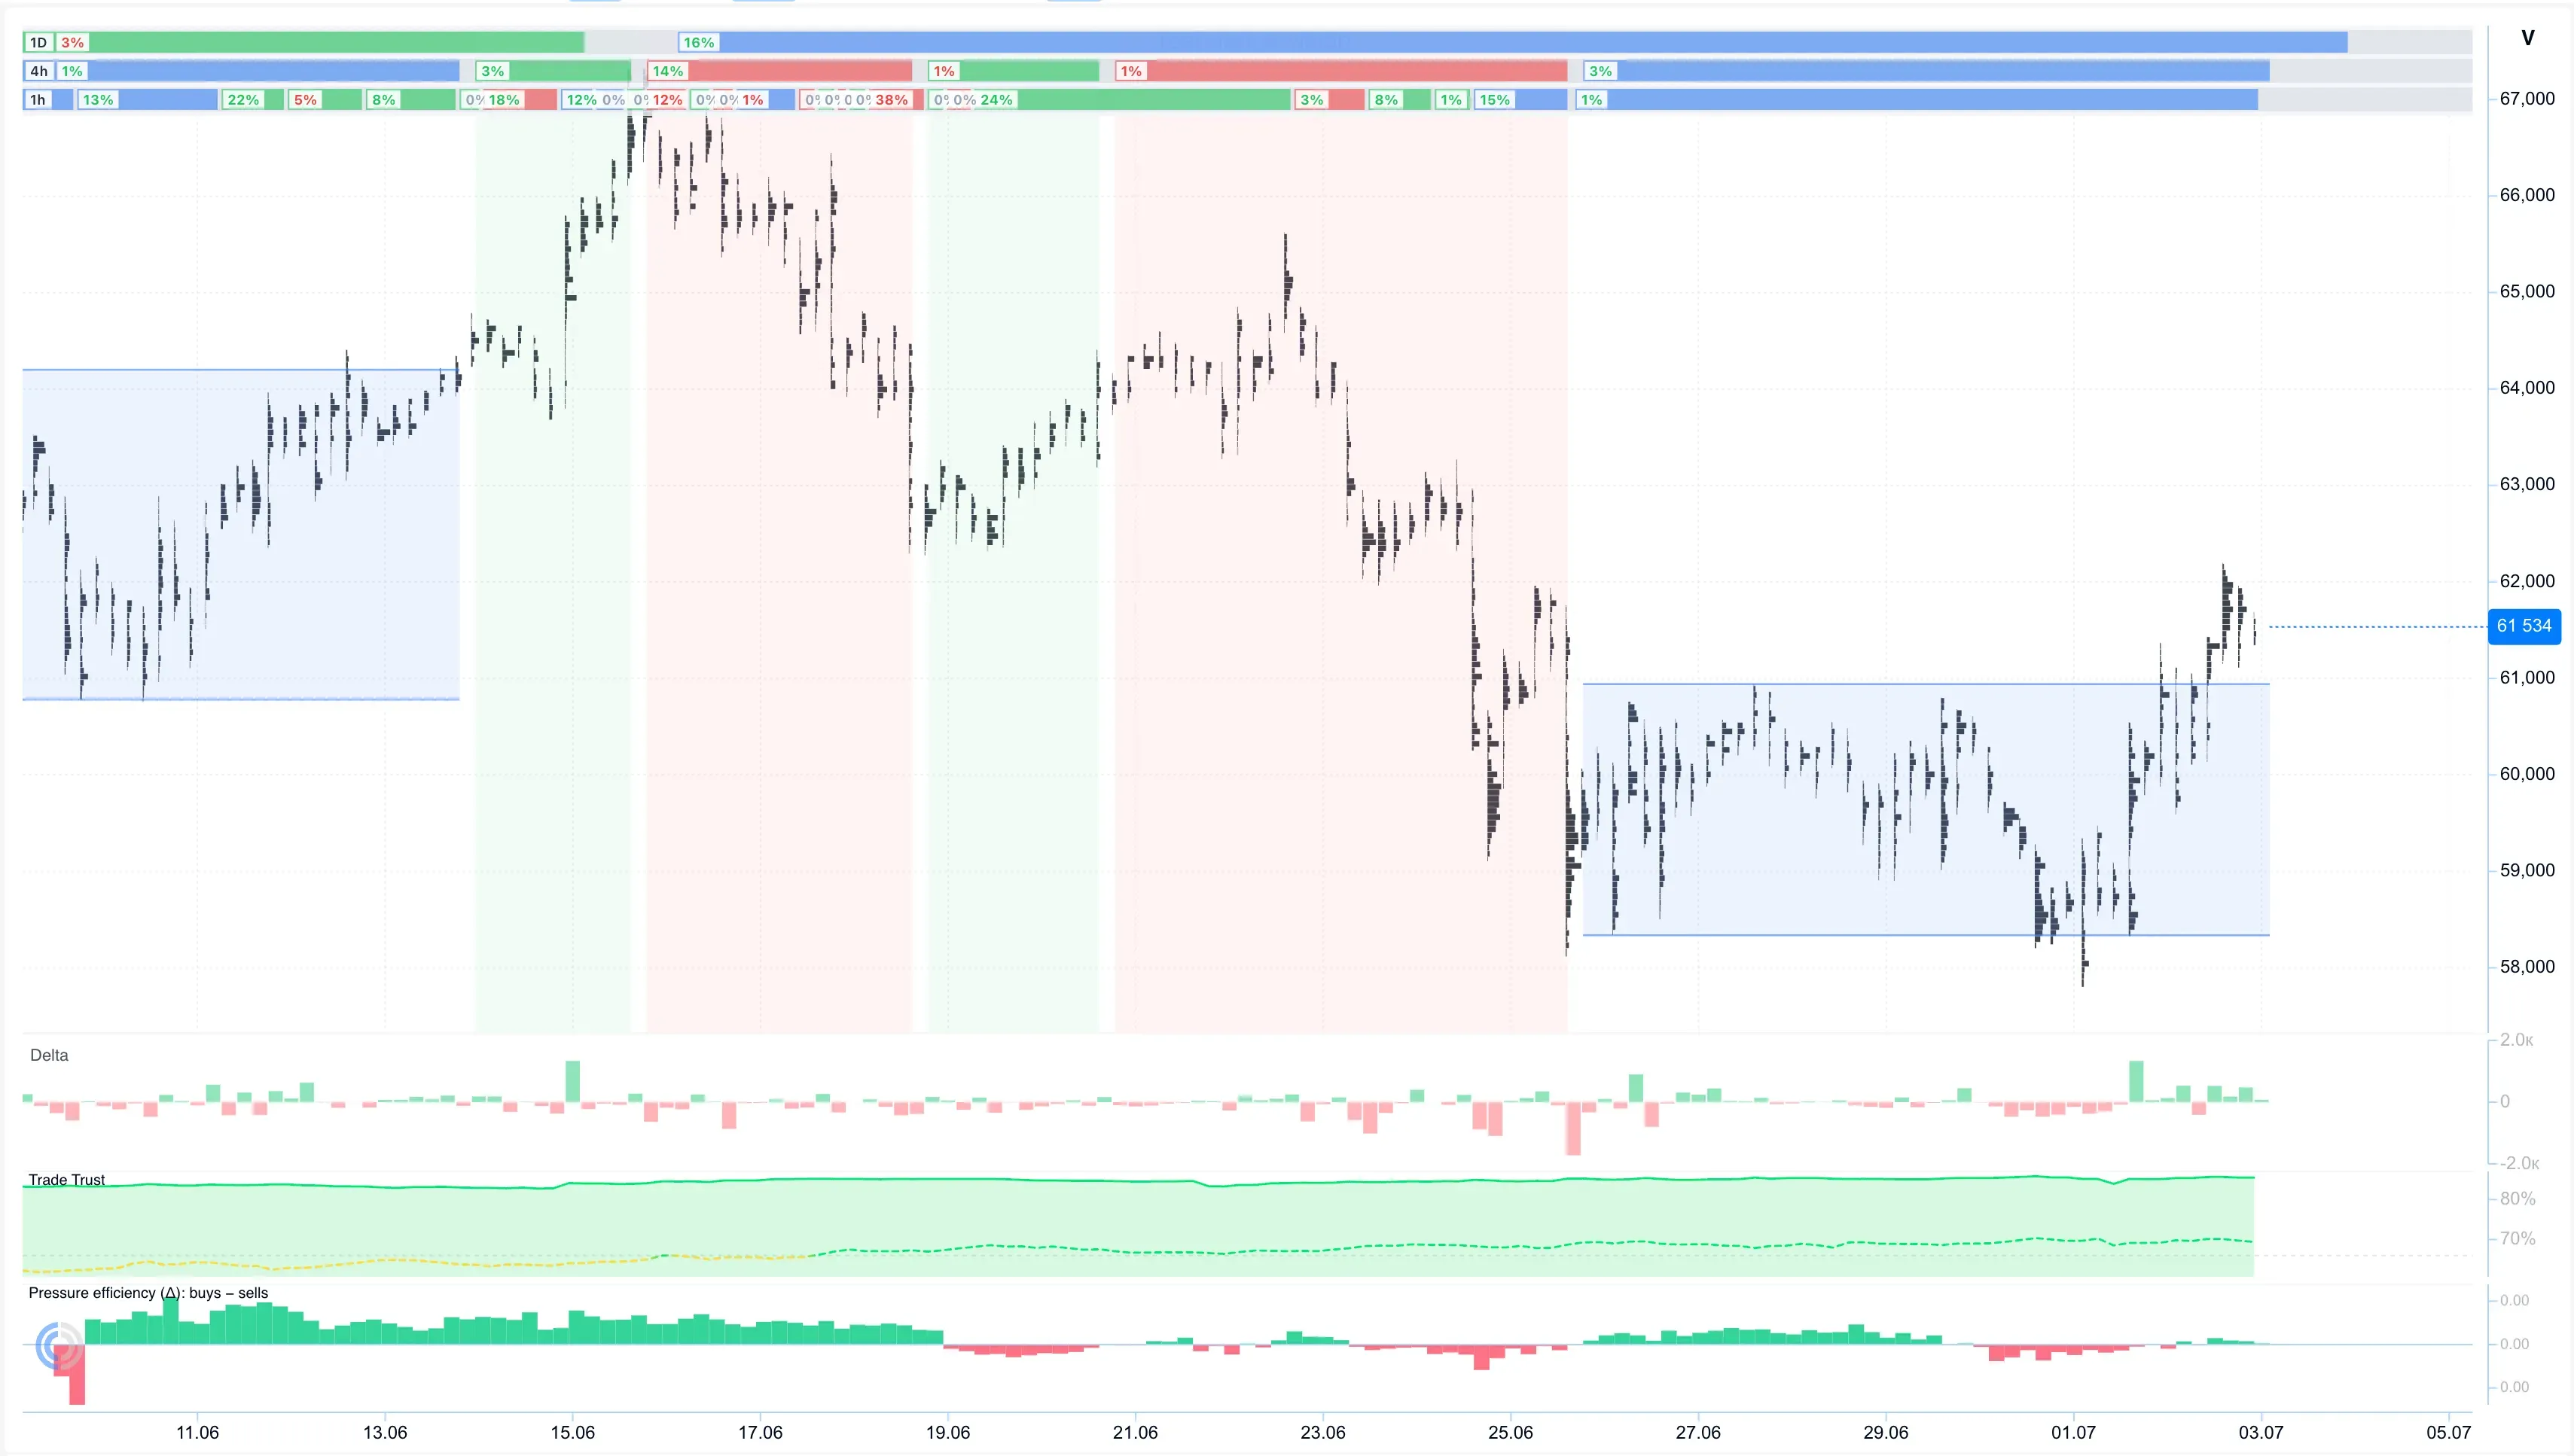
price change, and the “Endemics” toggle — coins unique to an exchange. - Read flow, not price. On cluster charts (volume-volume-delta configuration)
together with TradeState hints, you see the imbalance itself — where demand
or supply is building. That is the trigger: not “by eye on a candle,” but by
flow structure. - Filter by trust. On each cell header — a flow trust indicator (TrustBar)
and a flow mode badge: broad flow / capital / retail / noise. “Capital” means
a few large trades drive the move — smart money; “retail” means the move will
likely fade quickly. - Fill the session list. Quick-action buttons on the chart header add a
candidate to the list in one click.
So you do not have to keep the whole process in your head, there is a session
briefing at the entry, and an assistant guides you through the workflow and
suggests candidates from the current page.
Step exit: a session list of “raw” ideas.
Step 2. Selection — Second Pass and Plan
The list is built — now it needs to be thinned and confirmed. This is the
validation stage, the second most time-consuming one.
The tab offers three work modes:
- List view — the same set of charts, but the button is now “remove”: quickly
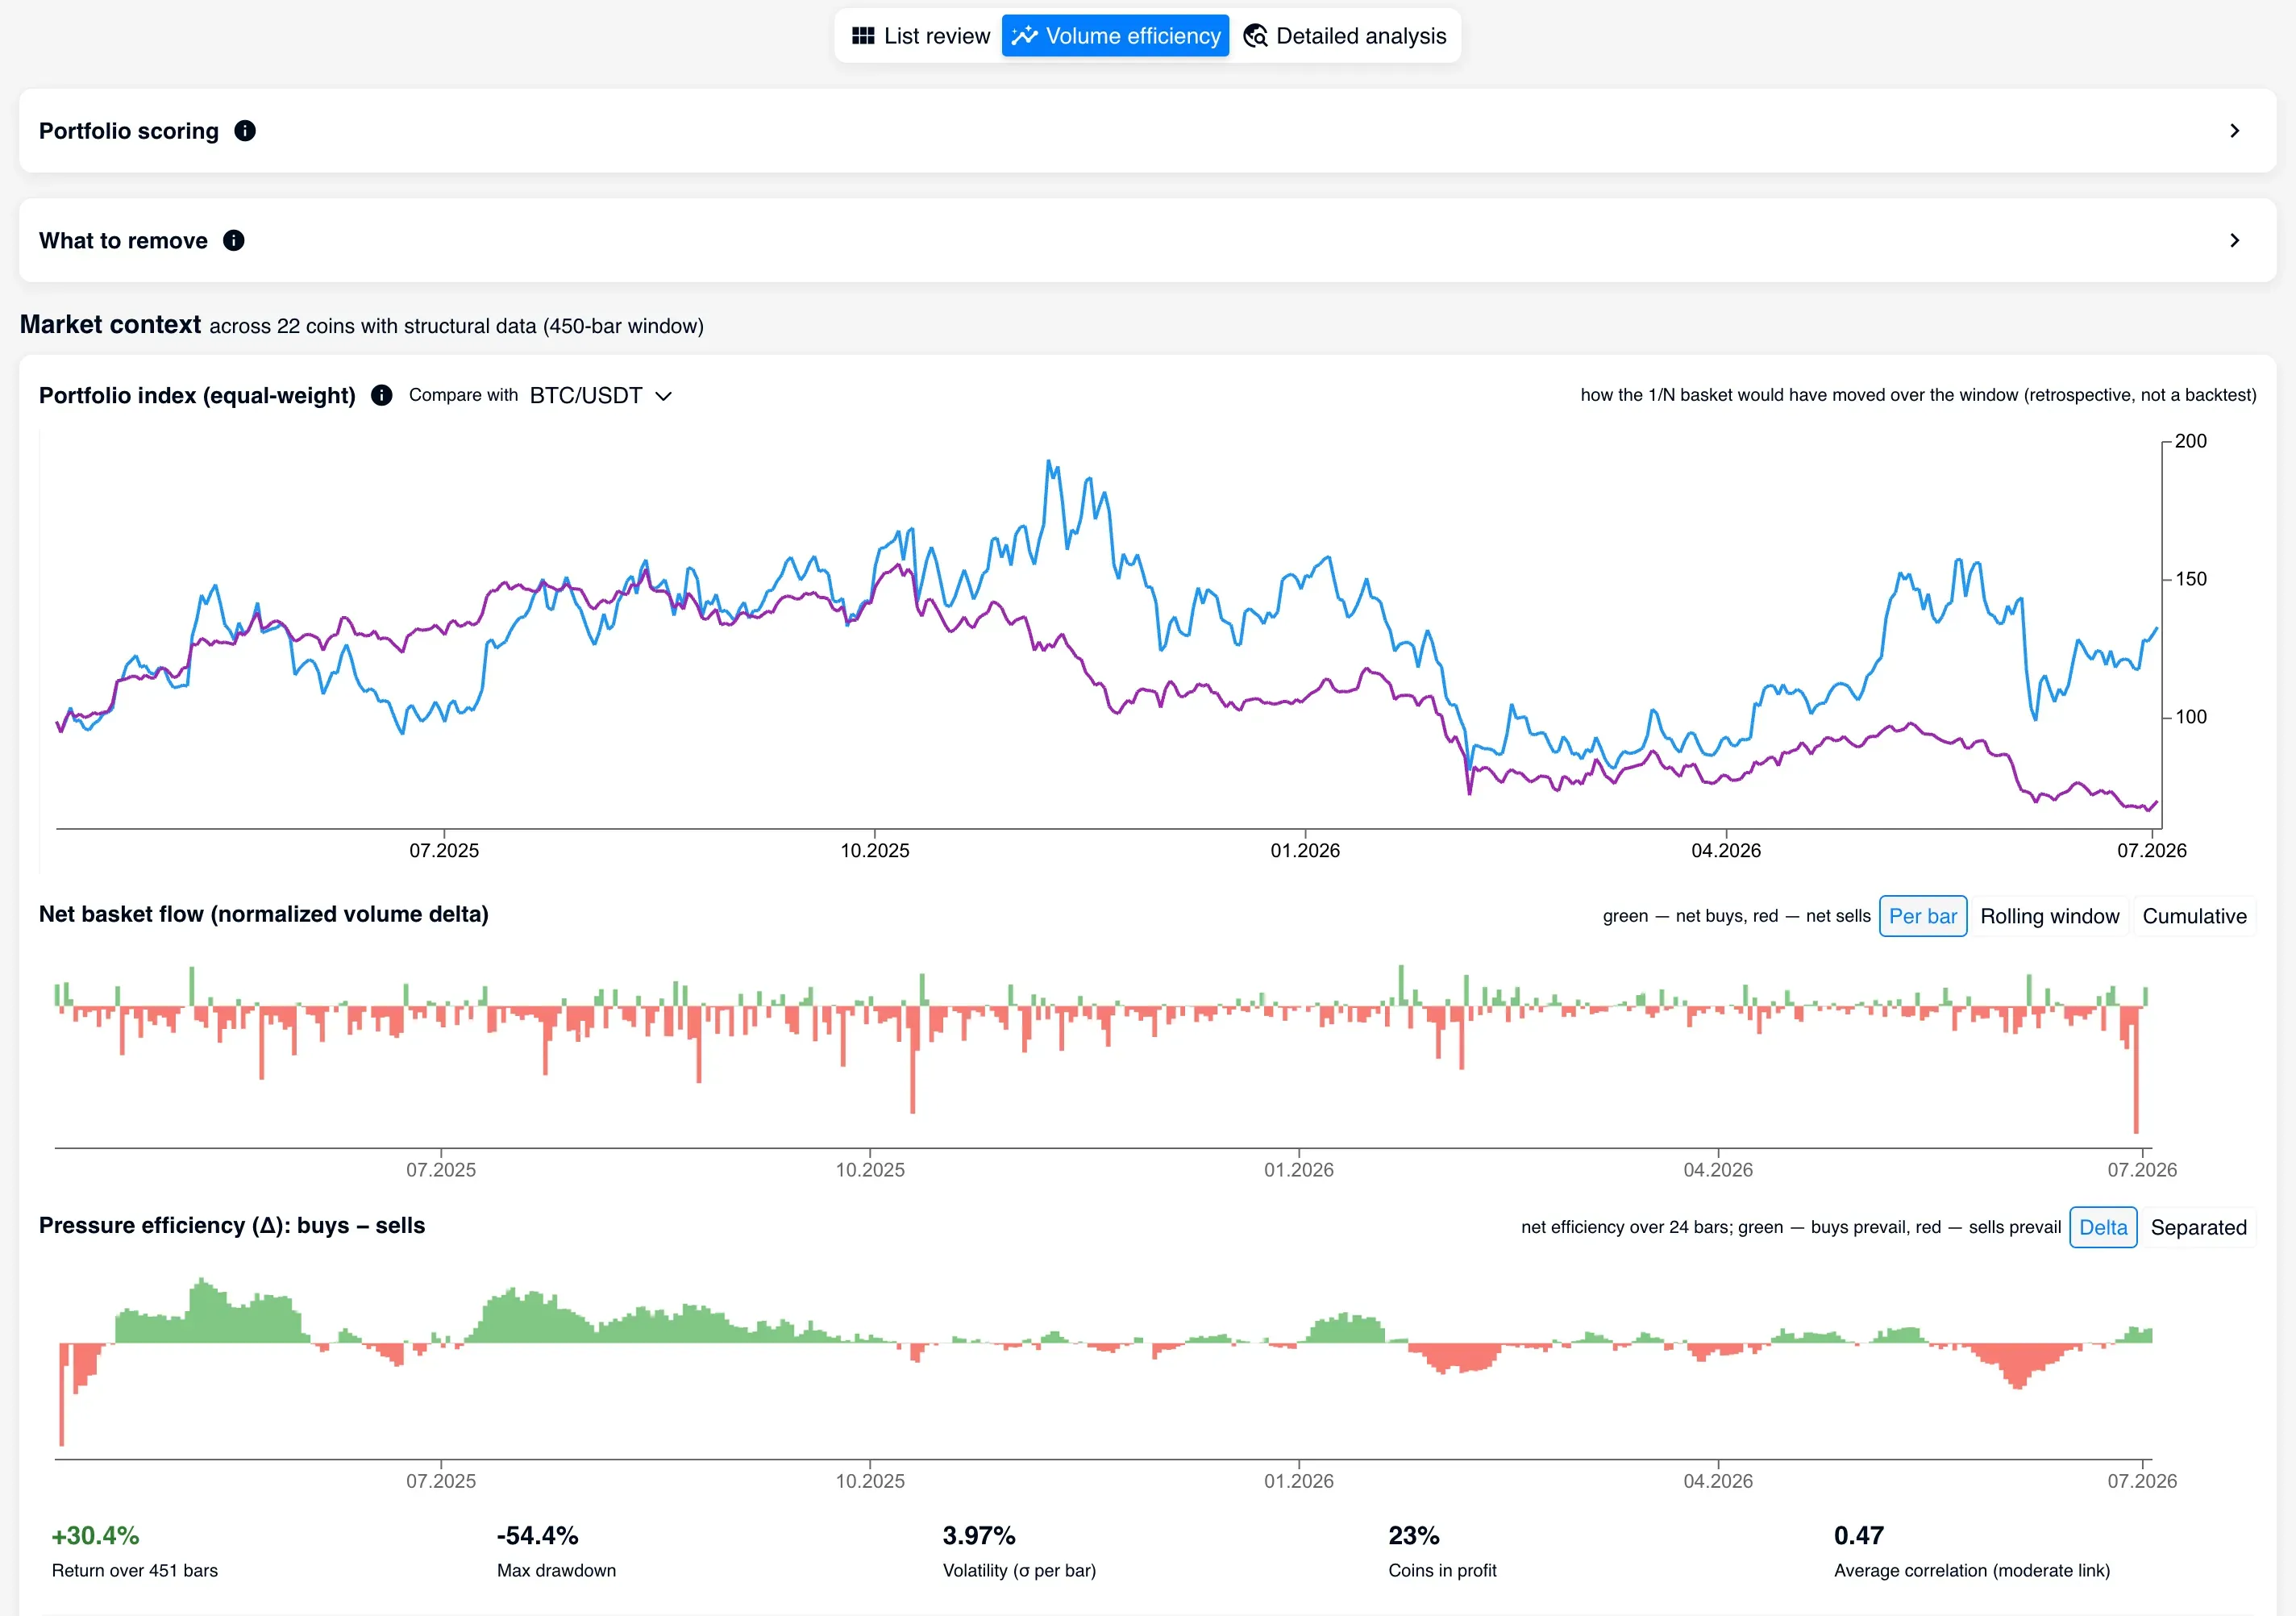
filter out weak ideas. - Volume efficiency — row-by-row review: for each coin, mini charts of price
and delta plus a table of flow impact metrics on price (how efficiently volume
moves price). This is validation by numbers: you see whether real capital
stands behind the move or it is noise. - Detailed analysis — the same coin across several exchanges at once. On one
venue the picture may be muddy, on another — obvious; choose where the idea
reads more clearly. Here are also “Add,” “Replace” (refine the idea’s
exchange), and “To end” buttons.
When a coin is confirmed, the “To portfolio” button opens the execution plan.
Currently a directional position is available (grid bot and DCA are in
development). With “Create note” the idea is saved with tags: session list
id and plan tag. Tags are not a formality: the portfolio is assembled
automatically from them, in one session slice. The idea is not lost in the gap
between “found” and “opened.”
Step exit: confirmed ideas captured as notes with tags.
Step 3. Management — Portfolio Support
Opening a position is half the job. After that comes what traders usually have
neither the energy nor the time for. Here the platform makes support cheap: open
the tab — and you immediately see what is happening and what to do.
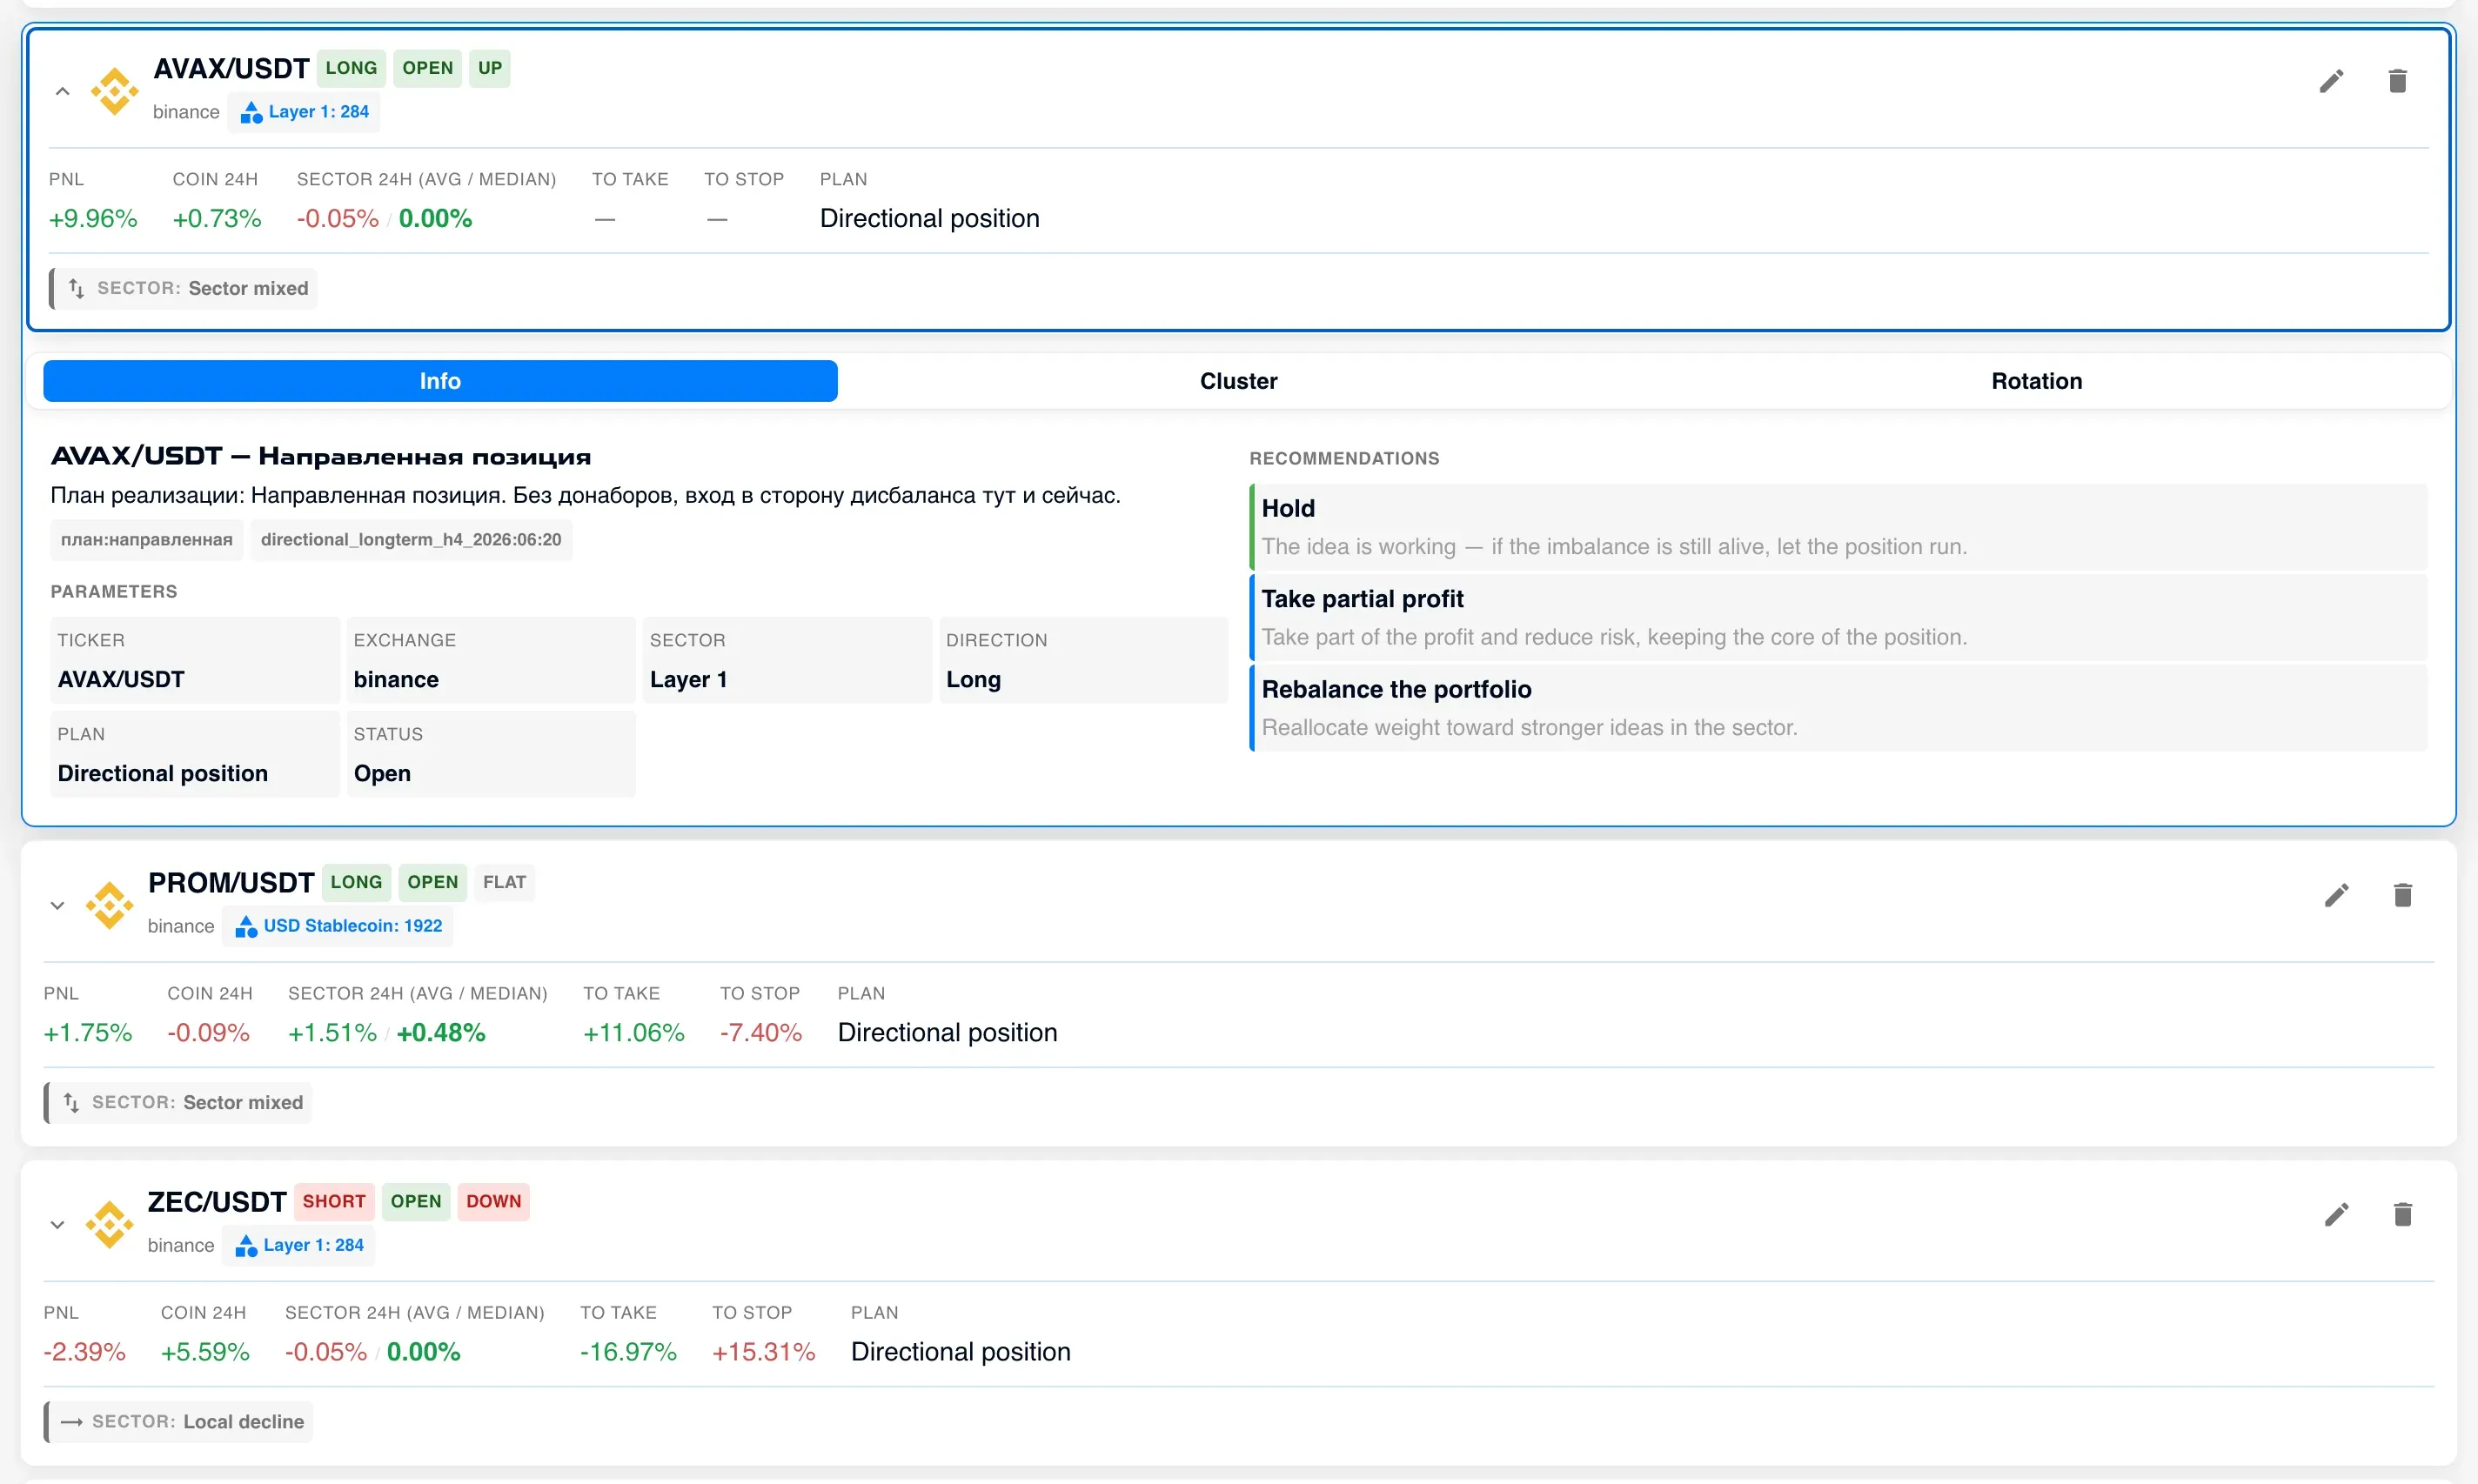
The portfolio is built from notes by session list tag. For each position — an
accordion row with a card:
- ticker, execution type, exchange;
- position state: up / flat / down with move size from entry;
- “coin vs sector” badge — comparison of the coin with its category index
and the market. In a second you see: is this a drawdown only in your coin, or
is the whole sector falling. The difference matters — in the first case it is
noise, in the second a trend.
Inside the row are three sub-tabs: Info (ready recommendations for position
and sector state), Cluster (coin microstructure — is the imbalance that
spawned the idea still alive), and Rotation (more below). The portfolio
sub-tabs themselves are “Positions” and “Portfolio state.”
The main point: decisions rely on comparison with the sector and the market,
not intuition. The “Info” tab directly offers a set of actions — hold, take
partial profit, hedge, rotate — depending on whether the position is in profit
or loss and where the sector is heading.
Strategy Highlight: Rotation Into the Sector Leader
This is the feature worth understanding the tool for.
Imagine: your theme (say, the AI token sector) is rising, but your specific coin
is flat. You are right on direction — and still under-earn. Rotation is
replacing a weak coin with a stronger one within the same theme, without exiting
the idea. The thesis “the sector will rise” does not change — only the
instrument to play it changes.
How it differs from a hedge:
| Rotation | Hedge / pair trade | |
|---|---|---|
| From the sector | we take the strongest | we take the weakest |
| Action | replace with the leader | short against long |
| Result | stay directional, but stronger | reduce risk |
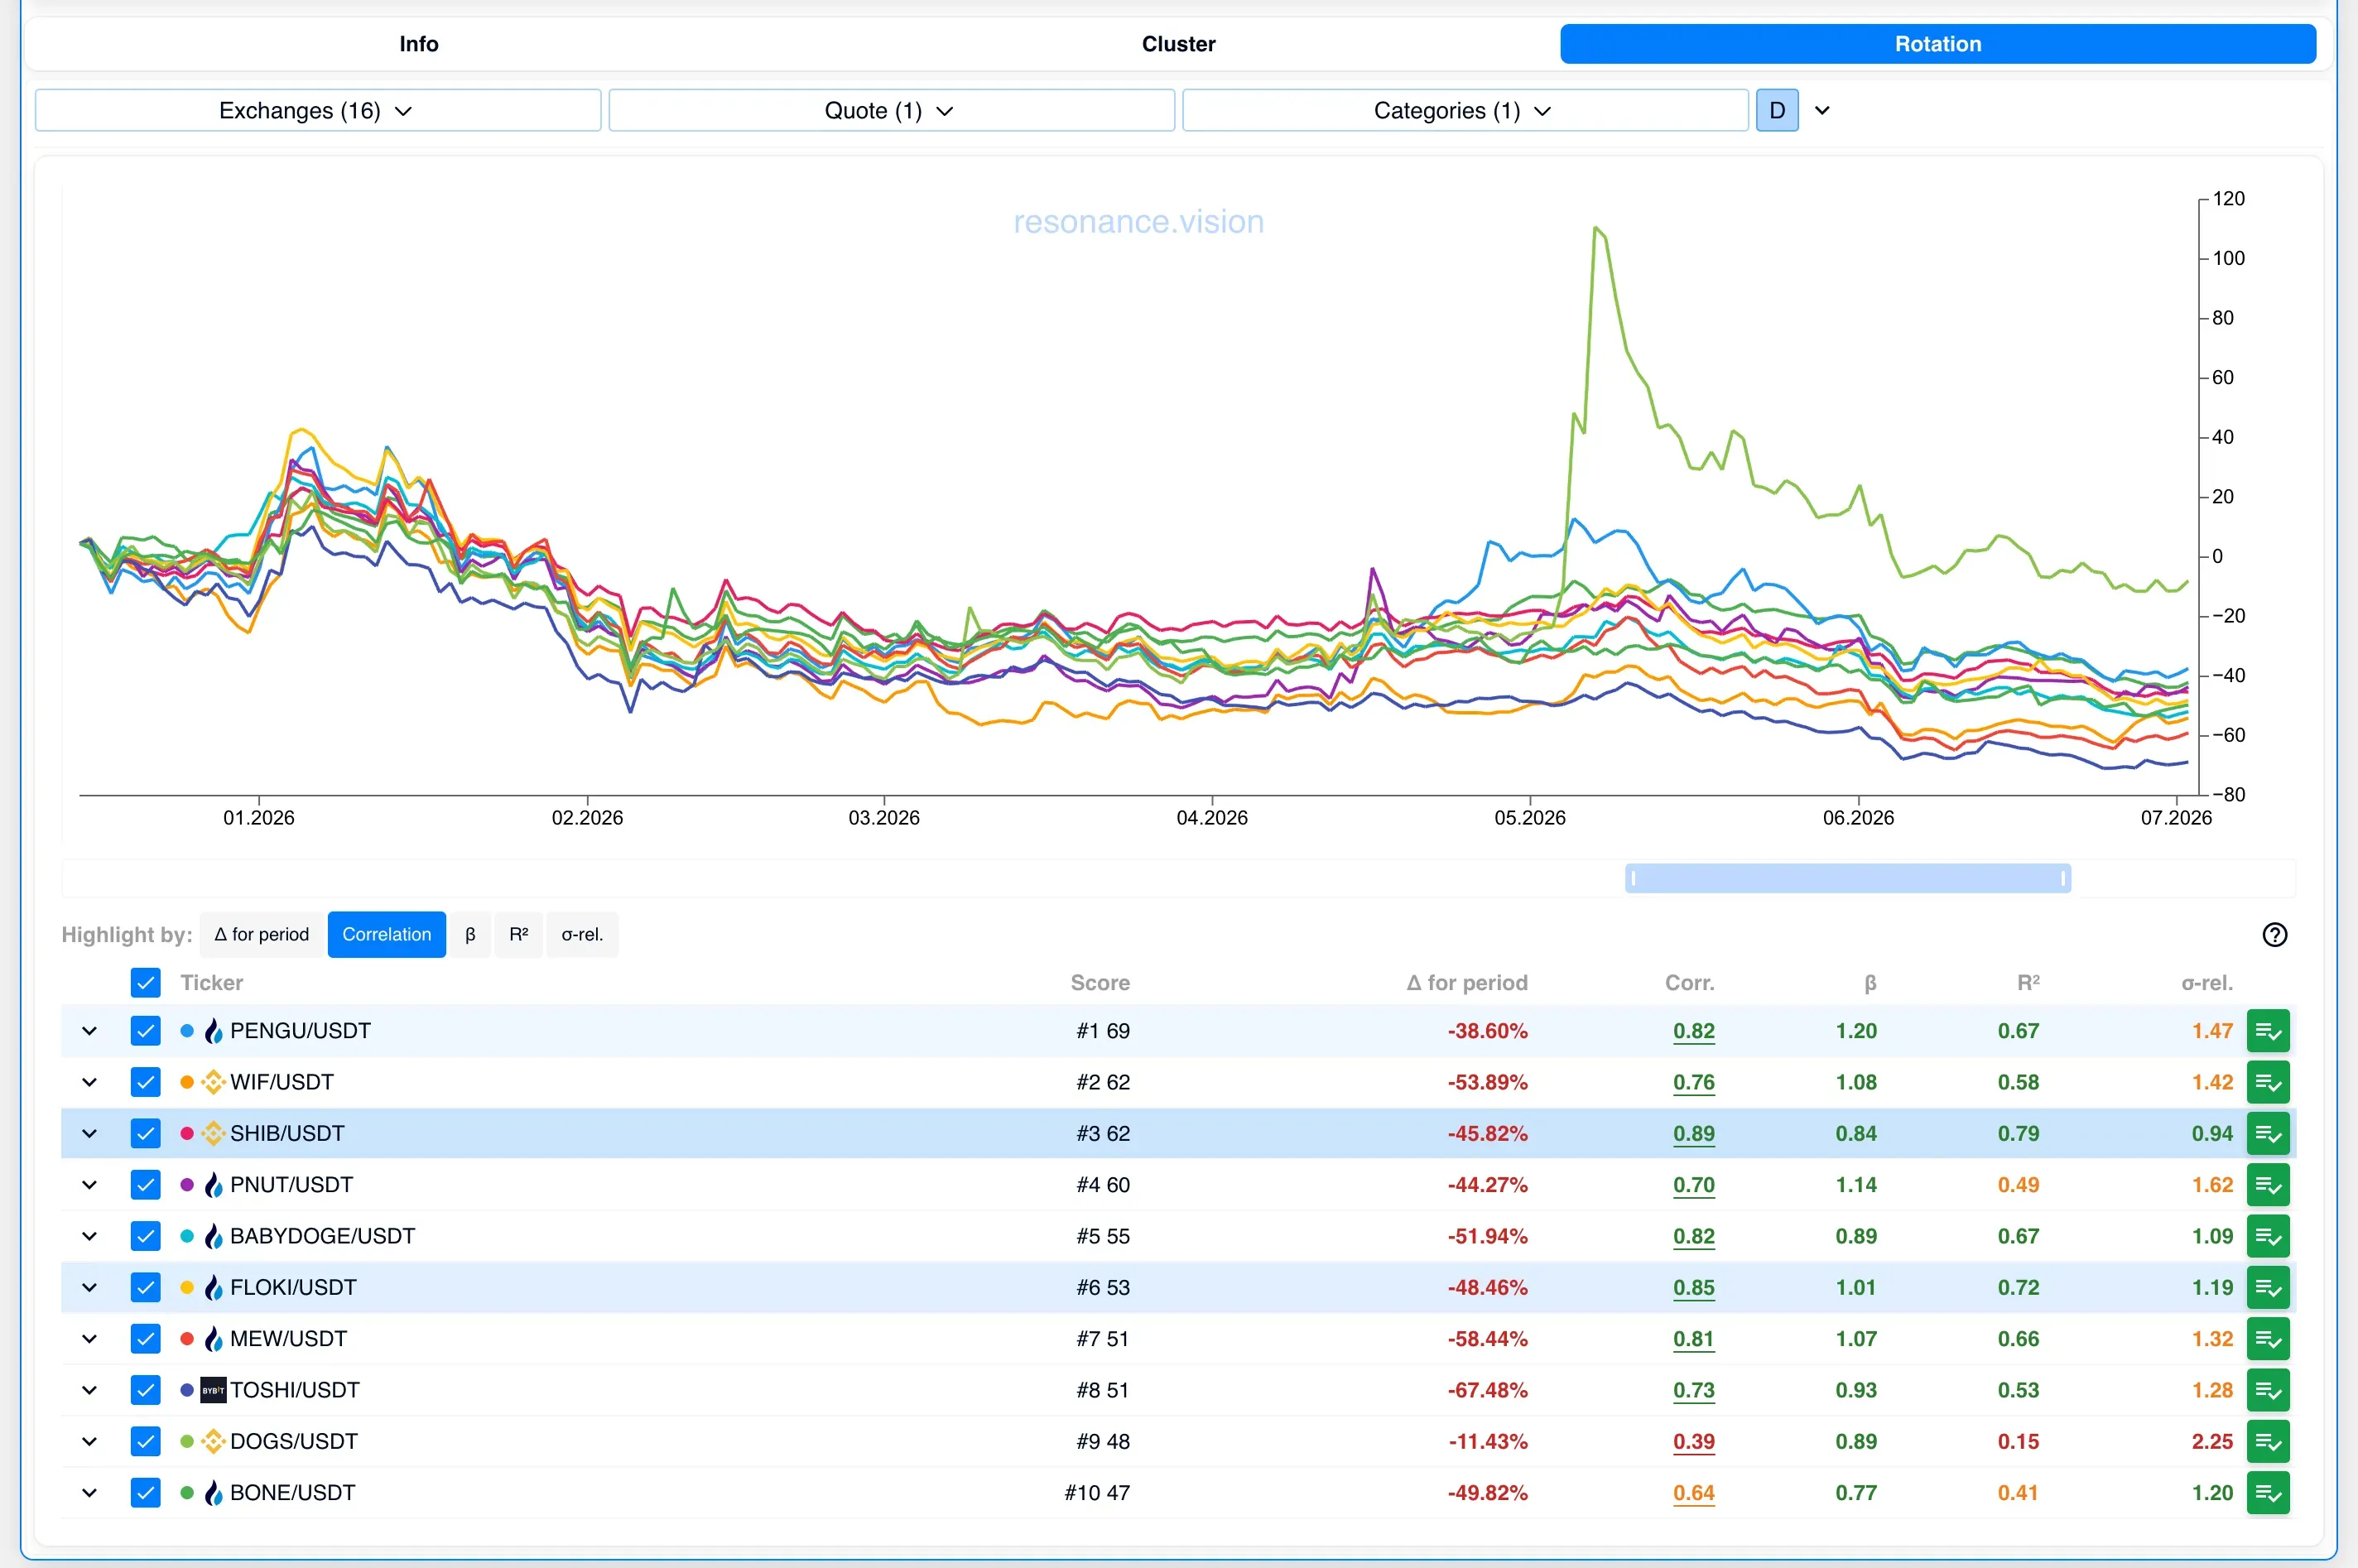
Candidate selection works as a two-stage sieve. First a cheap stage: roughly
rank the whole sector by daily impulse and keep a short shortlist. Then the heavy
stage: for the shortlist compute correlation, beta, R², and relative volatility
against your coin — and combine everything into a rotation score from 0 to
100. Candidates are sorted descending, the leader on top.
The ideal candidate looks like this:
- high correlation (same theme, not a new independent risk);
- beta greater than 1 (more movement on the same sector wave);
- high R² (the link is stable, not a random news pump);
- outperforms your coin over the window;
- moderate relative volatility (risk under control).
The main trap is chasing “the biggest gainer.” High growth with low R² almost
always means a local pump that will detach from the sector, and you buy the top.
That is why we rank not by growth, but by the score from metrics.
Summary
Let us fold the funnel into one picture. Raw ideas are born in the Screener
— from real flow, not candles. In Selection they pass validation by numbers
and become notes with tags. In Management notes become a portfolio, and each
decision is backed by sector comparison and ready recommendations. Nothing is
lost between steps.
And, returning to where we started:
- the strategy can now be named step by step — that is the three tabs and
six stages; - it fits in an hour a day — the search and validation routine is automated;
- it takes off your plate the most expensive stage — finding, analyzing, and
confirming ideas, which consumes 88% of time.
That is the difference between “I kind of have a strategy” and a strategy you
can actually use.
Open the directional long-term strategy and walk the funnel on one of your
own ideas — from a flow anomaly to a portfolio position.
Recommended articles


