TradeState: how to tell a real trend from a trap — by flow, not by eye

TradeState — a layer on the cluster chart that shows whether the market is
trending or ranging right now, and whether flow confirms the price move. A
simple explanation for beginners — no formulas, no jargon.
Table of contents

A familiar situation: price breaks a level, you enter — and an hour later it’s
back inside the range and you’re in the red. Or the opposite: a trend has been
rising for three weeks, you hold it because “it’s going up, so everything’s
fine,” and it reverses exactly when you stop checking.
The problem is that a single chart bar shows where price was, but not
who moved it there and whether that “someone” is still in the market. We’ve
already written that for most traders it’s the search and validation of an idea
that eat up almost all their time —
largely because you have to guess from price alone. TradeState is the tool
that closes exactly this gap.
The idea in 60 seconds
TradeState is an analytics layer on top of the cluster chart. It doesn’t
replace the cluster bars and the volume inside them — it answers one practical
question: can you trust what you see on the chart right now.
It does this on two levels:
- Period — trending or ranging right now, and how “fresh” that state still
is. - Event — the moment the regime changes: a new trend is born, an old one
runs out of steam, or price breaks the boundary of a range.
The difference is simple: a period is “what’s happening now,” an event is
“something just happened.” Together they give you a structure to lean on
instead of redrawing levels by eye every time.
Analogy: a road with segments
Picture a road instead of a chart:
| What | Analogy | Question it answers |
|---|---|---|
| Period | A stretch of road: an uphill, a downhill, or a flat stretch | “Are we going up, down, or standing in a corridor now?” |
| Event | A fork or an exit: start of a climb, end of a trend, leaving the corridor | “Did we just start a new segment or finish the old one?” |
Cluster bars are like “footprints in the sand” — separate and not always
informative on their own. TradeState is the map of segments that keeps you from
mistaking a one-off spike for a sustained move.
What you see on the chart
Trend
An up or down segment. TradeState tracks the last local high or low (the
extremum) and hints at how “fresh” the trend is: if price hasn’t updated the
extremum for a while, the risk that the move is running out of steam grows.
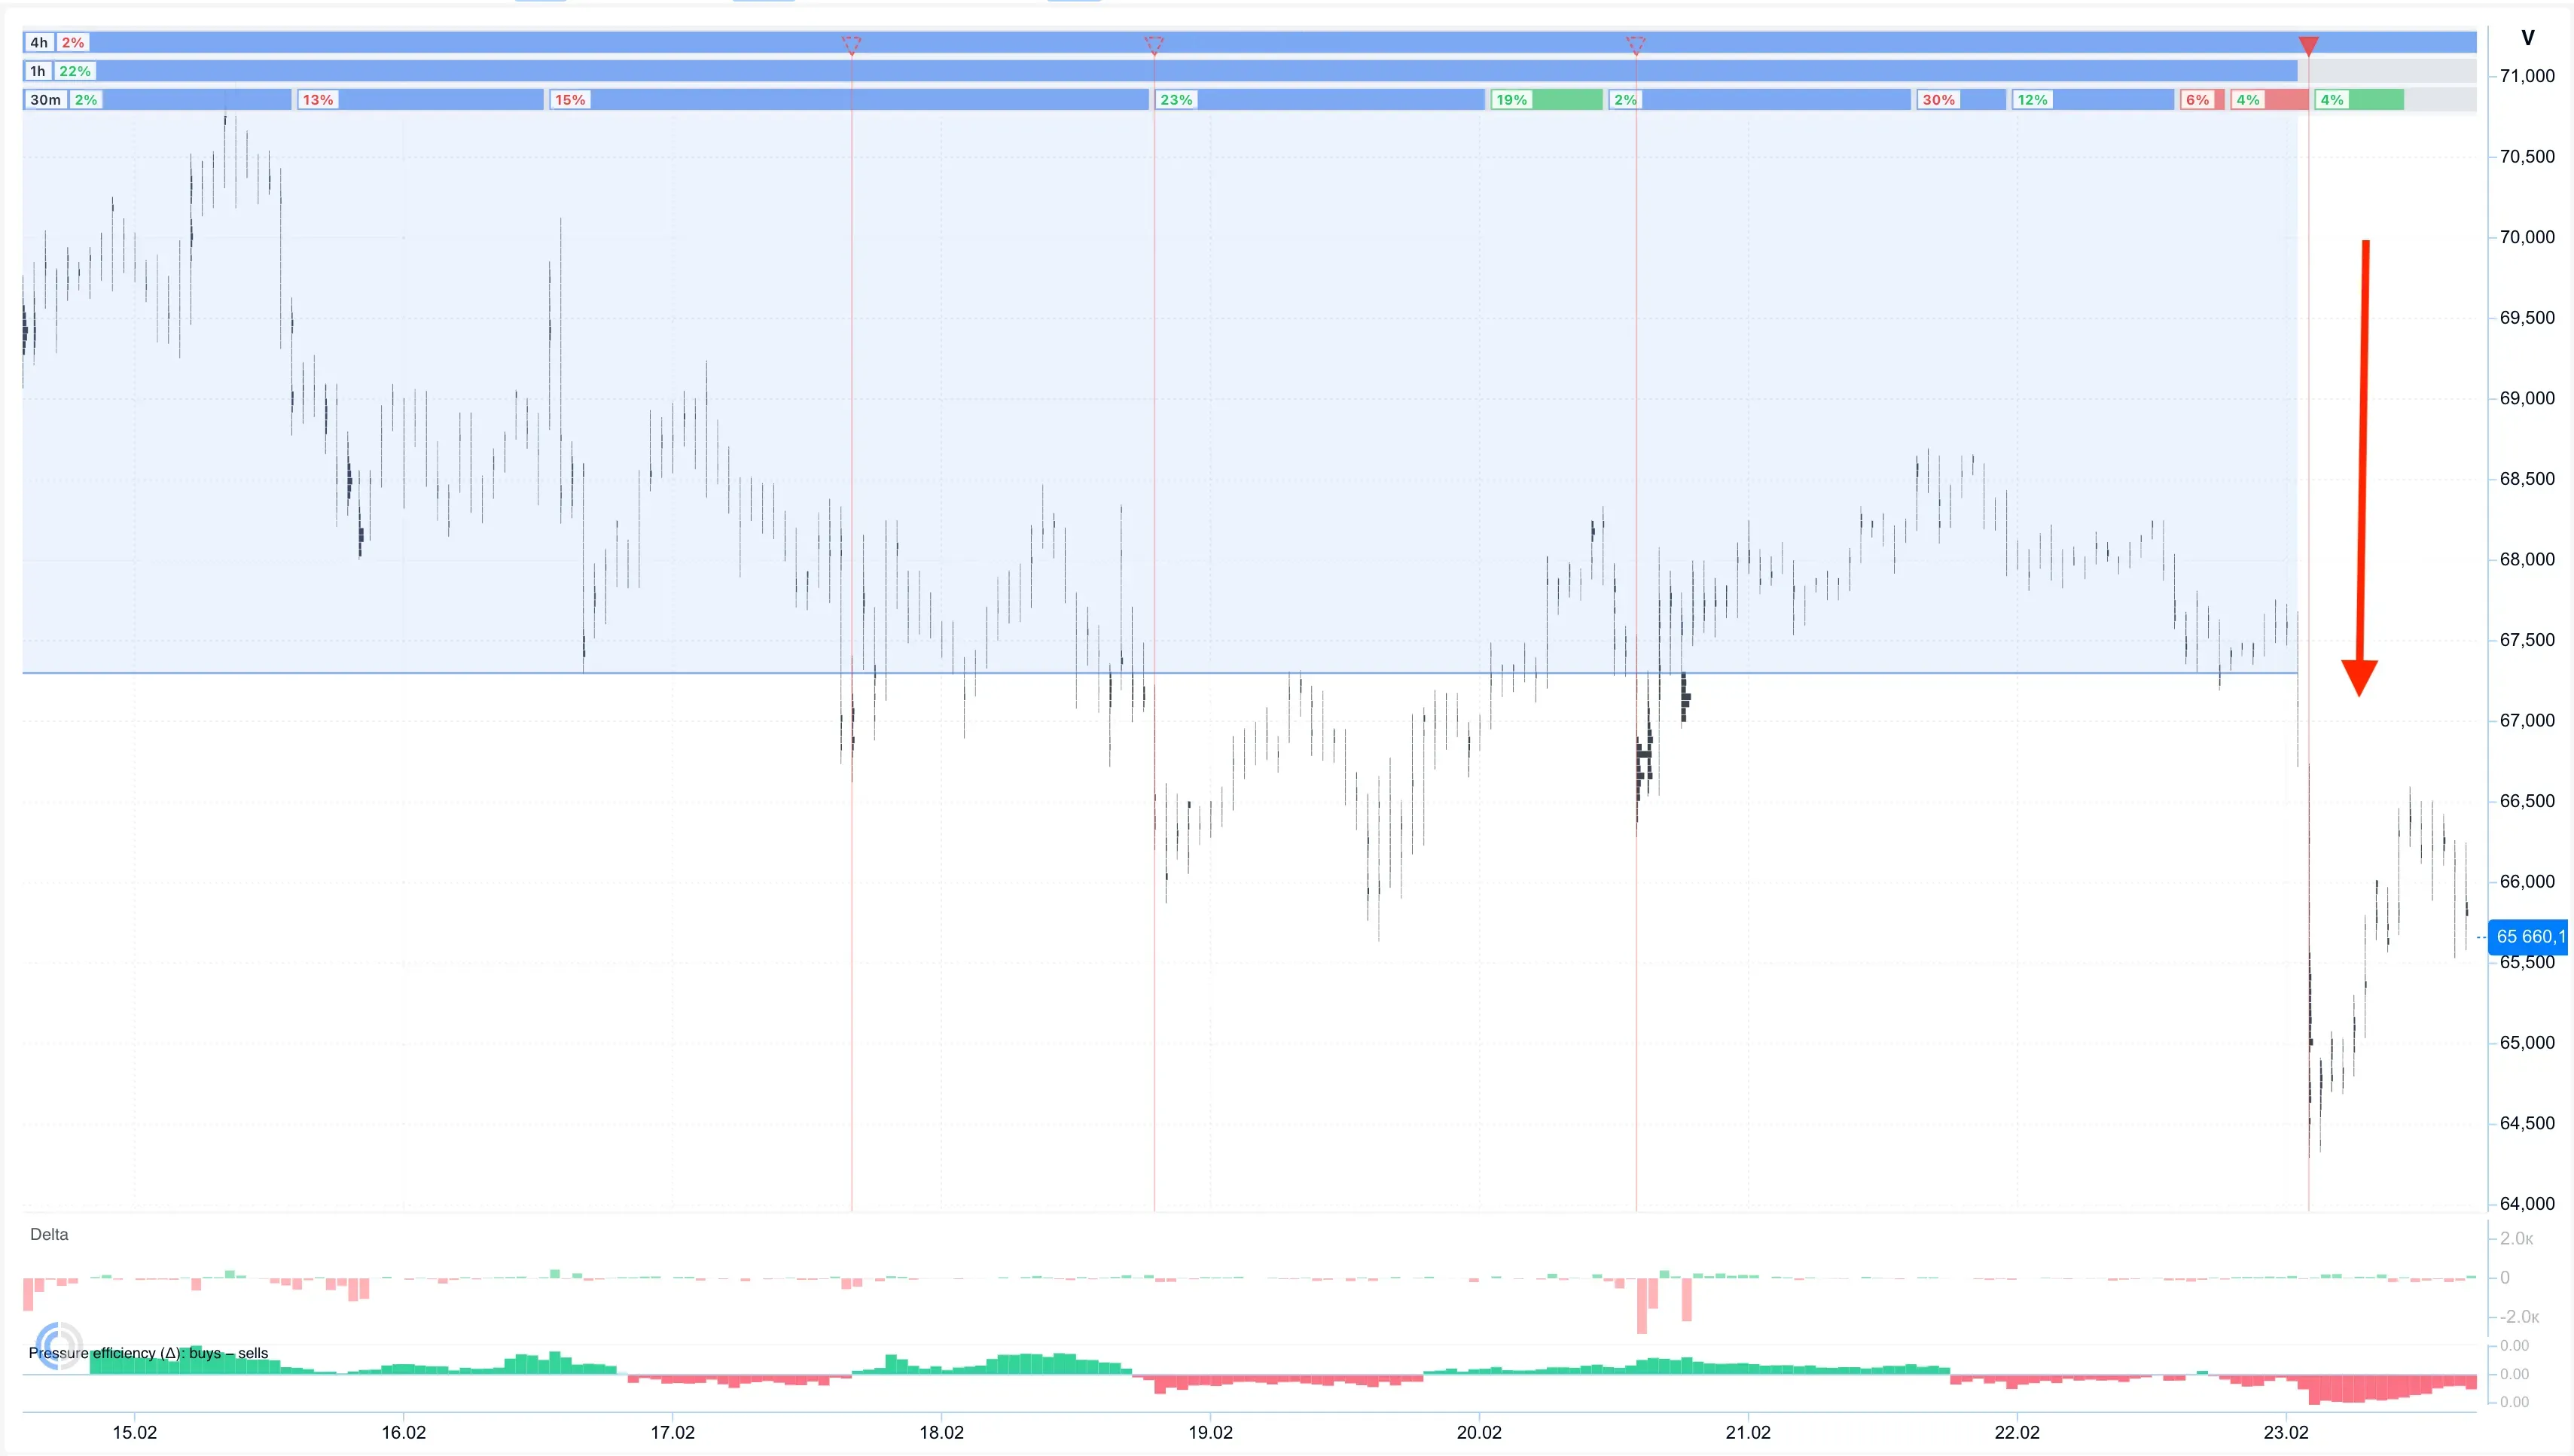
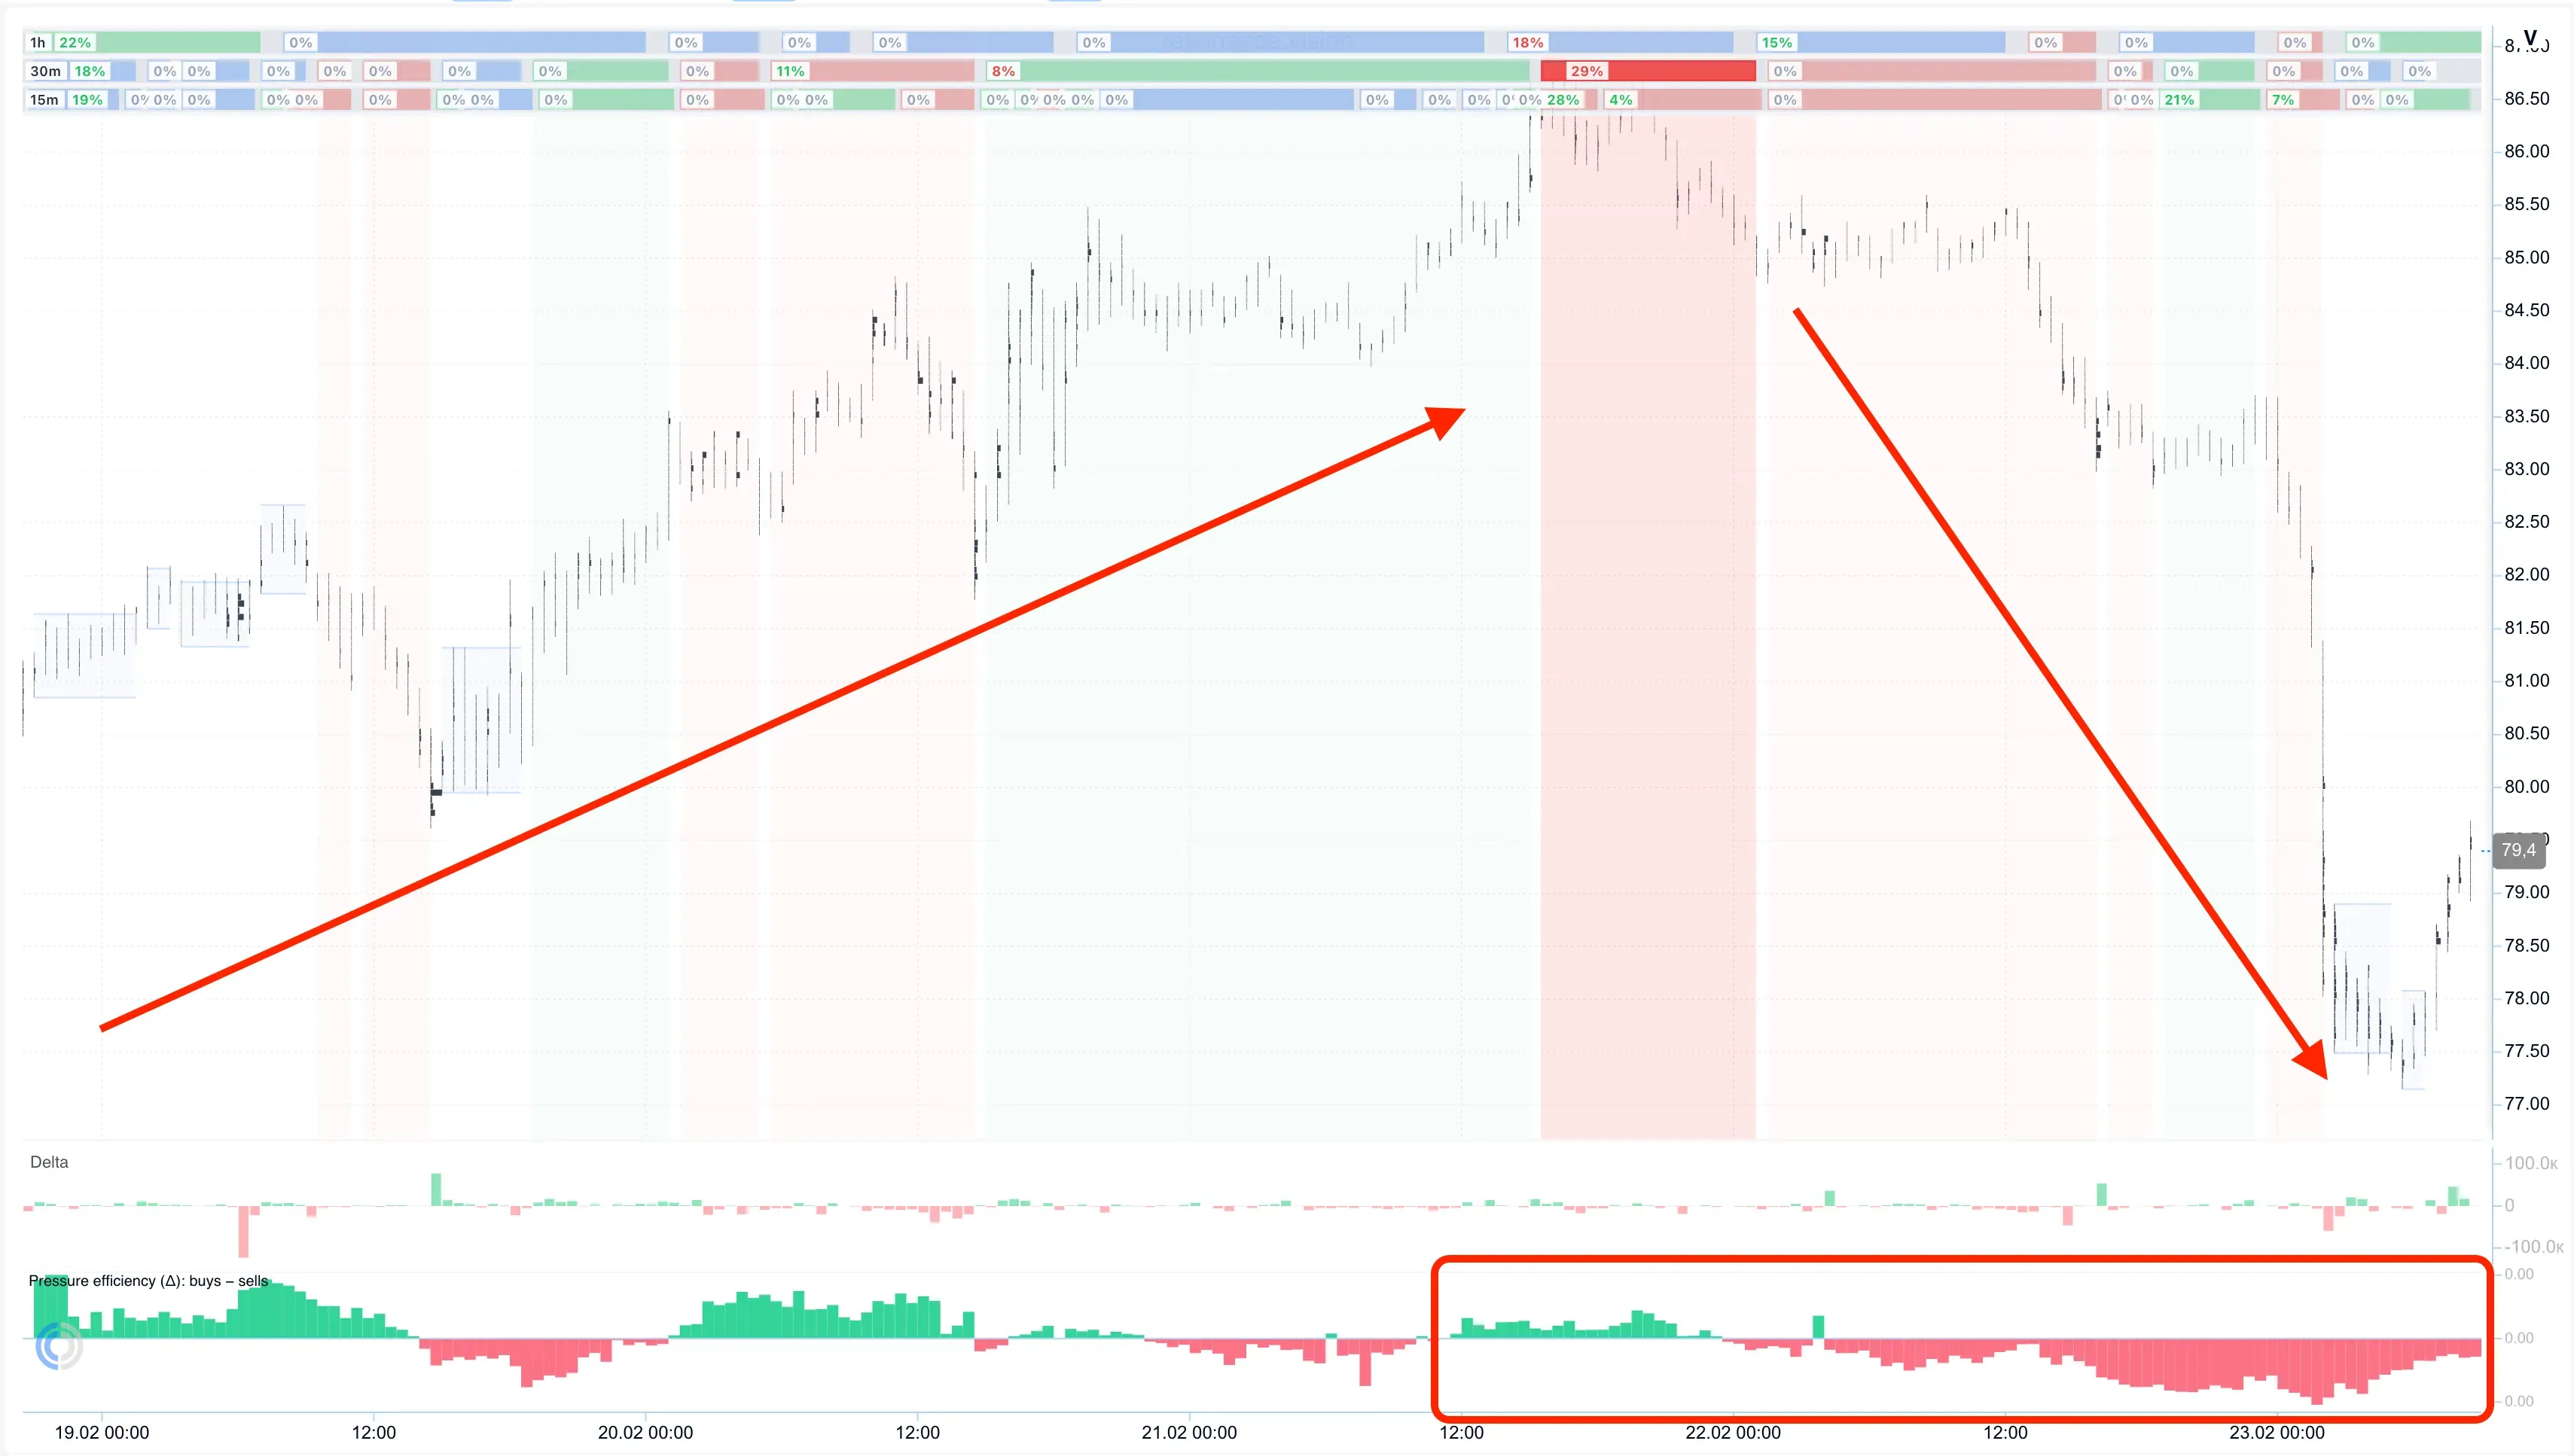
Separately, you can see whether the trend is confirmed by flow — whether
price is rising together with buyer pressure, or whether this is a rise “on
absorption” (price goes up while flow is actually weakening) — a frequent
precursor to a reversal.
Range (consolidation)
A range with an upper and a lower boundary. Inside it, what matters is not
“is price standing still,” but what volume is doing while it stands:
- someone buys quietly without pushing price up → accumulation, a deficit
is building; - someone sells quietly without pushing price down → distribution, a
surplus is building.
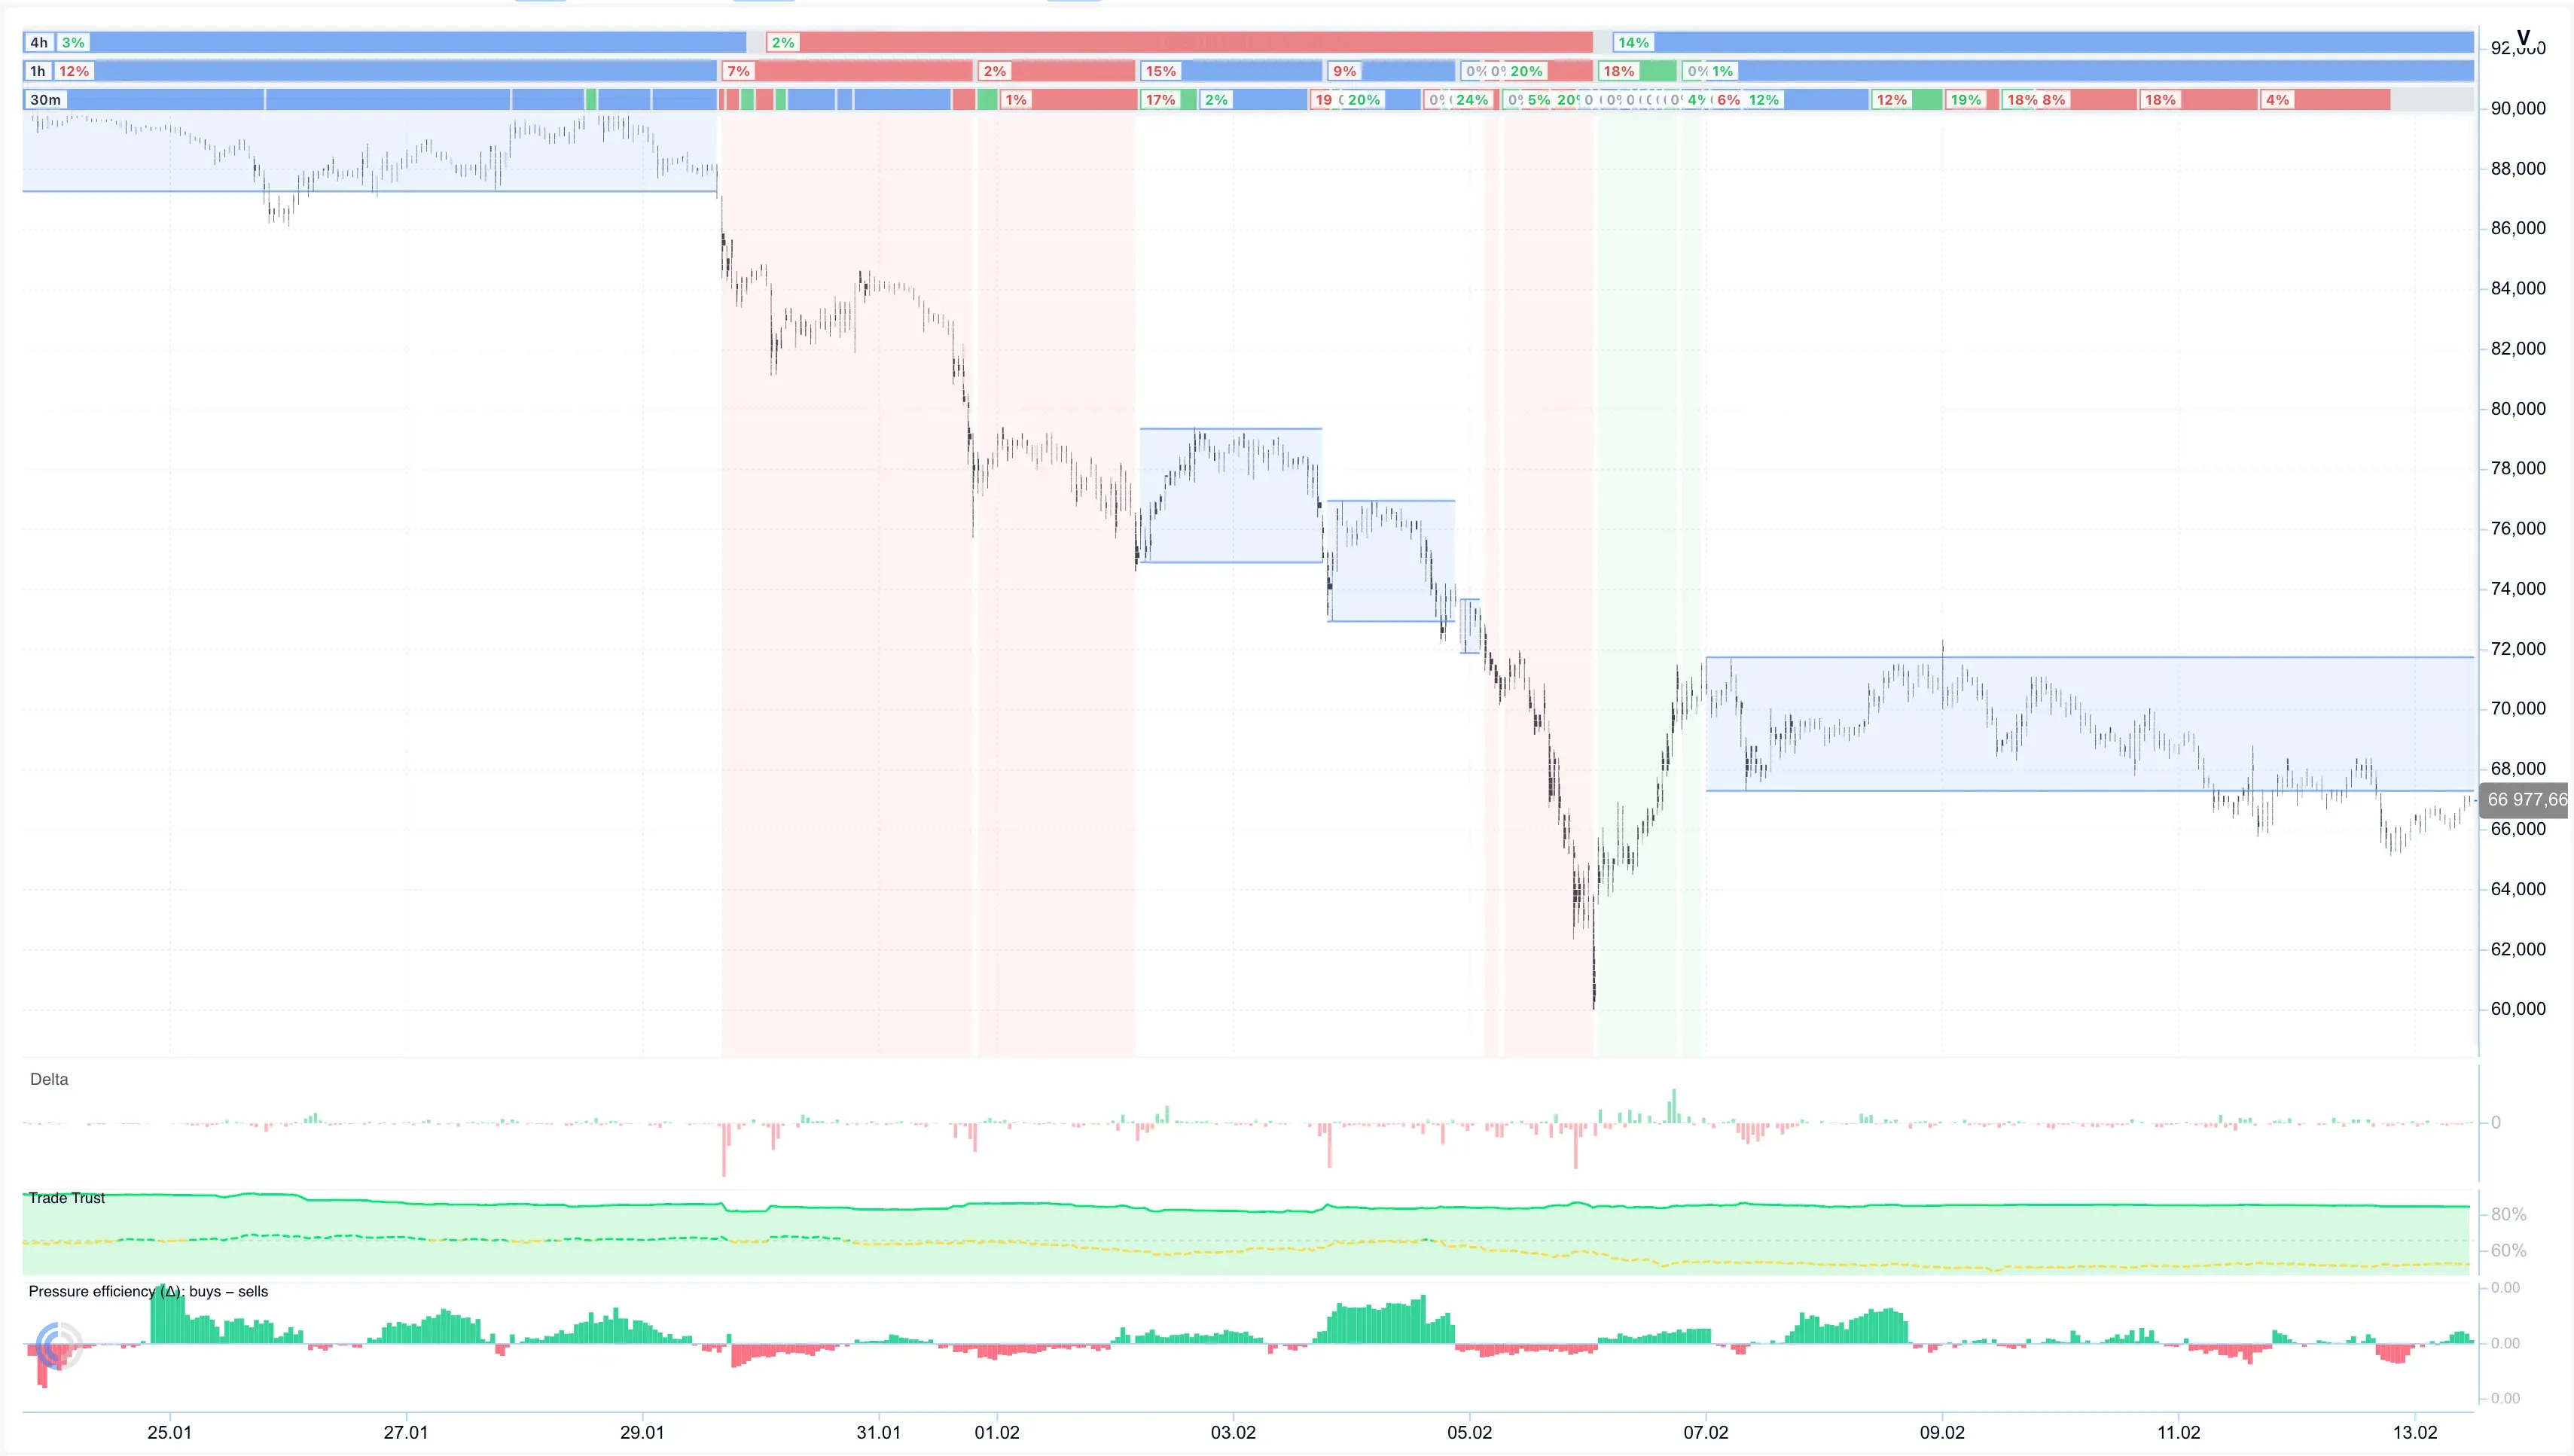
On the chart: a blue box is consolidation, a green/red background is an
up/down trend.
Event at the boundary
An event isn’t “just another range” — it’s the moment a regime is born or
changes: the start of a trend, its end, a breakout from a range. The key thing
TradeState does is check whether the event is confirmed by flow. A breakout
on volume in the direction of the move is a real breakout. A breakout without
flow support most often ends with a return into the range — that’s exactly a
fake-out, the kind that’s so easy to fall for when you look at a single bar
alone.
Example
A coin grinds inside a range for two weeks — boring at a glance, nothing
happening. But inside that range the delta is steadily positive: someone is
methodically buying up without letting price rise. TradeState marks this as
accumulation.
When price finally breaks the upper boundary of the range together with a
pickup in buying — TradeState confirms the breakout: this is a real move, the
deficit has materialized. And had the same breakout gone through without flow
support — the tool would have shown it as an unconfirmed event, and in that
situation price often quickly returns. The difference between “enter” and
“skip” is exactly this.
Where it helps in the strategy
TradeState is involved at most stages of a trade — from the first anomaly on
the chart to the decision to close a position:
| Stage | Question | TradeState’s role |
|---|---|---|
| Trigger | What did we notice? | Highlights unusual segments on the chart |
| Analysis | Deficit or surplus right now? | Period type + flow → direction of the hypothesis |
| Validation | Has confirmation arrived? | Period metrics — a numeric “yes/no” |
| Exit | Is the idea exhausted? | Reversal, regime change, divergence → time to leave |
TradeState doesn’t replace the other tools of the strategy (Screener filters,
trust in flow on a specific exchange) — it provides the structure those tools
rely on.
What TradeState does not do
Honestly, no sugarcoating:
- It doesn’t give a “buy/sell” signal — only structural context: whether
you can trust what you see on the chart. - It doesn’t work identically across all timeframes — the strategy session
uses the daily chart by default, with smaller timeframes also supported. - It doesn’t decide for you — the final call is always yours; TradeState
saves time on checking a hypothesis, it doesn’t cancel it.
How to enable
- Open the Cluster chart of the directional long-term strategy.
- In the left panel, click the TradeState button.
- Enable “Request data”.
- Enable the “Periods” and “Events” layers — that’s enough to start.
Access to some layers depends on your plan.
Try it on your own coin
Open the Cluster chart, enable TradeState on any coin from your watchlist — and
see whether there really was flow behind the latest move, or whether it was
exactly what it looked like: noise on empty volume.
Recommended articles


