Fibonacci Levels in Crypto Trading: How to Apply Them Correctly

Discover why Fibonacci levels often create only an illusion of accuracy in crypto trading. Learn what actually causes price reversals, how to avoid the trap of “perfect-looking charts,” and what tools to use instead of the Fibonacci grid to analyze real supply and demand.
Table of contents

What Are Fibonacci Levels in Trading?
Fibonacci levels are a technical analysis tool plotted on a candlestick chart after a strong upward or downward impulse. The method is based on the Fibonacci sequence, a numerical sequence in which each number is the sum of the two previous numbers. Ratios derived from that sequence are used to mark potential retracement zones where price may slow down, pause, or temporarily reverse. This is why fibonacci levels for trading still attract attention: they are easy to add to a chart and easy to read.
On a chart, the grid looks clean and structured. There is an impulse, a pullback, and several areas where price might react. That visual simplicity is one reason why fibonacci in crypto trading remains popular, especially in volatile markets where traders want a fast way to organize a chart. Many people trade using fibonacci because the grid creates the feeling that predicting the next move may become easier.
Still, the grid should not be treated as a signal to act. If you use it at all, it should function only as an attention trigger. A level may tell you where to look, but it does not show why price should react there. It does not reveal whether there is real demand, real supply, or meaningful participant activity in that zone.
Why Fibonacci Looks Convincing
At first glance, the method looks convincing. Price makes a correction, touches one of the levels, slows down, and traders say the level worked. This is exactly how trust in the tool is formed. The problem is that a standard grid contains several lines, and during a normal correction price will often touch at least one of them. In a volatile crypto market, that happens even more often.
Because of that, traders start believing the grid helps with predicting reversals, while in many cases it is simply marking a pause that could have happened anyway. The pattern looks persuasive, but the pattern itself does not prove cause and effect. After the move is over, the same chart can be redrawn to make the reaction look even cleaner, which is why the method often appears stronger in hindsight than in live trading.
Selective perception makes the effect even stronger. Traders remember the examples where price reacted near a level and forget the many cases where price sliced through those lines without hesitation. As a result, Fibonacci can seem more accurate than it really is.
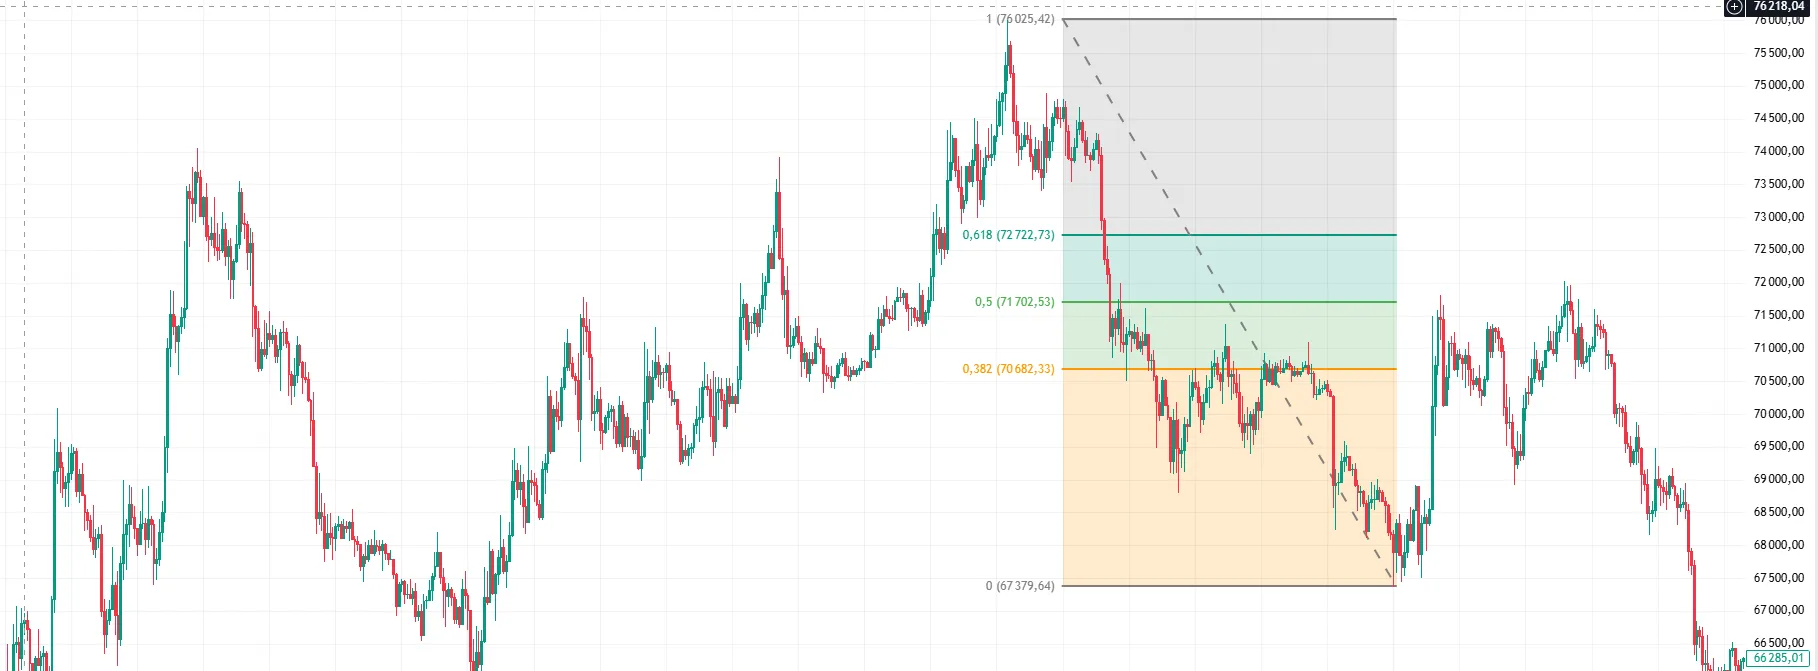
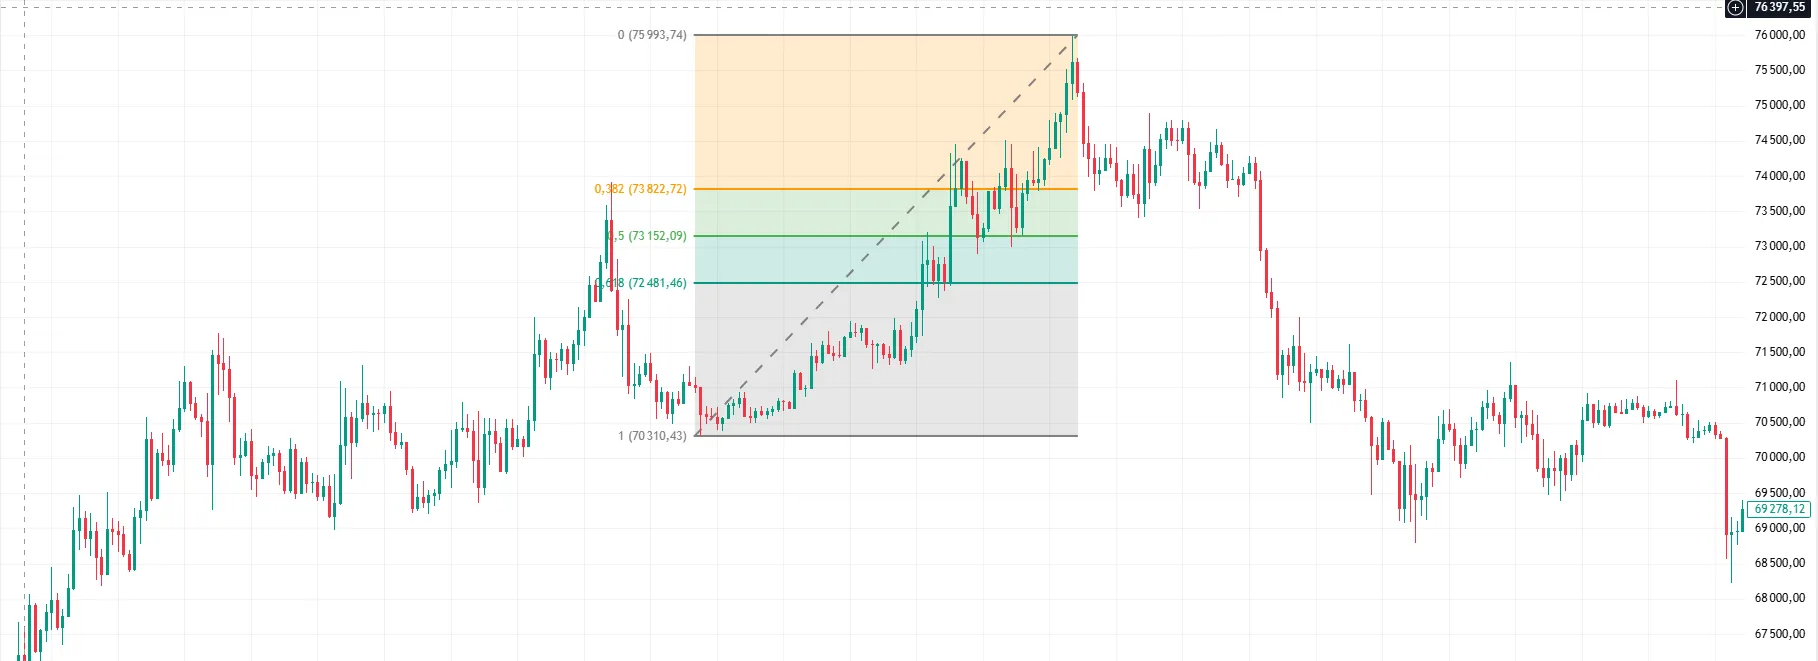
A Practical Example
Let’s look at the cryptocurrency that has just made a strong upward impulse and then begins a correction. Many traders immediately add a Fibonacci grid to the chart and mark a possible reaction zone. In that sense, the grid works only as a visual marker, not as proof of anything.
Now look deeper. On the cluster chart, you see market sell orders entering the zone. Selling pressure is present. But price stops falling. The pressure is there, yet there is no result. On the heatmap, you can see dense buy limits absorbing those sell orders. That is the actual signal.
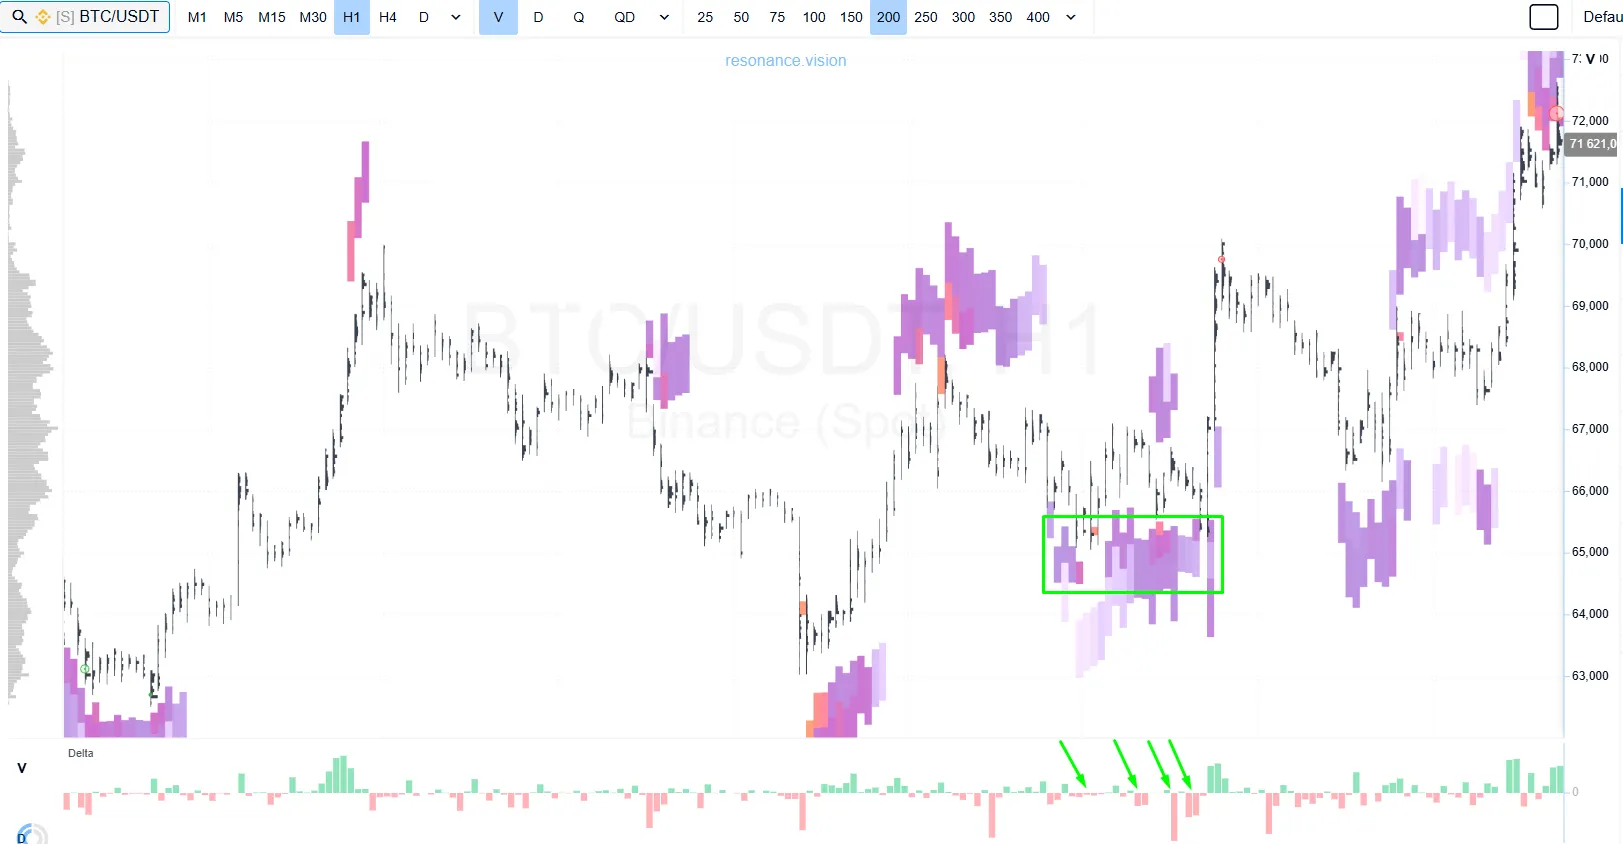
This is the crucial difference. The local low does not form because the graph touched a Fibonacci level. It forms because a buyer stepped in and absorbed supply. The level may coincide with that area, but the level is not the reason. Order flow is the reason.
This is exactly why fibonacci levels for trading should be treated only as a secondary tool. They may highlight a zone worth watching, but the decision itself should come from market mechanics. That is true in swing trading and equally true in intraday trading, where speed matters and false reactions are common.
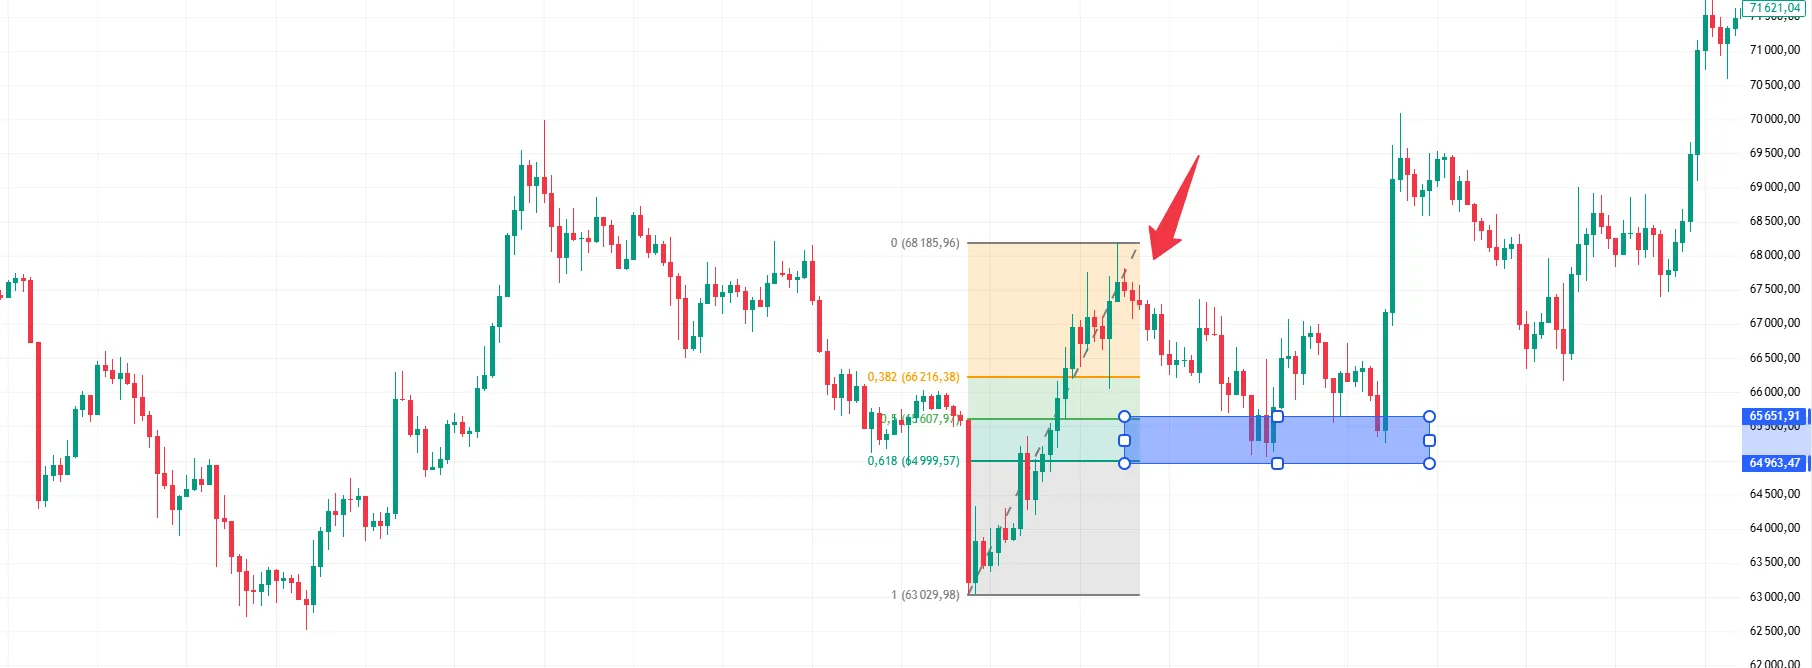
Now let’s look at the opposite case — a setup where fibonacci levels for trading did not provide a usable signal.
We can see a strong bullish impulse on the chart. As always in trading, no market moves up forever, just as no market falls forever. A correction begins, and many traders who trade using fibonacci would expect price to continue higher from one of the “key” retracement zones.
But that is not what happened here.
Price did not resume the uptrend from any major Fibonacci level. On the heatmap, there were no large clusters of buy limit orders in that area. There was no meaningful support, no visible absorption, and no serious attempt to reclaim the zone. Price simply moved through the Fibonacci lines.
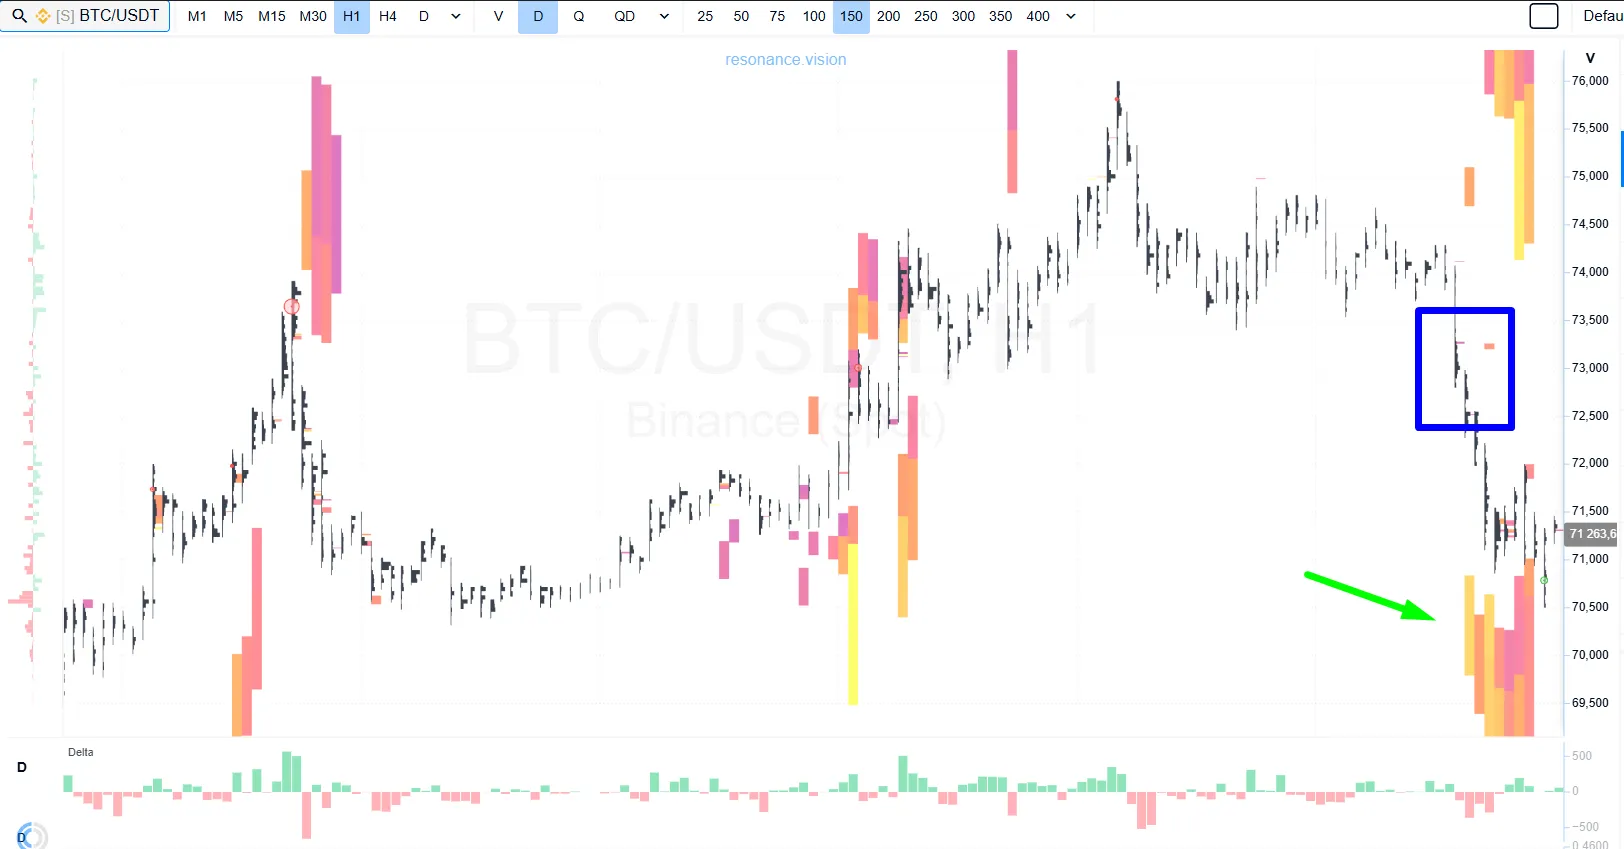
This example shows the main weakness of fibonacci in crypto trading. The grid may look structured on a graph, but structure alone is not enough for predicting a reversal. The Fibonacci sequence does not explain why price should turn. It only places several possible reaction zones on the chart, and during a correction price may pause near one of them by coincidence.
From the perspective of market mechanics, the message is straightforward: no buyer appeared at the levels, so the levels had no real weight. That is why a fibonacci trading strategy built only on a price pattern remains weak, especially in volatile crypto and intraday trading conditions.
The practical conclusion is simple: traders may still use the grid as a secondary visual tool, but it should never replace supply-and-demand analysis. If there is no reaction in volume, no limit support, and no sign of participant interest, the level itself gives no solid basis for predicting the next move in a cryptocurrency.
Why Fibonacci Levels Do Not Provide an Edge
The core issue is simple: Fibonacci levels do not create market mechanics. They do not create demand, supply, or liquidity. If you remove the grid from the chart, the market will continue to move according to the same forces as before. That is why a correction does not end because price touched 0.382, 0.5, or 0.618. It ends because a participant stepped in, aggressive selling was absorbed, or buyers regained control.
This is also why a fibonacci trading strategy rarely delivers a stable edge when it relies only on price. A chart without order-flow context shows the result, not the cause. It can help with describing the move, but it is weak for predicting what should happen next. That limitation becomes even clearer on an intraday chart, where price reacts quickly and false signals are common.
The same level can produce completely different outcomes. In one case price bounces. In another it breaks straight through. In a third it makes a false break and quickly returns. If the same level can lead to opposite results, then the level itself is not the cause. The real cause must be found deeper.
What Matters More Than Fibonacci
Even if a trader continues to use the grid, it should never be the basis for entry. A better strategy is to treat it as chart markup and then study what is actually happening through supply-and-demand analysis.
First comes market context. Is the market building a deficit, realizing demand, moving into consolidation, or searching for balance after an impulse? This context matters far more than any Fibonacci-based setup.
Second comes the reaction of price to volume. Is there real activity in the zone? Does aggressive selling push price lower? Do market buys produce continuation? Is there a result? These questions matter because they move analysis away from predicting reactions by geometric ratios and toward reading real participation.
Third comes cluster analysis, delta, and the heatmap of limit orders. A standard tool cannot show this depth if it only relies on price. A cluster chart can show that market sell orders are hitting the bid, yet price is no longer falling. Delta can show who is attacking. The heatmap can show whether a limit buyer is actually absorbing that pressure. This is where the market starts to make sense.
Only the imbalance of supply and demand matters in trading. The rest is secondary.
Common Mistakes When Traders Use Fibonacci
The first mistake is waiting for a reaction in advance. A trader sees a level, places a limit order, and assumes the zone already provides an edge. But if there is no real participant interest there, the entry is still just a bet on coincidence.
The second mistake is treating the level as a signal. This is where many traders begin to trade using fibonacci as if the grid itself could explain the move. It cannot. The grid is only markup.
The third mistake is ignoring volume. Without volume analysis, you cannot know whether the market is likely to continue, stall, or reverse. Price does not move on its own. It moves because real orders hit the market.
Another mistake is ignoring market state. If you do not understand whether the market is trending, distributing, or chopping sideways, the same Fibonacci setup can be interpreted in completely different ways. This is especially dangerous in fast-moving crypto markets.
And finally, there is hindsight fitting. After the move happens, the grid almost always looks convincing. But the job of a trader is not to explain the past nicely. The job is to make a decision before the outcome is obvious.
Conclusion
Fibonacci levels should not be given serious weight in market analysis. If you use them, keep them as an attention trigger, not a signal to act. They can organize a chart, but they do not provide the reason for an entry.
Their apparent accuracy is often not a pattern but a coincidence. There are enough levels inside the grid for price to pause somewhere during a correction. After that, it is easy to think the tool worked. But from the perspective of market mechanics, that proves very little.
The focus should be on supply and demand, on the behavior of market and limit participants, and on the reaction of price to volume. That is what explains why a cryptocurrency stopped, reversed, or continued moving.
This approach treats Fibonacci as a secondary tool, not as a complete strategy, and it shifts the graph-based discussion back to actual market mechanics. That matters for any cryptocurrency, not just Bitcoin. The goal is not predicting reactions from a geometric sequence on a chart. The goal is understanding what participants are actually doing in real time.
Follow new insights in our telegram channel.
No need to invent complex schemes and look for the "grail". Use the Resonance platform tools.
Register via the link — get a bonus and start earning:
OKX | BingX | KuCoin.
Promo code TOPBLOG gives you a 10% discount on any Resonance tariff plan.
Recommended articles


