Pairs Trading: A Market Direction-Neutral Strategy

Can you profit without guessing where the market will go next? Pair trading offers a different approach: instead of betting on a rise or a fall, it works with statistical divergences between two related assets. In this article, we explain why this logic looks especially compelling on the digital-asset market, where volatility often creates opportunities where most traders see only chaos, and why many participants use it to trade crypto pairs on an intraday basis.
Table of contents
- 01What Is Market-Neutral Trading?
- 02What Is Pair Trading
- 03Pairs Trading Strategy in Crypto
- 04What the Pairs Trading Strategy Is Based On (A Quantitative Approach)
- 05Which Crypto Pairs Work Best for the Strategy
- 06Why the Crypto Market Works Well for Pair Arbitrage
- 07Mathematics Is Not Enough: How to Confirm the Idea
- 08When a Market-Neutral Strategy Stops Being Neutral
- 09Tools for Implementation
- 10Practical Case: Search and Execution
- 11Stage 1: Workspace setup and filtering
- 12Stage 2: Correlation and volatility analysis
- 13Stage 3: Forming and executing the idea
- 14Stage 4: Trade management and exit
- 15Who Pair Trading Is For
- 16Conclusion: A New Stage of Professionalism

What Is Market-Neutral Trading?
In traditional directional trading, a trader’s result is inseparably linked to the market’s overall vector: if you open a long, you need the asset to rise, and any market decline automatically drags your position down. A market-neutral approach in the context of statistical arbitrage is an approach in which the result depends not on guessing the market’s direction but on the divergence and subsequent convergence of prices in two interrelated assets.
The core idea lies in fully or partially neutralizing market noise. For this kind of trade, the broader market direction becomes less critical: what matters more is how the relative strength of two assets changes inside one idea. Profit is extracted from the dynamics of price changes in two correlated assets relative to each other. In essence, such a structure partially hedges market risk: weakness on one side of the trade can be offset by the result on the other. It is a way to profit from statistical patterns without depending on where the rest of the market is racing at a given moment.
What Is Pair Trading
The essence of the method lies in opening positions in two correlated assets at the same time after their dynamics have diverged. Such instruments share a common fundamental basis, which is why they tend to react to capital flows in their niche and to market cycles in a similar way.
Instead of forecasting absolute value, trading here focuses on the cross rate, the ratio between the prices of two selected coins.
For reference: Absolute value is the price of an asset in dollars (for example, BTC at $65,000). In classical trading, traders try to predict whether that number itself will rise. In pair trading, the standalone dollar price of a cryptocurrency does not matter to us; what matters is how one coin is priced relative to another.
At the moment of an abnormal deviation in the cross rate, the trader opens two positions, one long and one short, expecting the pair to return to its average value: they sell the asset showing weakness and buy the stronger one. The goal of such a trade is to profit from prices returning to their calculated mean. In this way, profit is generated not by the direction of the entire market but by the restoration of balance inside a specific pair. Profit is taken when the statistical deviation is eliminated, liquidity inside the sector is redistributed, and cryptocurrency pairs return to their more typical relative behavior.

Pairs Trading Strategy in Crypto
On the crypto market, this approach works especially well thanks to clear sector structure and the constant redistribution of liquidity between closely related assets. The pairs trading strategy works most logically inside one sector, where assets are linked by common liquidity flows, a similar reaction to the market backdrop, and high historical correlation.
What the Pairs Trading Strategy Is Based On (A Quantitative Approach)
The paired approach does not eliminate decision-making, but it moves it into the realm of data and calculations. At its core lies a quantitative method of analysis that helps determine whether the relationship between assets is statistically stable. The key metrics here are correlation, the degree to which movements are synchronized, and Z-Score, a statistical indicator that measures how far the current price has deviated from its average value and points to the probability of a return to that average.
To determine an entry point, a professional trader uses the Z-Score indicator. It shows how many standard deviations the current cross rate has moved away from the norm. When Z-Score reaches extreme values, it points to an abnormal widening of the spread and increases the probability of its subsequent convergence.
Which Crypto Pairs Work Best for the Strategy
To trade crypto pairs effectively, continuous monitoring and regular asset screening are essential. The market is dynamic: yesterday’s correlation leaders can permanently diverge today because of changing fundamental factors. That is why the method implies the regular analysis of dozens of relationships inside sectors.
What should you pay attention to when choosing?
- Sector affiliation: the best pairs are the ones inside one direction—meme coins, AI tokens, L2 solutions, and other assets that are close in logic and business model.
- Liquidity: it is important that both assets have sufficient trading volume. In low-liquidity pairs, slippage can eat up all the potential profit from cross-rate convergence.
- Stability of the relationship: it is necessary to filter out pairs in which the spread break is caused by irreversible events, such as a hack, a delisting, or regulatory problems.
Constant screening and filtering make it possible to select only those coins in which analysis shows a statistical deviation rather than a structural break in the relationship between projects.
Why the Crypto Market Works Well for Pair Arbitrage
Unlike the stock market, the crypto market is characterized by a high degree of liquidity fragmentation and asymmetry in capital flows. This creates highly favorable conditions for statistical arbitrage. When a large buyer enters a sector, capital is rarely distributed evenly: one asset is “pumped” first, creating momentum, while other coins in the same group react with a delay.
These local market inefficiencies are the main source of opportunity for the method. The high volatility for which cryptocurrency is known ensures frequent and deep spread divergences. Where a conservative equity market may require weeks for a deviation to appear, related coin pairs can provide quality entry points much more often. For a pair trader, high volatility is a source of opportunity, but only if analysis confirms that the relationship between the assets has not been destroyed. In the best conditions, that can even support intraday execution.

Mathematics Is Not Enough: How to Confirm the Idea
A statistical signal by itself does not replace market analysis, especially during periods of sharp market moves. A spread anomaly is not always an entry signal. It is important to understand whether the divergence is caused by a temporary imbalance that will soon lead to the restoration of price parity or whether it is a fundamental break in the relationship between the assets.
If one coin in the pair starts falling for no visible reason while the other stands still, this may be a sign of a correlation violation in which the statistical relationship between the assets stops working. In such cases, the relationship between the assets breaks, and the cross rate may never return to its previous average values. Opening a trade in such a situation means making the classic mistake of “catching falling knives” in the hope of a return that will not come.
Before trusting the Z-Score figures, you need to make sure that:
- The relationship is preserved: correlation between the assets remains high even against the background of the current divergence.
- The reason lies in liquidity rather than in structure: the divergence should be explained by a local transfer of capital inside the sector, not by a separate problem in a specific project.
When a Market-Neutral Strategy Stops Being Neutral
The main trap of statistical arbitrage lies in the false sense of safety, as if long/short automatically makes a position neutral. Market neutrality is lost when an imbalance appears in position sizes, because in that case the trade result starts to depend on the sector’s overall dynamics rather than on the difference in strength between specific assets. Many traders make the mistake of opening a long and a short for the same dollar amount while forgetting about the different volatility of the assets.
For a market-neutral strategy to actually reduce dependence on the market’s overall movement, it is important to maintain beta neutrality when calculating position size. If one coin in the pair is twice as volatile as the other, then the position in the “calmer” asset should be proportionally larger in order to compensate for the fluctuations of the “more aggressive” one.
If you buy a more volatile asset for the same amount for which you sell a calmer and more liquid asset, the position will retain a directional bias and will stop being neutral in terms of risk. In such a situation, during a sharp market move you will get a loss that will not be fully offset by profit on the other side of the trade, and your neutral strategy will turn into an ordinary directional position with elevated risk.

Tools for Implementation
Effective trading with this method requires specialized analytical tools capable of calculating statistical deviations in real time. The Resonance platform improves the analysis of suitable relationships, removes the need for complex calculations, and helps filter out weak ideas faster through a more transparent selection algorithm.
In our work, we use the platform’s key tools:
- Market Delta: our main analytical hub. Here, correlation indicators, beta coefficients, and the current statistical deviation between assets are tracked in real time.
- The Z-Score indicator: it visualizes the degree to which the spread deviates from its average value. When the line enters extreme zones, it points to an abnormal statistical divergence between coins and becomes a trigger for deeper pair analysis.
Using these tools turns statistical arbitrage from a complex theory into a clear analytical process in which every decision is backed by the platform’s figures and calculations. This workflow is especially useful when you need a consistent intraday process.
Practical Case: Search and Execution
So that theory does not drift away from practice, let us look at a step-by-step algorithm for finding a trading setup on the Resonance platform. In this example, we focus on the meme-coin sector using the Market Delta tool.
Stage 1: Workspace setup and filtering
Before searching for anomalies, it is necessary to prepare the analytical environment. The setup process includes 8 key steps, according to the labels on the screenshots:
- Choosing the “Tickers” tab (No. 1) as the main hub for working with quotes.
- Visualization (No. 2): enabling price charts and Z-Score to track statistical deviations.
- Choosing a trading pair (No. 3): using the */USDT mask to analyze assets against a specific stablecoin.
- Choosing an exchange (No. 4): setting the filter for the venue where execution is planned.
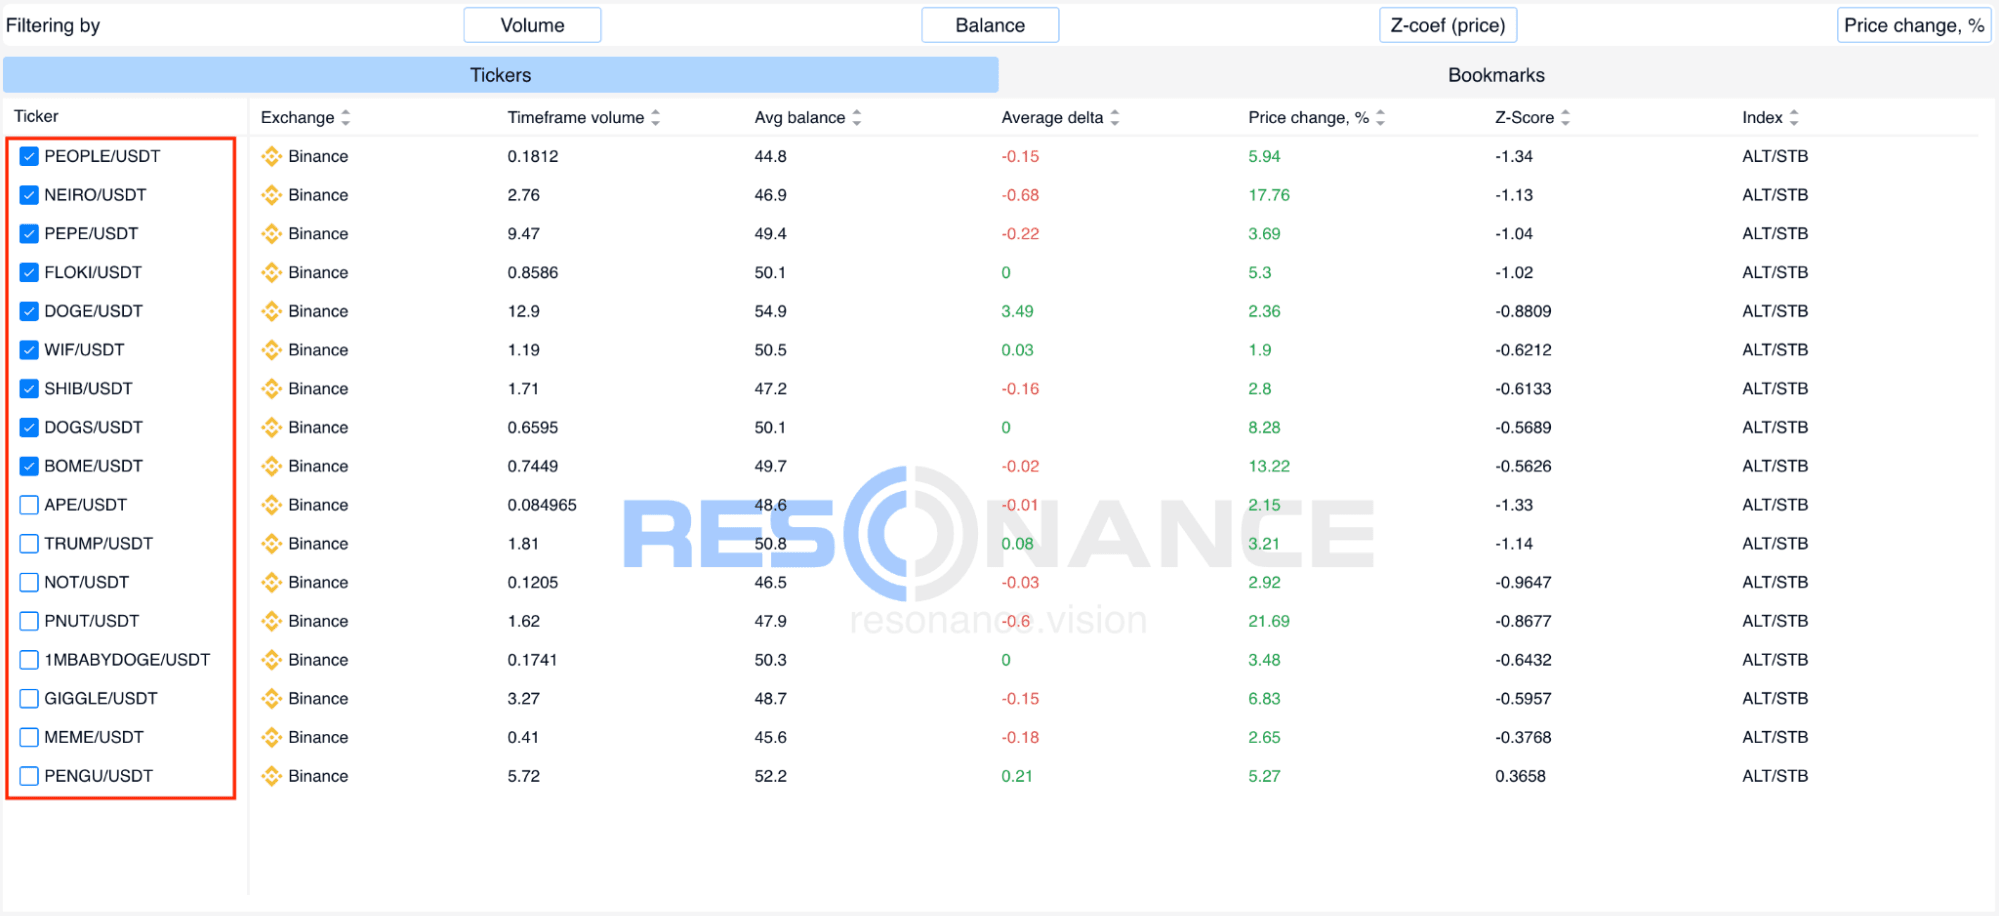
- Index (No. 5): selecting ALT/STB for correct comparison of altcoins.
- Category (No. 6): narrowing the search to the sector used in the example, the “Memes” sector.
- Time frame (No. 7): we set M30 for intraday and medium-term analysis.
- Averaging period (No. 8): setting the value to one month in order to form a relevant comparison base.
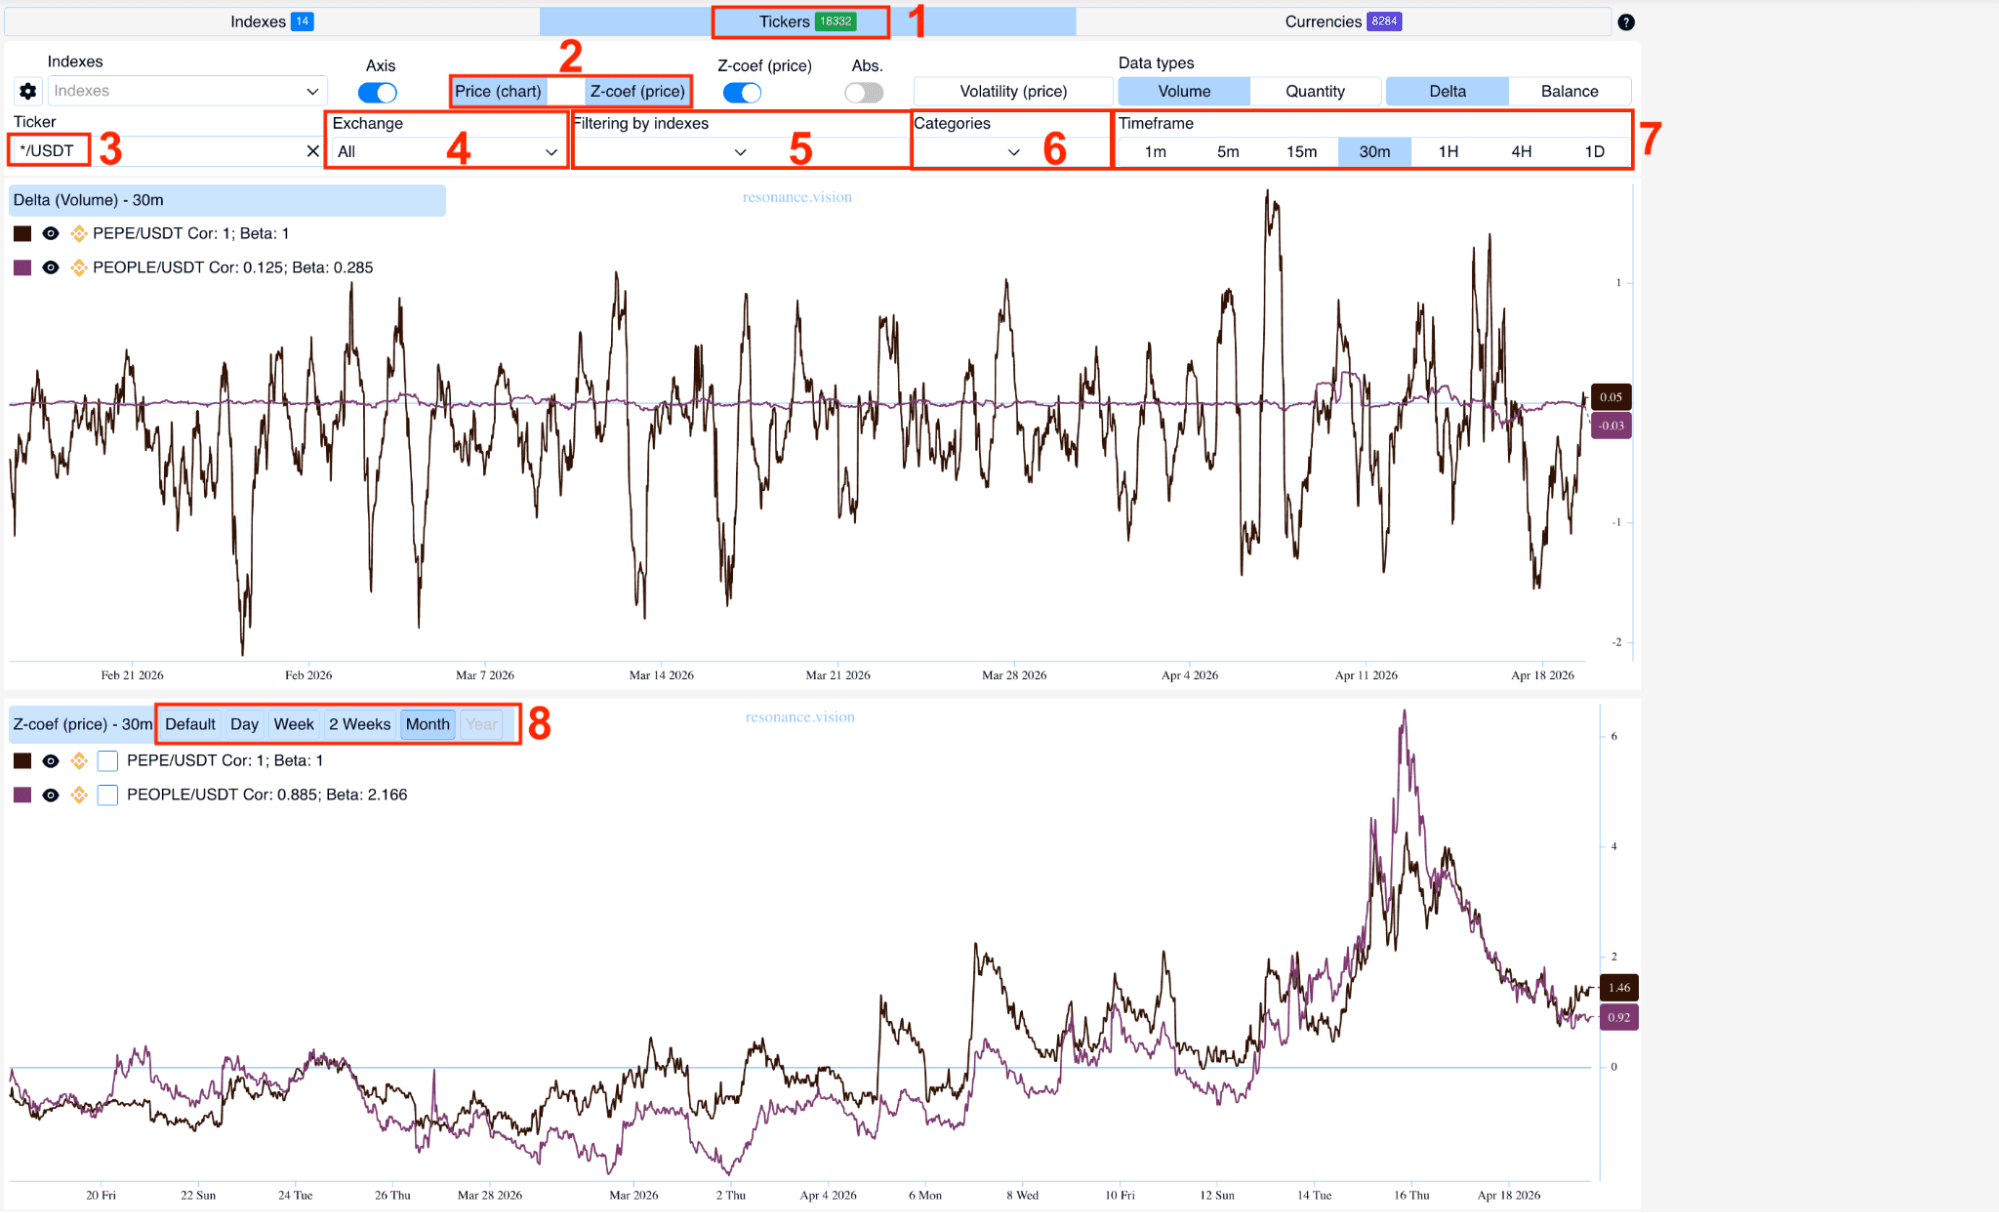
After the setup, we add assets to the chart in order to build the cross rate; the platform allows up to 10 pairs to be analyzed simultaneously inside one working algorithm.
Stage 2: Correlation and volatility analysis
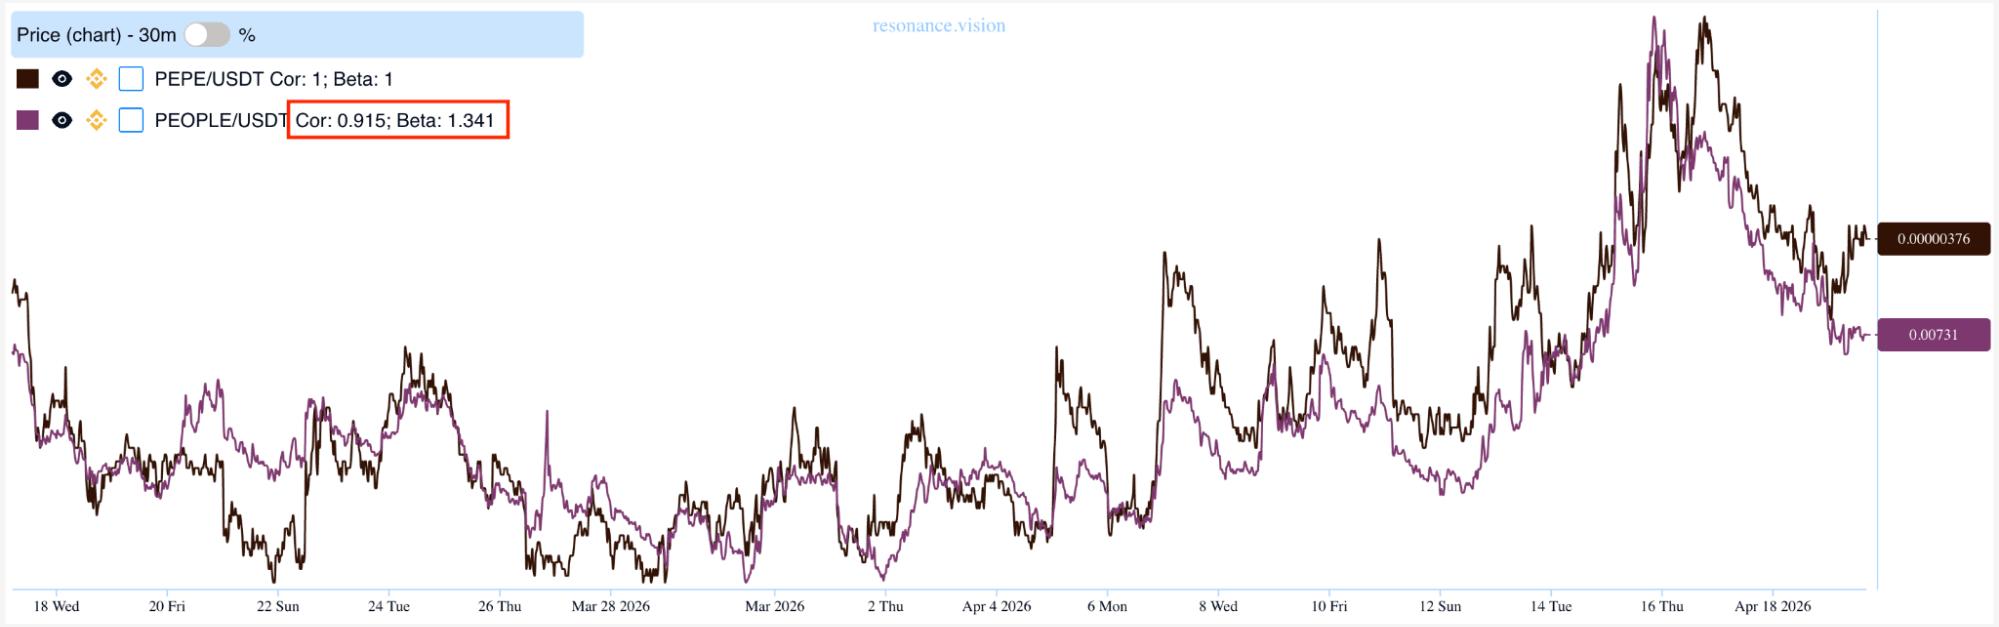
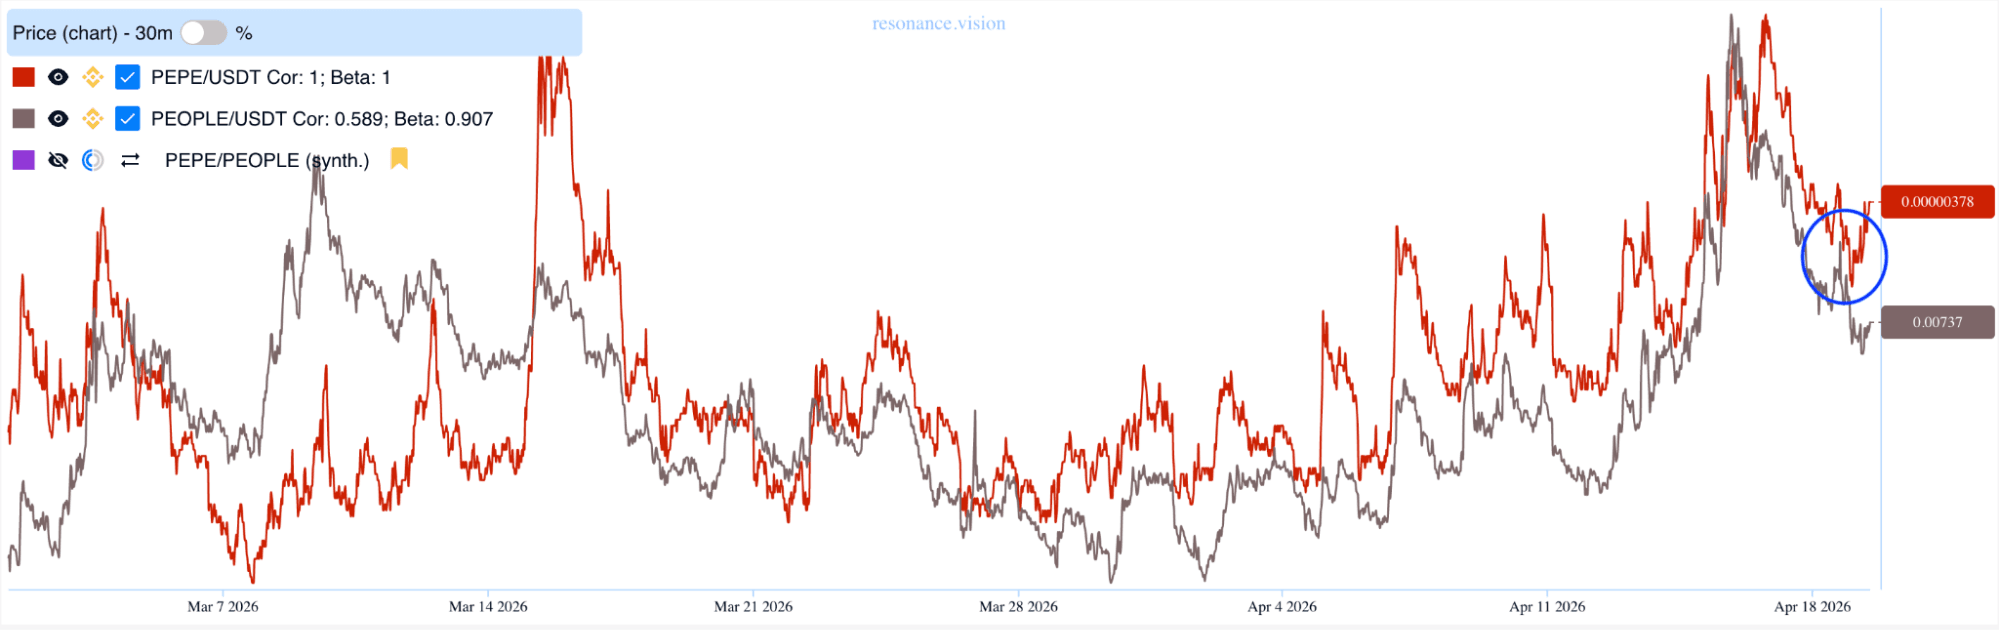
Before forming the cross rate, it is critically important to evaluate two parameters, marked with a red rectangle:
- COR (Correlation): we look for a reading of approximately above 0.7. This confirms that the assets move in sync and that the probability of their convergence after the divergence is high.
- BETA: it shows relative volatility. If beta equals 1.5, that means that for a 1% move in the base asset, the pair responds with a 1.5% move. These data are necessary for the correct calculation of position size so that the trade remains market-neutral.
Stage 3: Forming and executing the idea
After reviewing dozens of combinations, I chose the PEPE/USDT and PEOPLE/USDT pair. Their correlation and beta readings met the required criteria, as marked by the rectangle in the screenshot below.
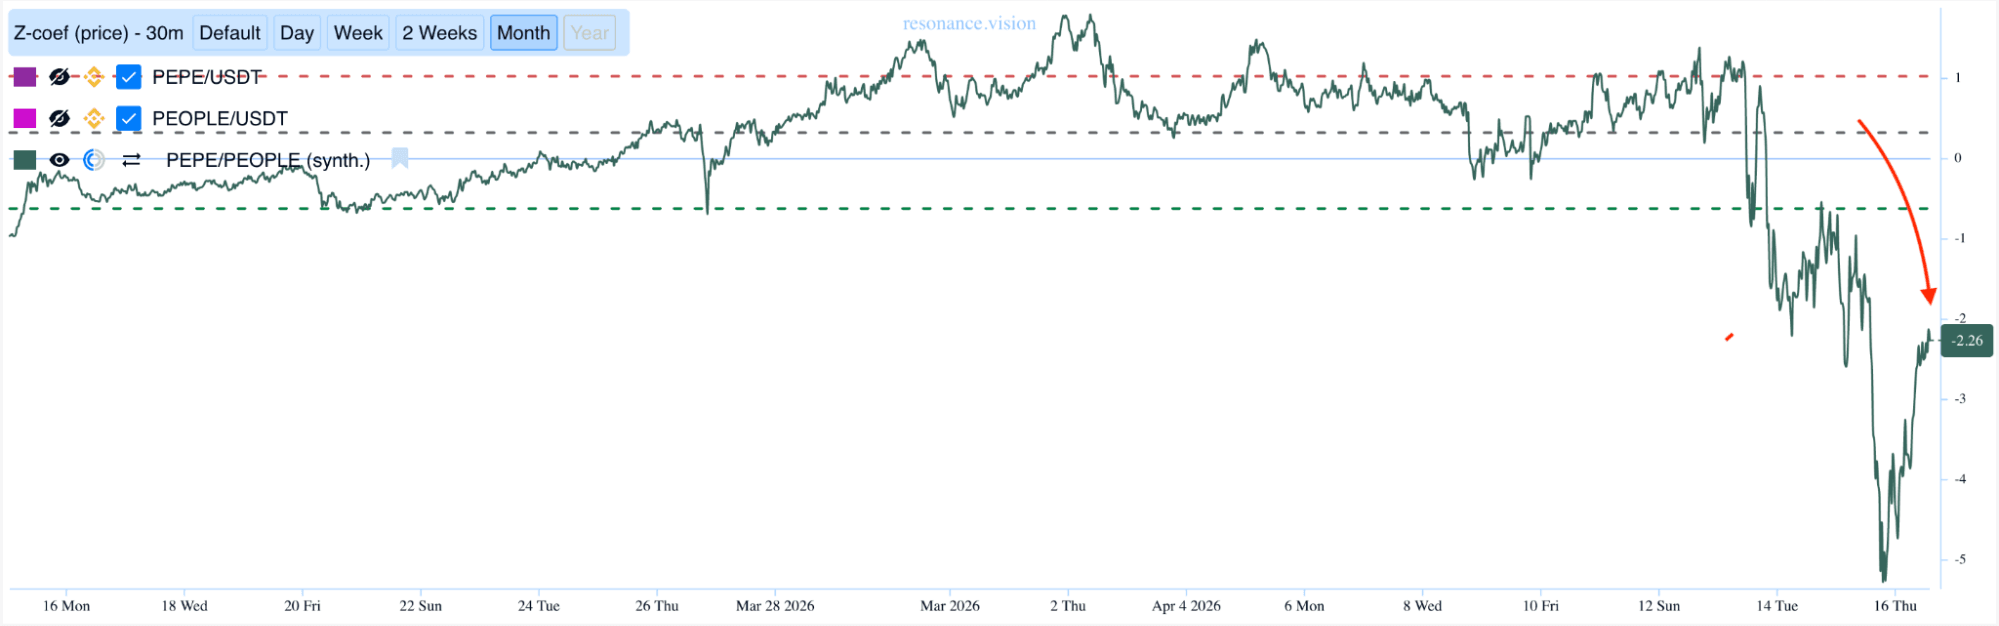
A divergence between the assets was clearly recorded on the chart: the price of PEPE moved higher, while PEOPLE did not show the same growth, as indicated by the curved arrow.
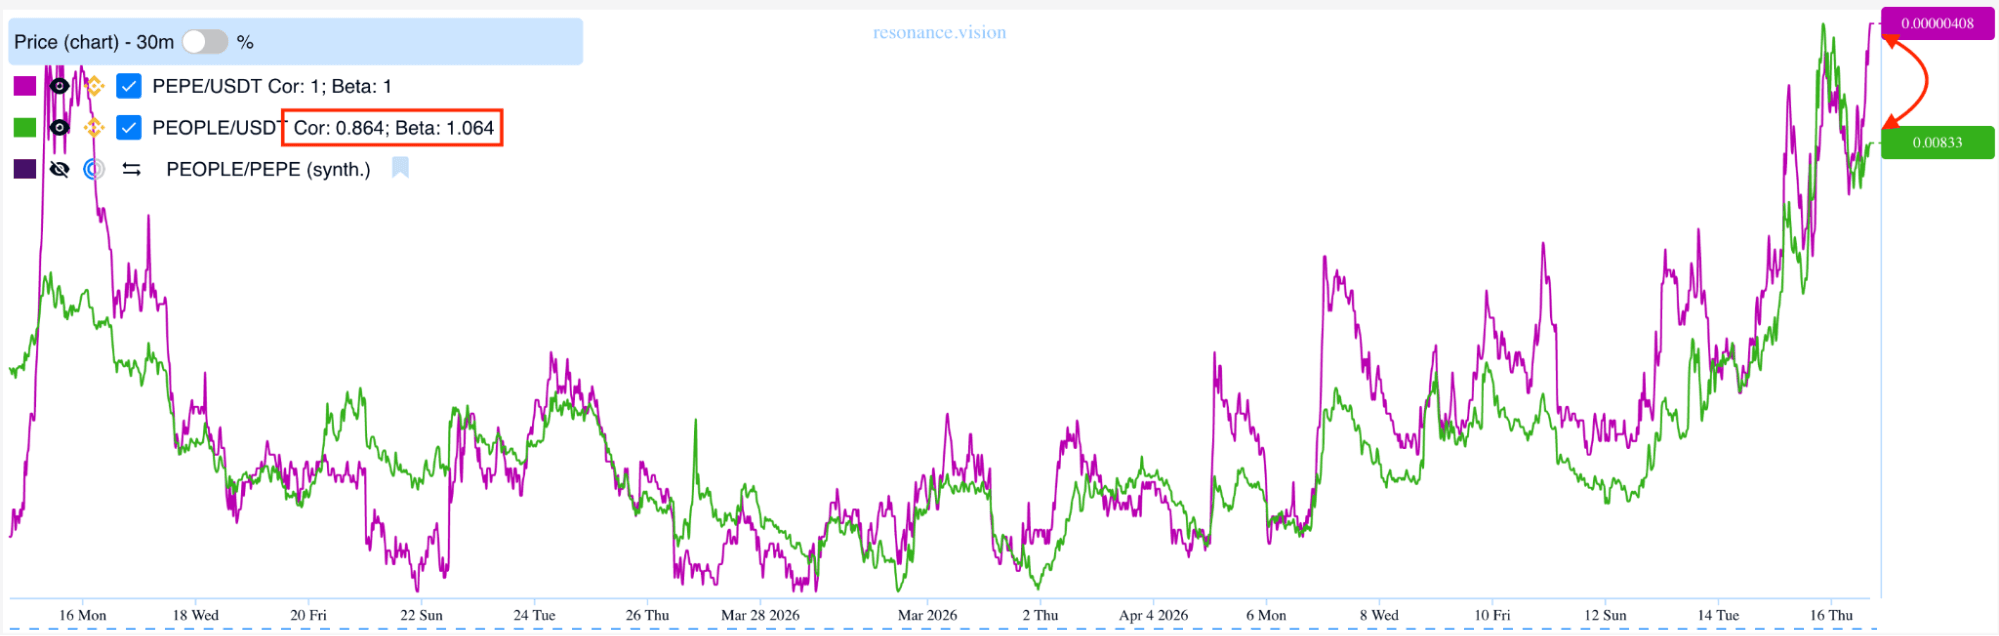
At the same time, the cross rate was in the zone of abnormal values: Z-Score showed a pronounced statistical deviation of -2.26 in favor of a long on PEPE/USDT and a short on PEOPLE/USDT, which increased the probability of subsequent convergence.
Stage 4: Trade management and exit
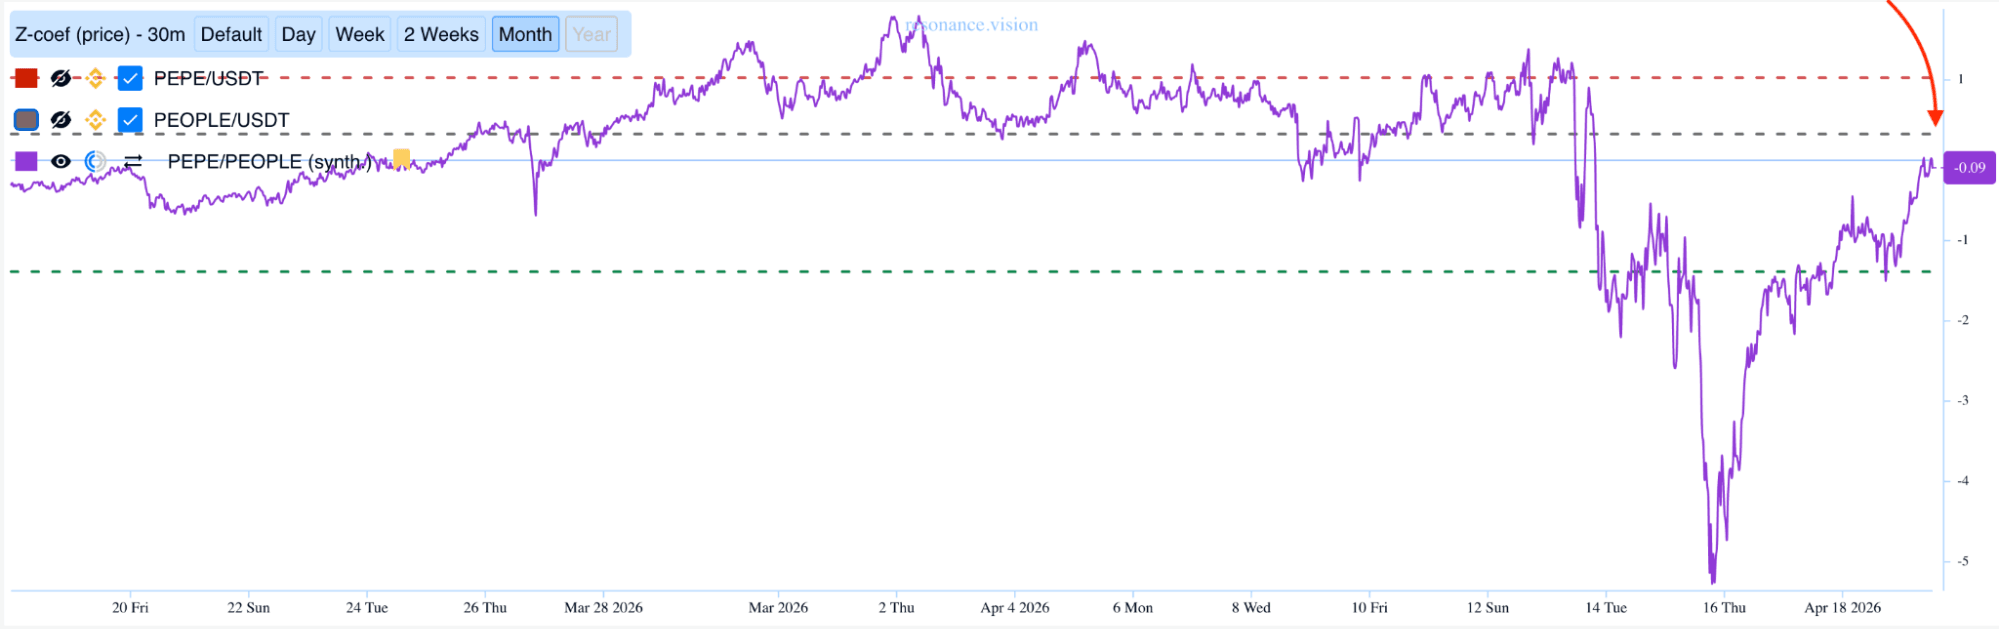
Any method requires a clear exit plan. The main guide for taking profit is the convergence of prices or the return of the cross-rate line to values close to 0.
However, it is important to remember the risks: the divergence may continue longer than expected. In such a case, according to risk management, the trader must decide either to increase the position, averaging in at more favorable Z-Score values, or to close the trade if the fundamental relationship between the assets is broken. This means that the trader is obliged to lock in a loss without waiting for the cross rate to expand endlessly.
In this case, the positions were closed when two factors were confirmed at the same time:
- Convergence: the price divergence between the assets was fully neutralized, and the chart began to show movement in the opposite direction.
- Statistical return: the Z-Score indicator returned from the extreme zone to values near zero, which statistically meant that the potential of this trade had been exhausted.
Final trade result: since the work was done with volatile meme coins, it is important to clarify separately that the result below is the result of the legs of the position rather than the return on the entire deposit.
- For the PEOPLE/USDT position, a short position, a profit of +567.64% was recorded.
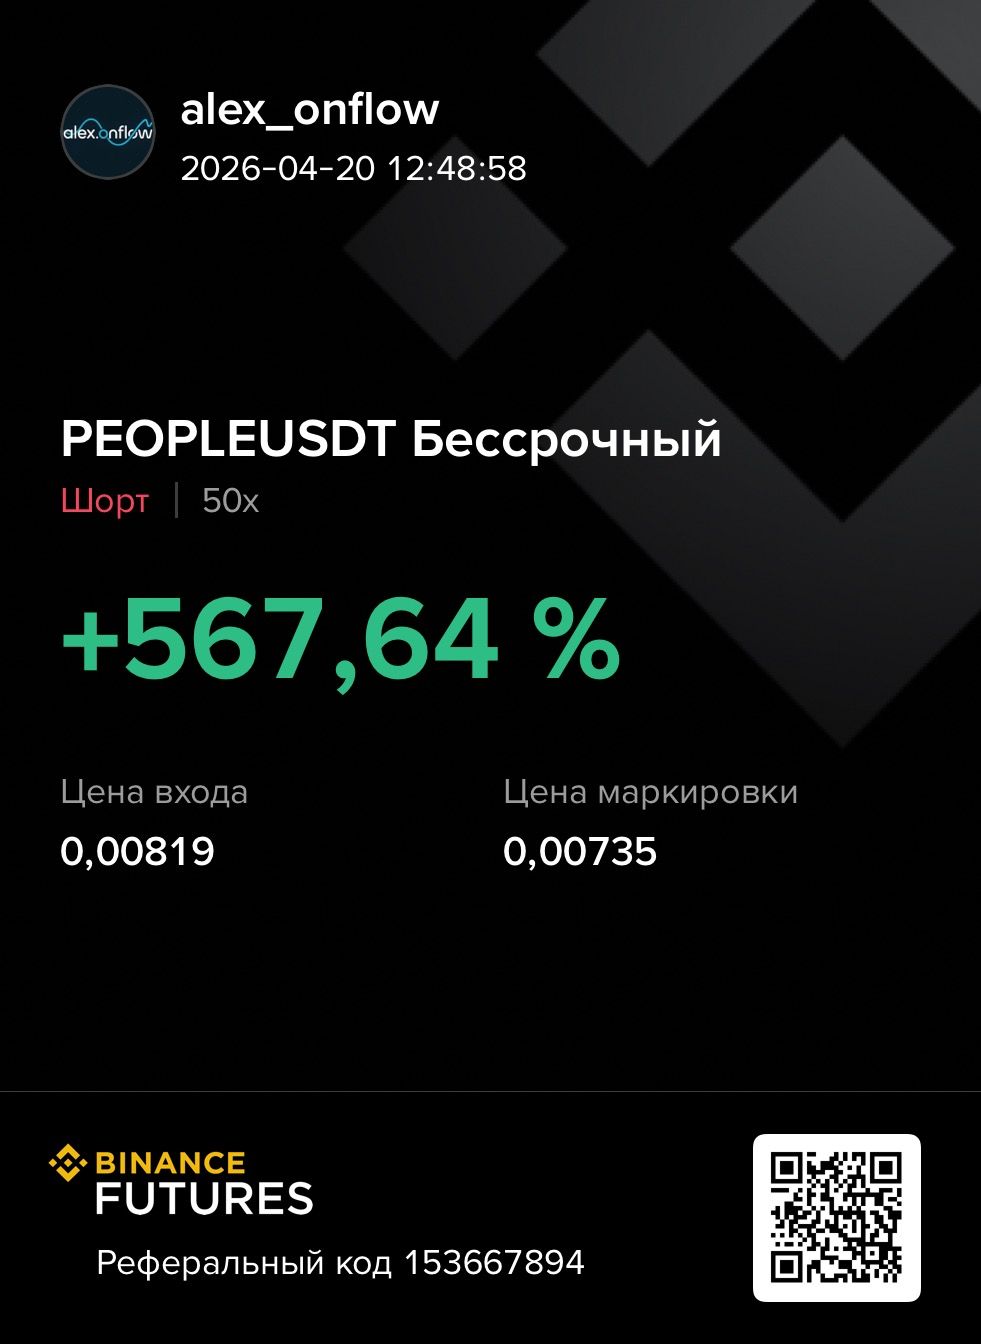
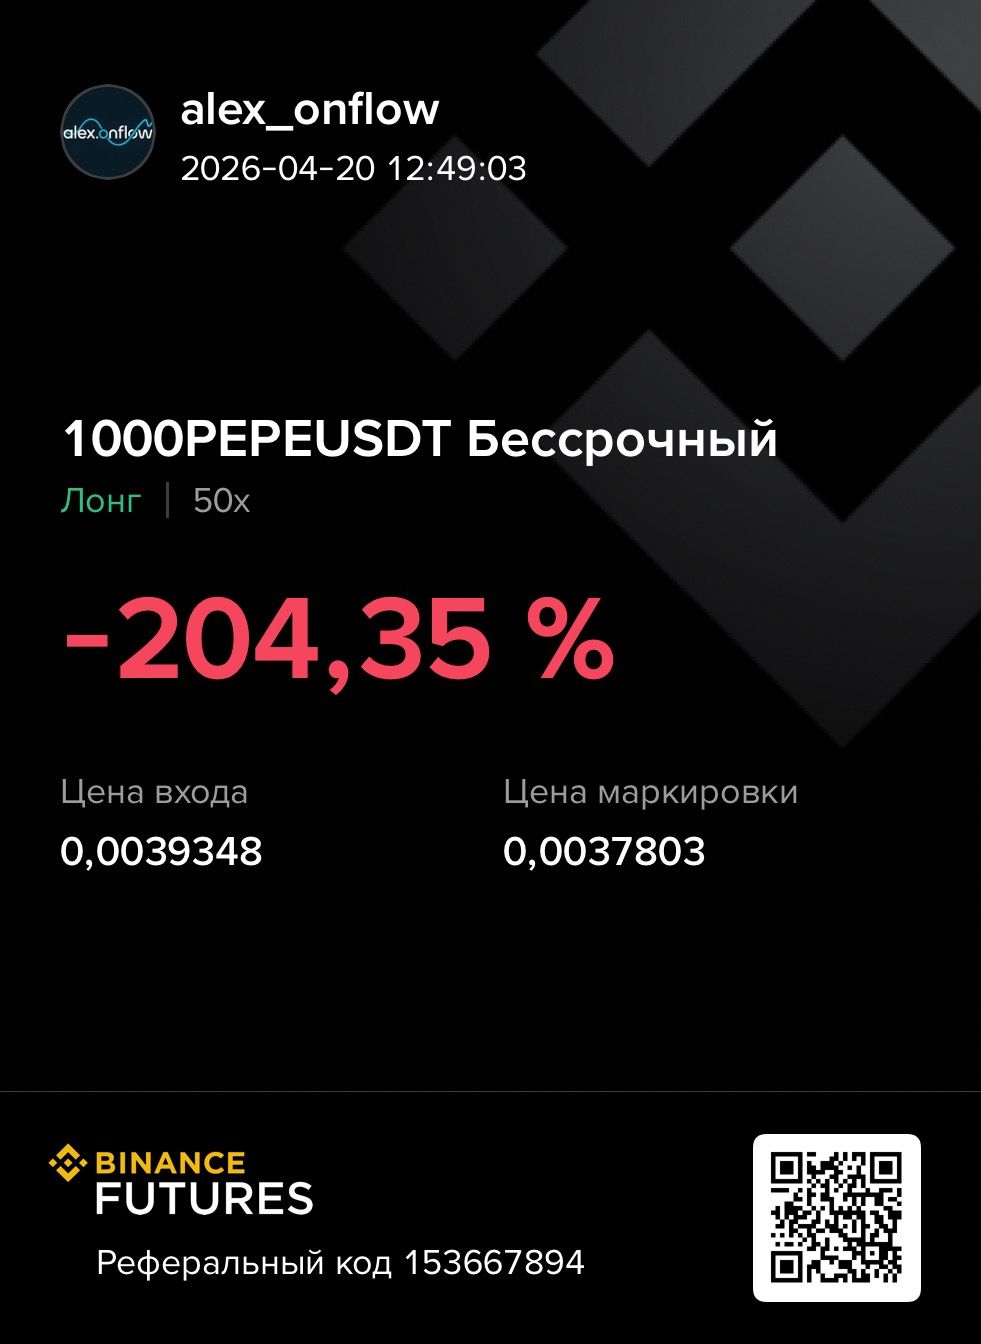
- For the PEPE/USDT position, a long position, a loss of -204.35% was recorded.
The total net profit under the strategy amounted to +363.29%.
This example shows the basic principle of how statistical arbitrage works in practice: the final result is formed not by attempts to forecast the market’s direction but by the correct evaluation of the statistical price divergence between the coins and its subsequent convergence. Even though one of the positions closed at a substantial loss, the total profit more than covered that loss by a factor of 1.5. We did not make money on market growth; we made money on the fact that PEOPLE turned out to be stronger than PEPE at the moment the abnormal spread converged.
The use of the Resonance platform’s professional analytical tools turns trading on cryptocurrency pairs into a structured process in which every decision is backed by figures, statistics, and data.
Who Pair Trading Is For
To trade crypto pairs effectively, continuous monitoring and regular asset screening are essential. This method is not for those looking for random “moonshots” on a wave of luck. It is designed for systematic traders who know how to work with statistical data and control risk. This approach is best suited to those who are ready to work systematically, rely on data, and build their work not around emotions but around verifiable market patterns.
Instead of guessing where the entire digital-asset market will move, a pair trader focuses on the local inefficiency of specific assets. Such an approach requires discipline, patience, and the skills to work with analytical tools, but in return it provides a more structured decision-making process in trading.
Conclusion: A New Stage of Professionalism
Pair trading shifts the focus from simply guessing market direction to comparing the relative strength of assets, market structure, and entry quality.
When you stop looking only at the chart of one coin pair and begin to see the deep interconnections inside a sector through the Market Delta tool, trading itself becomes more systematic and less dependent on random market fluctuations.
In modern conditions, a successful method for trading coin pairs is built on three stages:
- Statistics: searching for abnormal cross-rate deviations through correlation, the beta coefficient, and Z-Score.
- Balance: a competent calculation of position size in order to fully neutralize the impact of the market’s overall direction.
- Discipline: strict adherence to the method and high-quality selection of pairs inside sectors.
Remember: this market is volatile. But even in this chaos, there are patterns that can be analyzed and calculated. By using a quantitative method and modern analysis tools in Resonance, a trader gets a stricter idea-selection system in which the decision is built on data rather than on market noise.
Follow new insights in our telegram channel.
No need to invent complex schemes and look for the "grail". Use the Resonance platform tools.
Register via the link — get a bonus and start earning:
OKX | BingX | KuCoin.
Promo code TOPBLOG gives you a 10% discount on any Resonance tariff plan.
Recommended articles


