Strategy is important, but risks are more important

Trading according to the strategy brings profit, but it is risk management that preserves the deposit: we will analyse how to control the position volume in order to trade in the black consistently.
Table of contents

Remember, or even better, write it down:
Risk can take many forms, but it never goes anywhere.
There are no investors who are always right.
So what are we going to do? Count!
Trader Warren
Warren, our trader, had 3 dollars. He opened 3 trades, each with a risk of 1 dollar. He decided to fix the profit at 2 dollars.
After 1 day, Warren got the result of all the trades.
Two trades went into minus. One trade made a profit.
Warren’s trader had $3 again. Why? Let’s say that $1 of risk equals 1% of the price movement.
That 1% risk includes:
- 0.05% is the exchange commission for opening the trade.
- 0.05% is the exchange commission for closing the trade.
- 0.15% is a correction for the liquidity and volatility of the coin.
- 0.75% is the price difference.
He made a profit of 2 and a penny dollars on one of the deals. The risk/reward ratio was 1 to 2. But Warren is taking a big risk because three losing trades in a row is quite realistic. So Warren takes $100 and starts trading the strategy, but with less risk.
He sets a risk of 50 losing trades in a row, which is doable in theory, but in practice, it’s tough to achieve if you’re committed to a strategy. Warren opens and closes five trades a day, seven days a week, for a whole year, with weekends and holidays off. In a year, Warren makes 1,000 trades.
That means he made $358 in profits, which works out as a 358% annualised return on his deposit. So, Warren earned more than… Warren earned a lot!
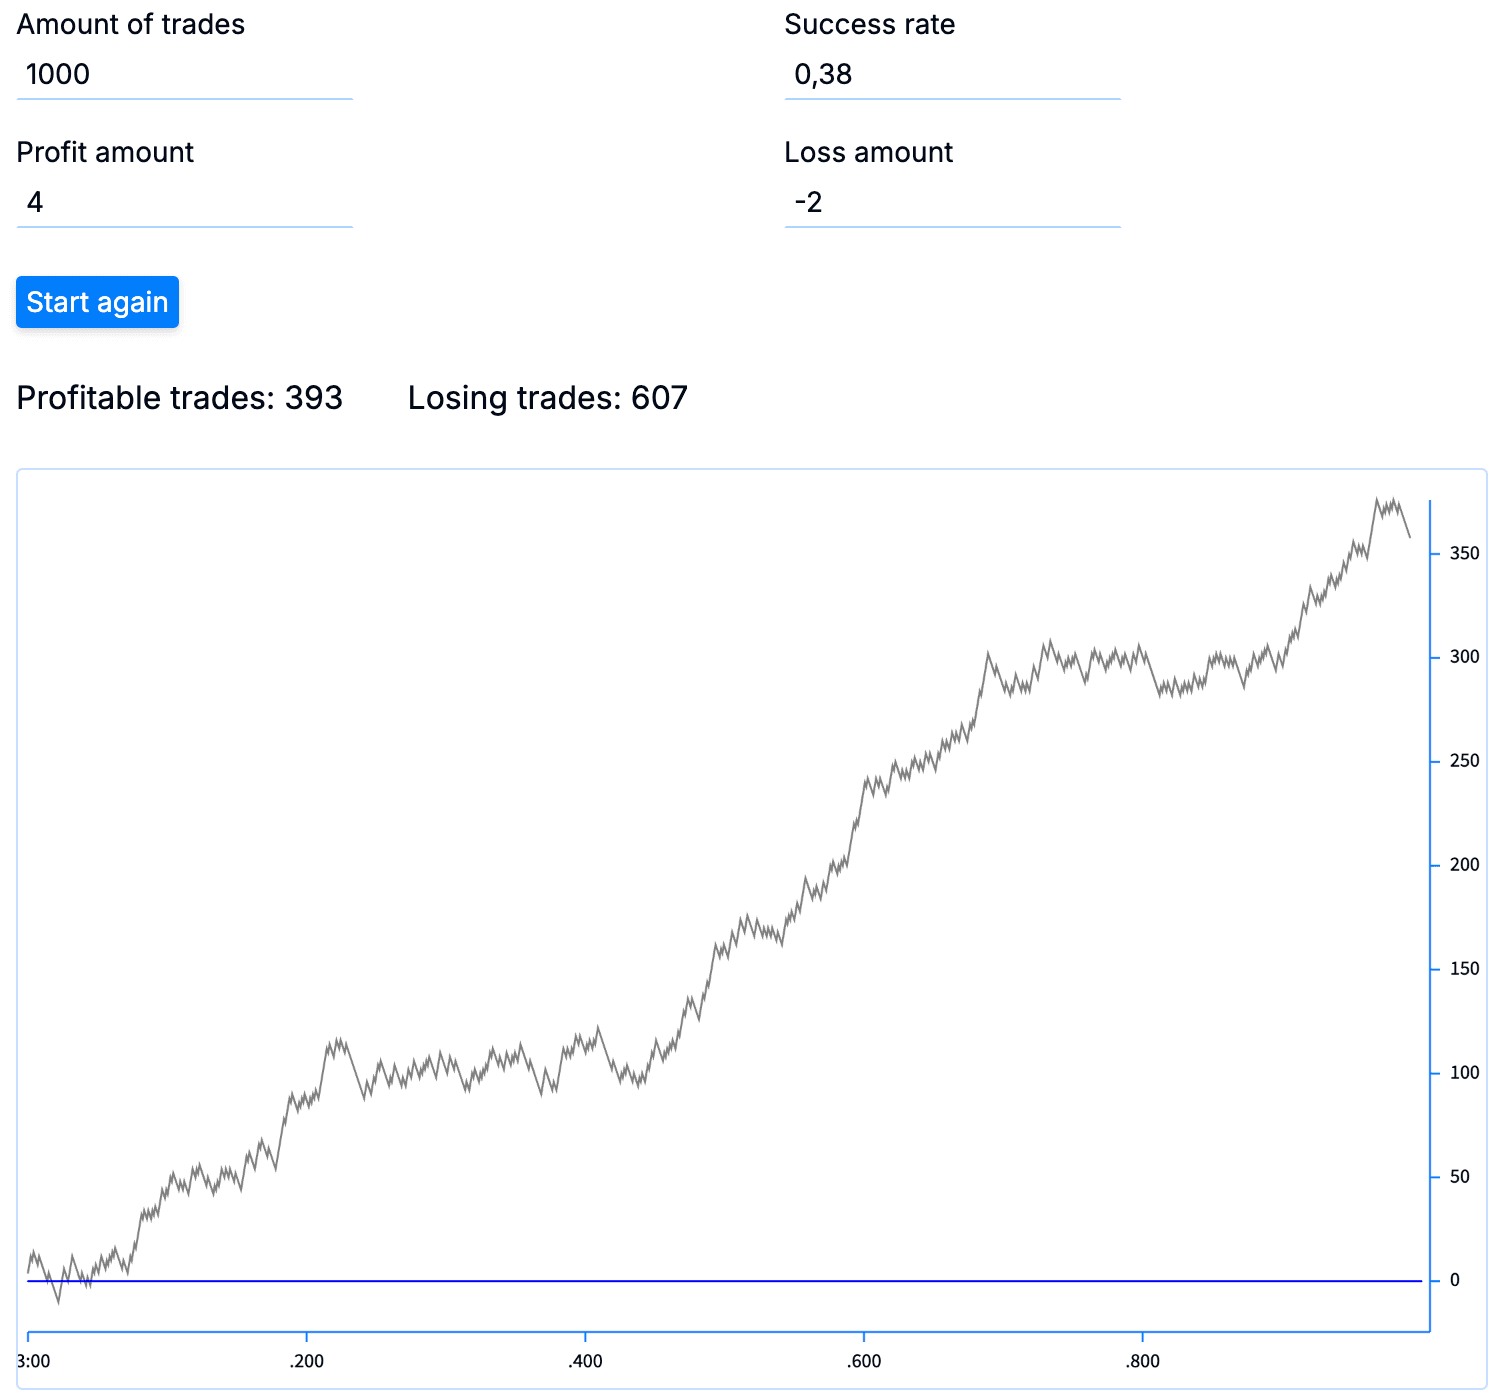
Warren had some losing trades.
A lot of losing trades, 607 out of 1000 losing trades he closed with a loss of $2.
Think about it, Warren only had $100 in his account and over the year he lost a total of $1,214! And yet he was still in the plus side of $358!
Not even breaking risk.
If you want to see Warren’s other '1,000 trades’, go to the simulator.
Calculating risks in practice
We will follow Warren’s example and create a Google spreadsheet with these columns:
- AUM, $ - assets under management - our capital
- Fail series - number of losing trades in a row
- We also add 'Risk $’, which shows our risk in dollars.
- SL price % - distance to stop loss.
- Position, $ - total value of position.
- Leverage
- Marginal - the total amount of money for the position, which we enter at the exchange when opening a position.
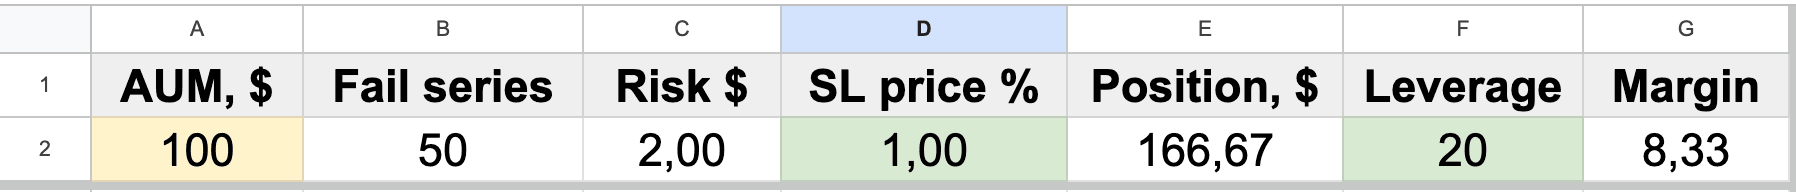
Filling in the boxes:
- AUM is just a deposit number.
- Fail series is just a number.
- Risk $ - count as =A2/B2.
- SL price % is just a number, the percentage of price movement up to stop loss.
- Position, $ - count as =C2*100/(D2+0,2), where 0.2 is our correction for commission and volatility.
- Leverage is just a number, the leverage given by the exchange.
- Margin is counted as =E2/F2.
Now let’s raise our chances of success with the help of objective data.

Looking for the coin
We use the BAS table to search for assets with sell orders.
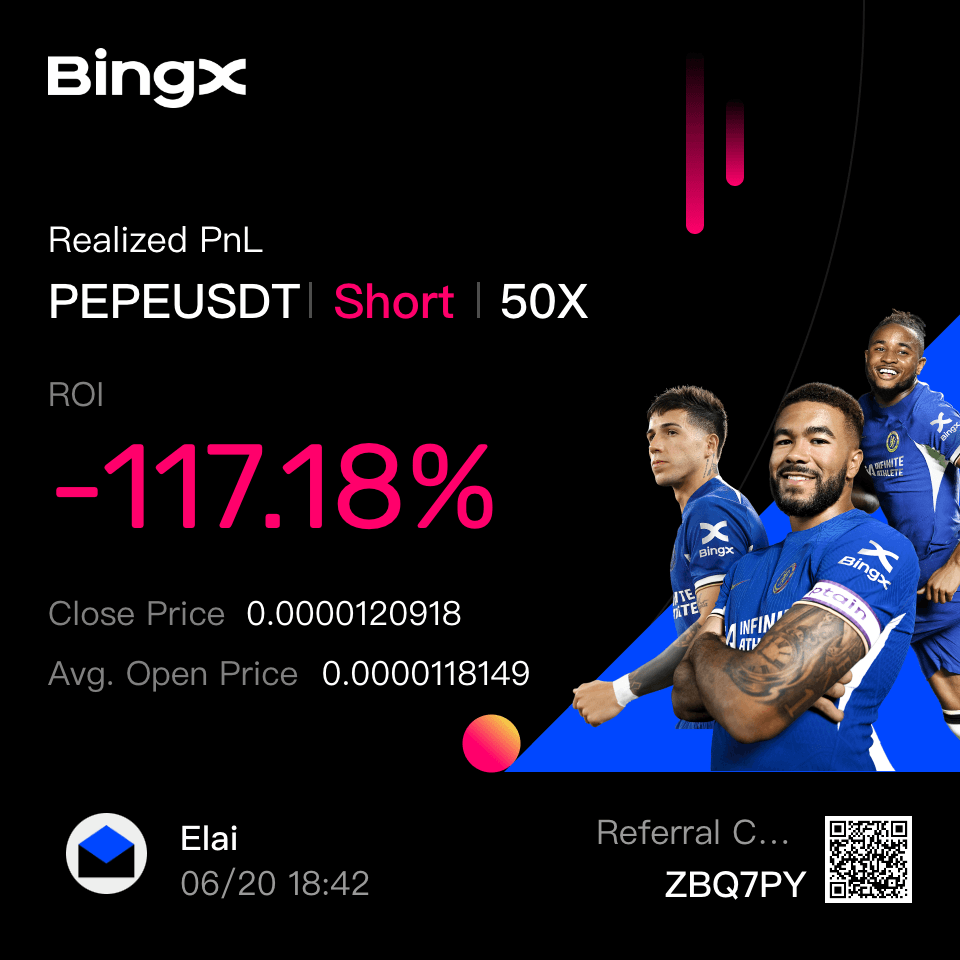
We found PEPE/USDT.
We can see that the price has risen, but participants have started to place limit orders to sell (blue zones).
We can see that purchases couldn’t go higher significantly (red zones).
On the dashboard:
I’ve used red arrows to show places where sellers are really inefficient, but where they’ve started getting better.
It’s also worth noting that volatility has hit its highest point statistically.
We go short, but the buyers try to hit max again and take my stop, along with the stops of other shorts. But there’s no money to push the price higher, so it falls without my short position.
But we remember Warren’s example.
So we keep working the strategy.
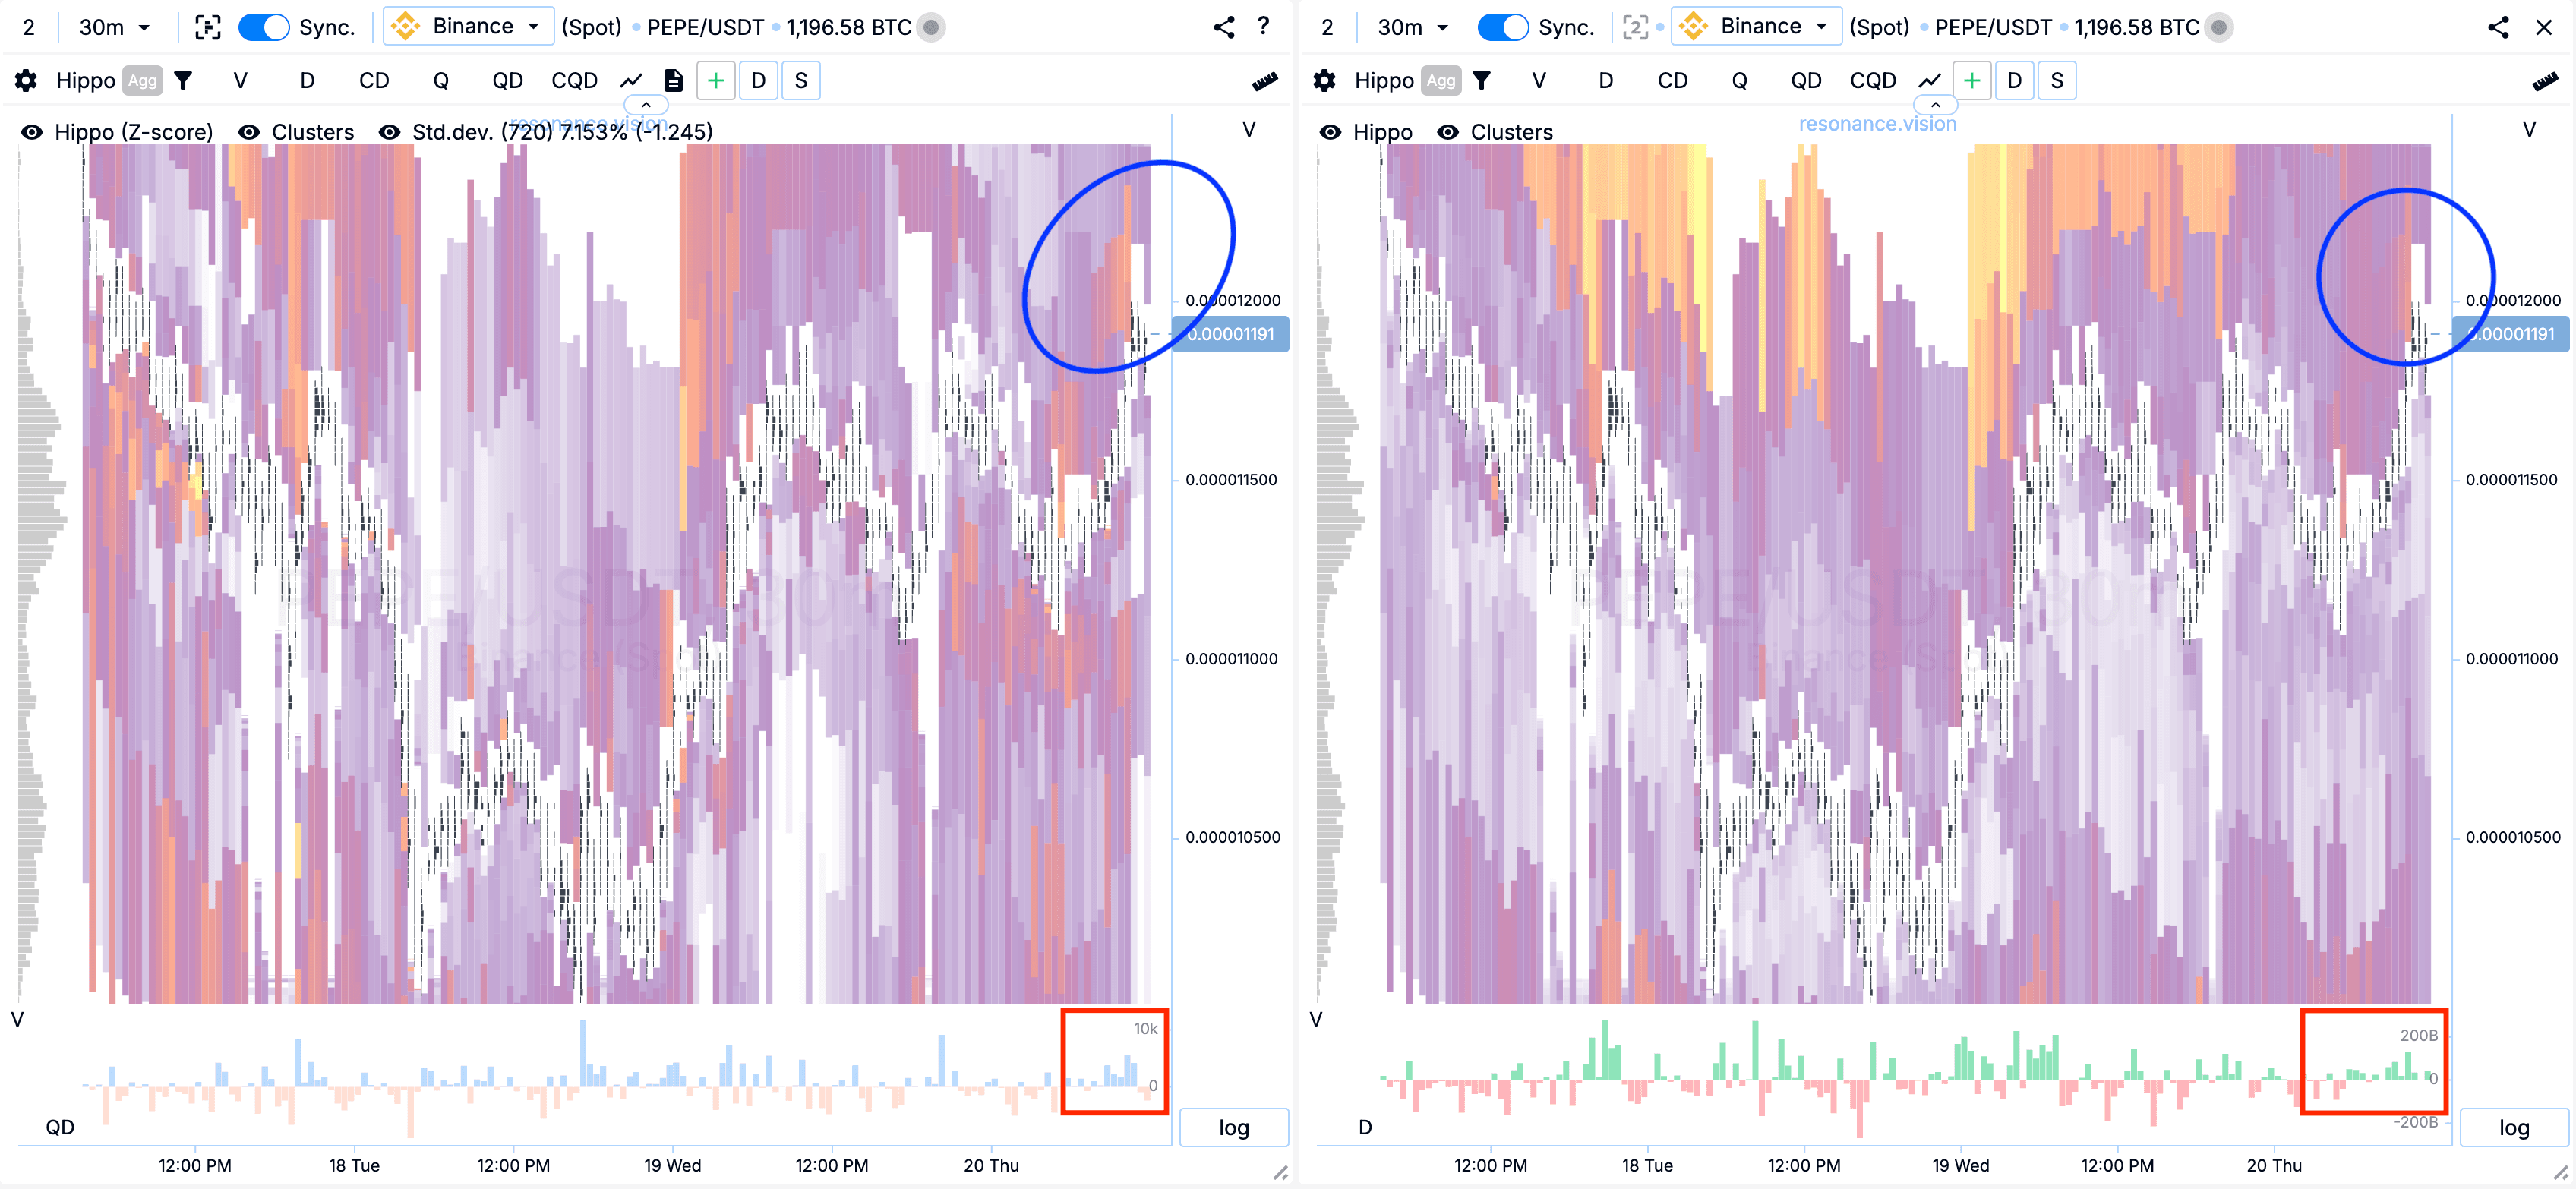
We find the second position.
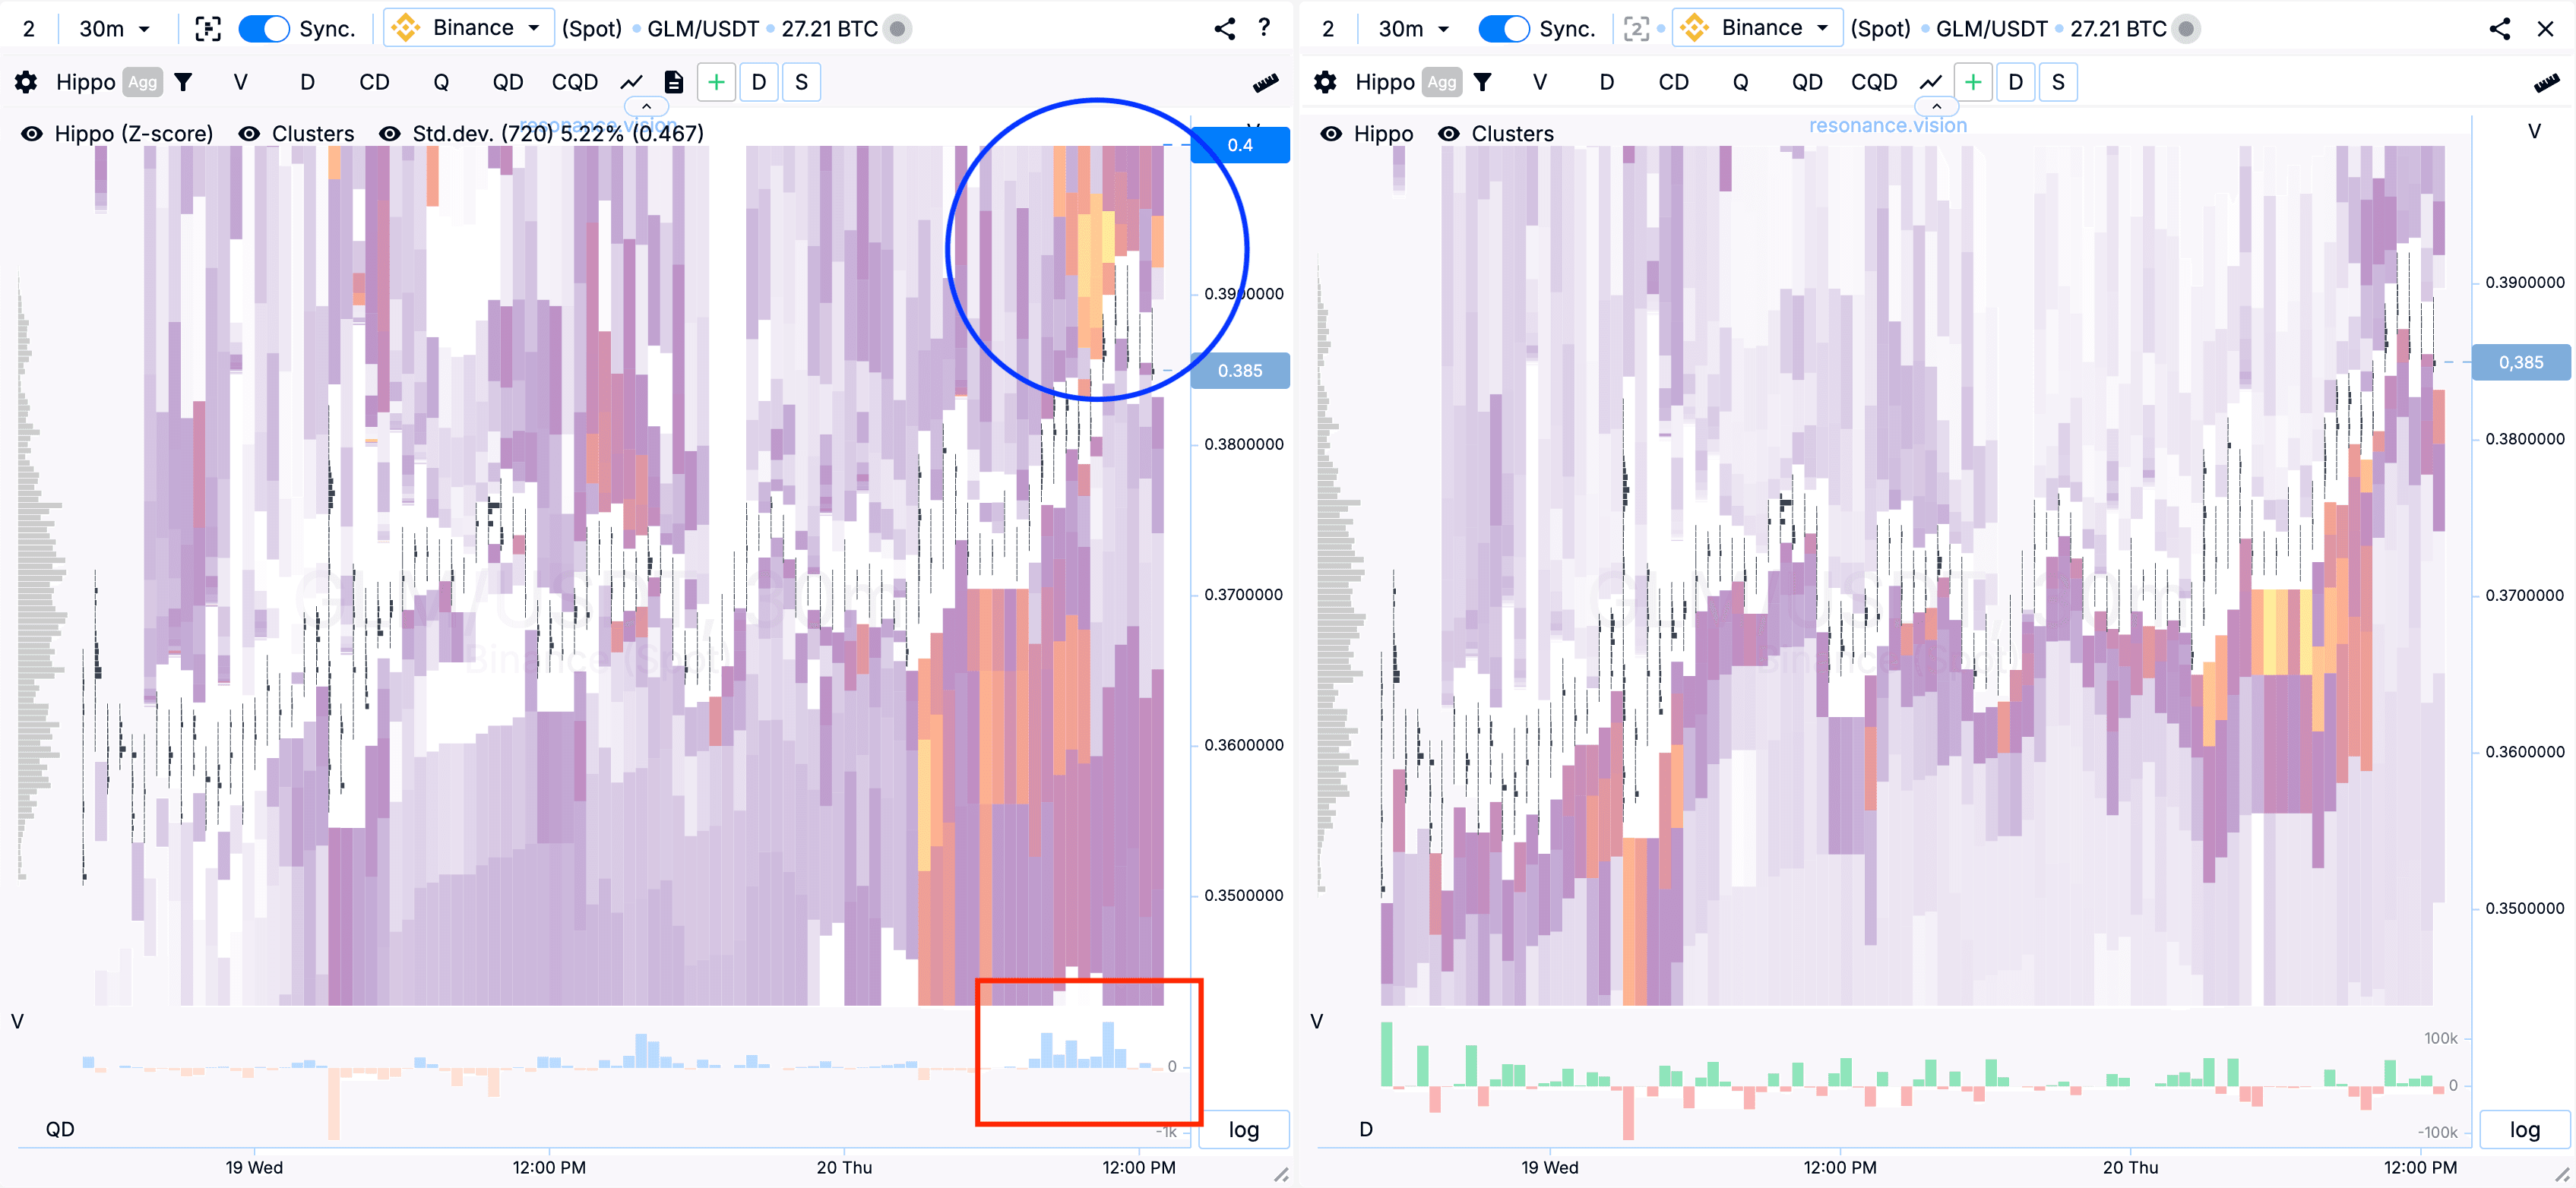
Looking at the heat map, we can see that buyers have reached the zone where sellers have an abnormal number of sell orders, as shown by the bright spot on the aggregated heat map (highlighted in blue).
And purchases were active (highlighted in red).
On the dashboard:
The delta/balance is quite high (highlighted in red).
Price deviation (Z-Score) is also statistically high (highlighted in red).
The buyers have got a lot more efficient, but the sellers have gone the other way. And when they’re moving in sync like this, it’s a good sign for a short position.
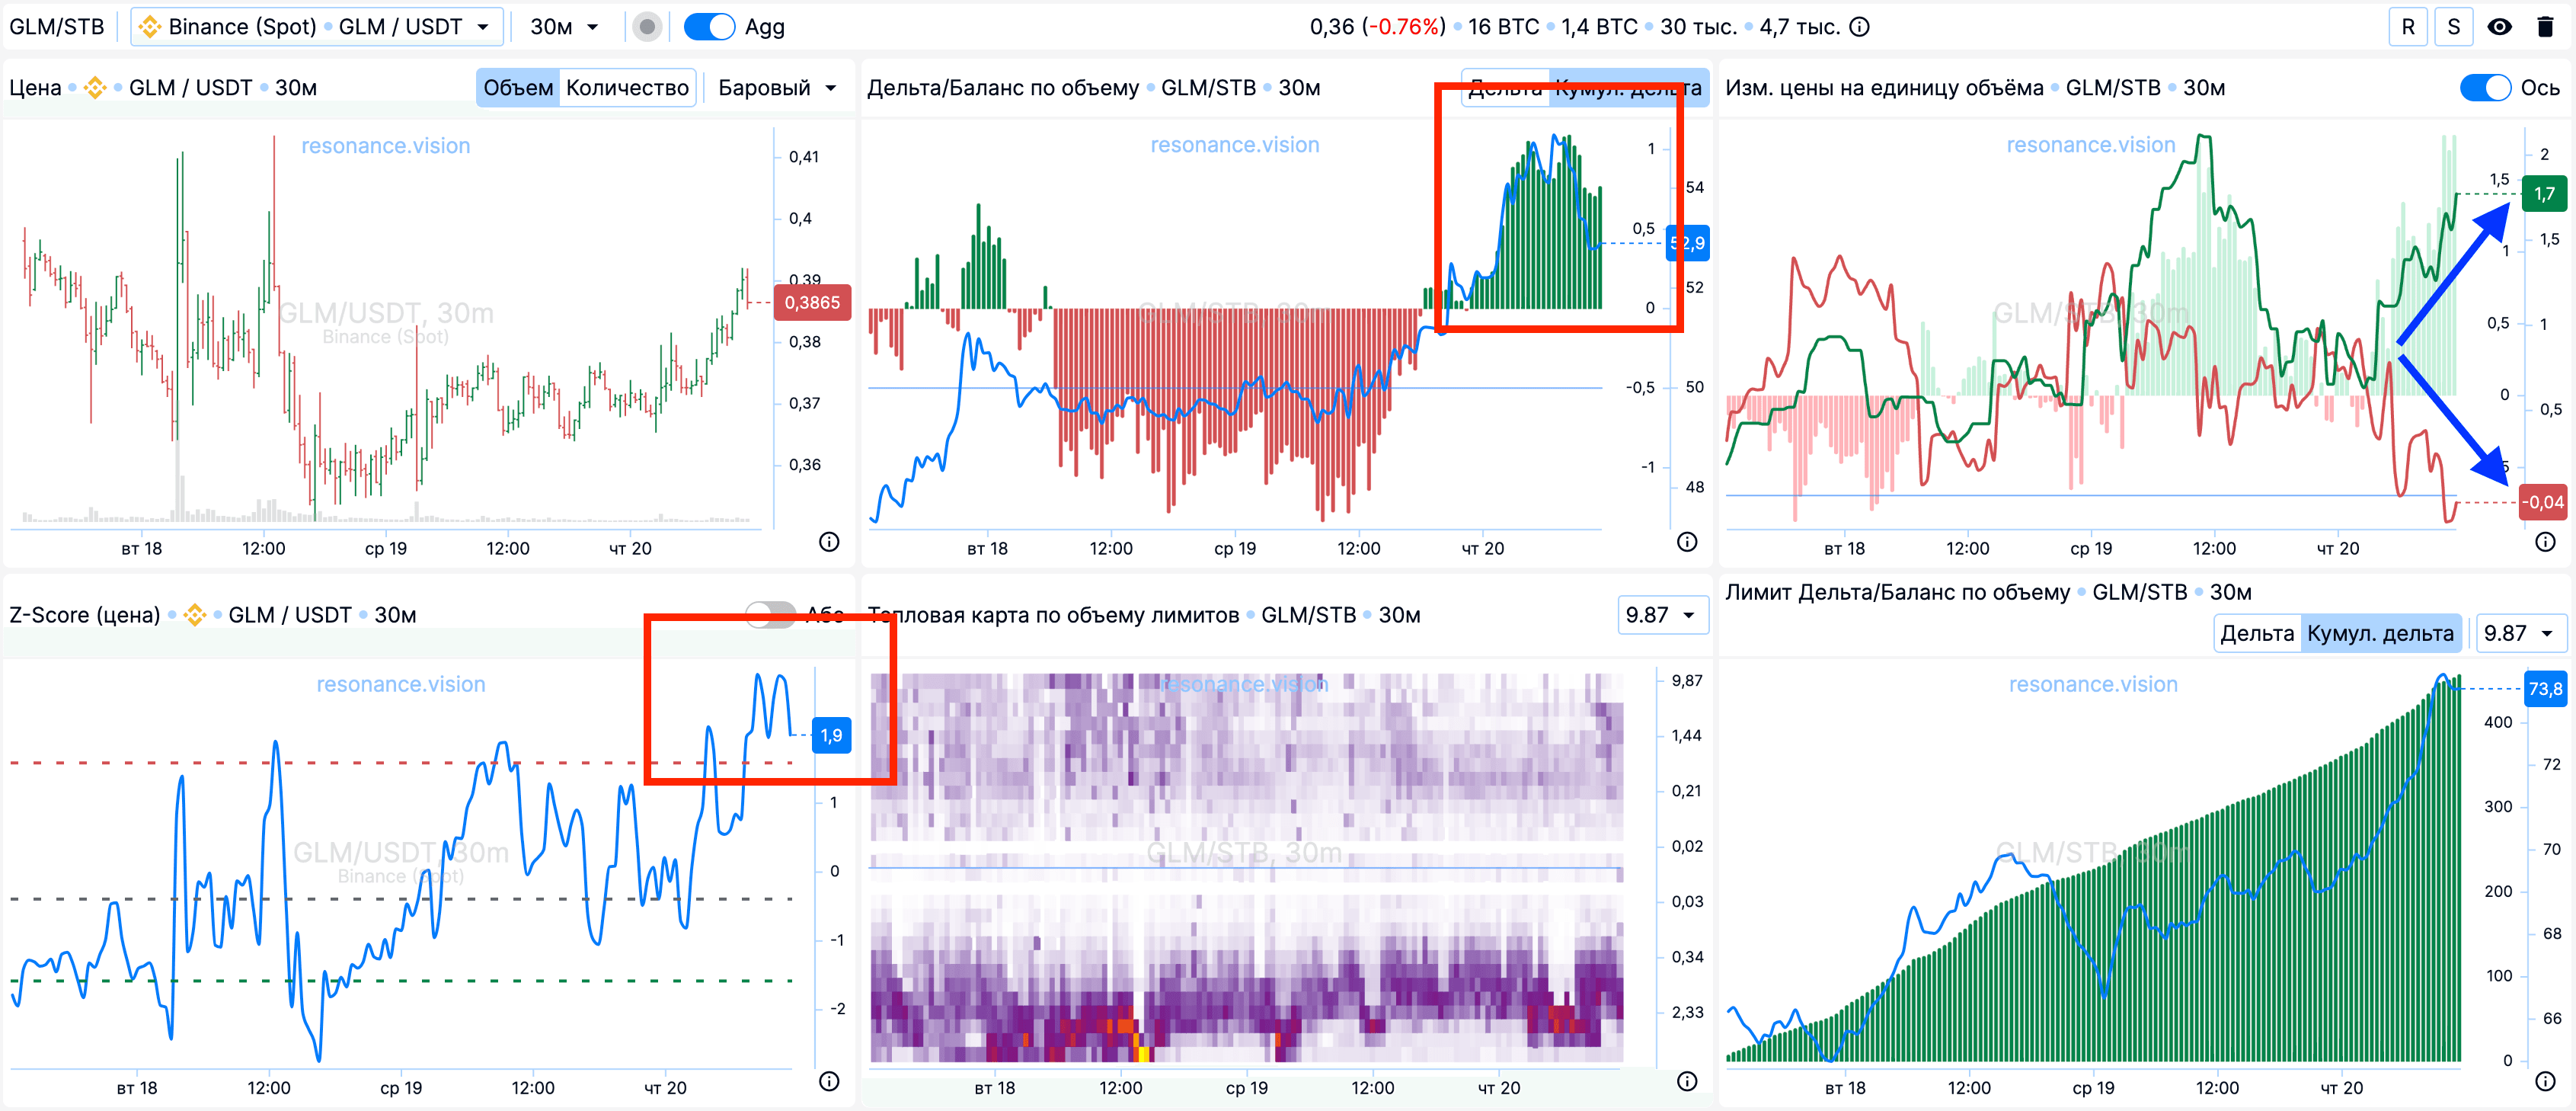
To sum it up, the situation ticks all the boxes for entering short.
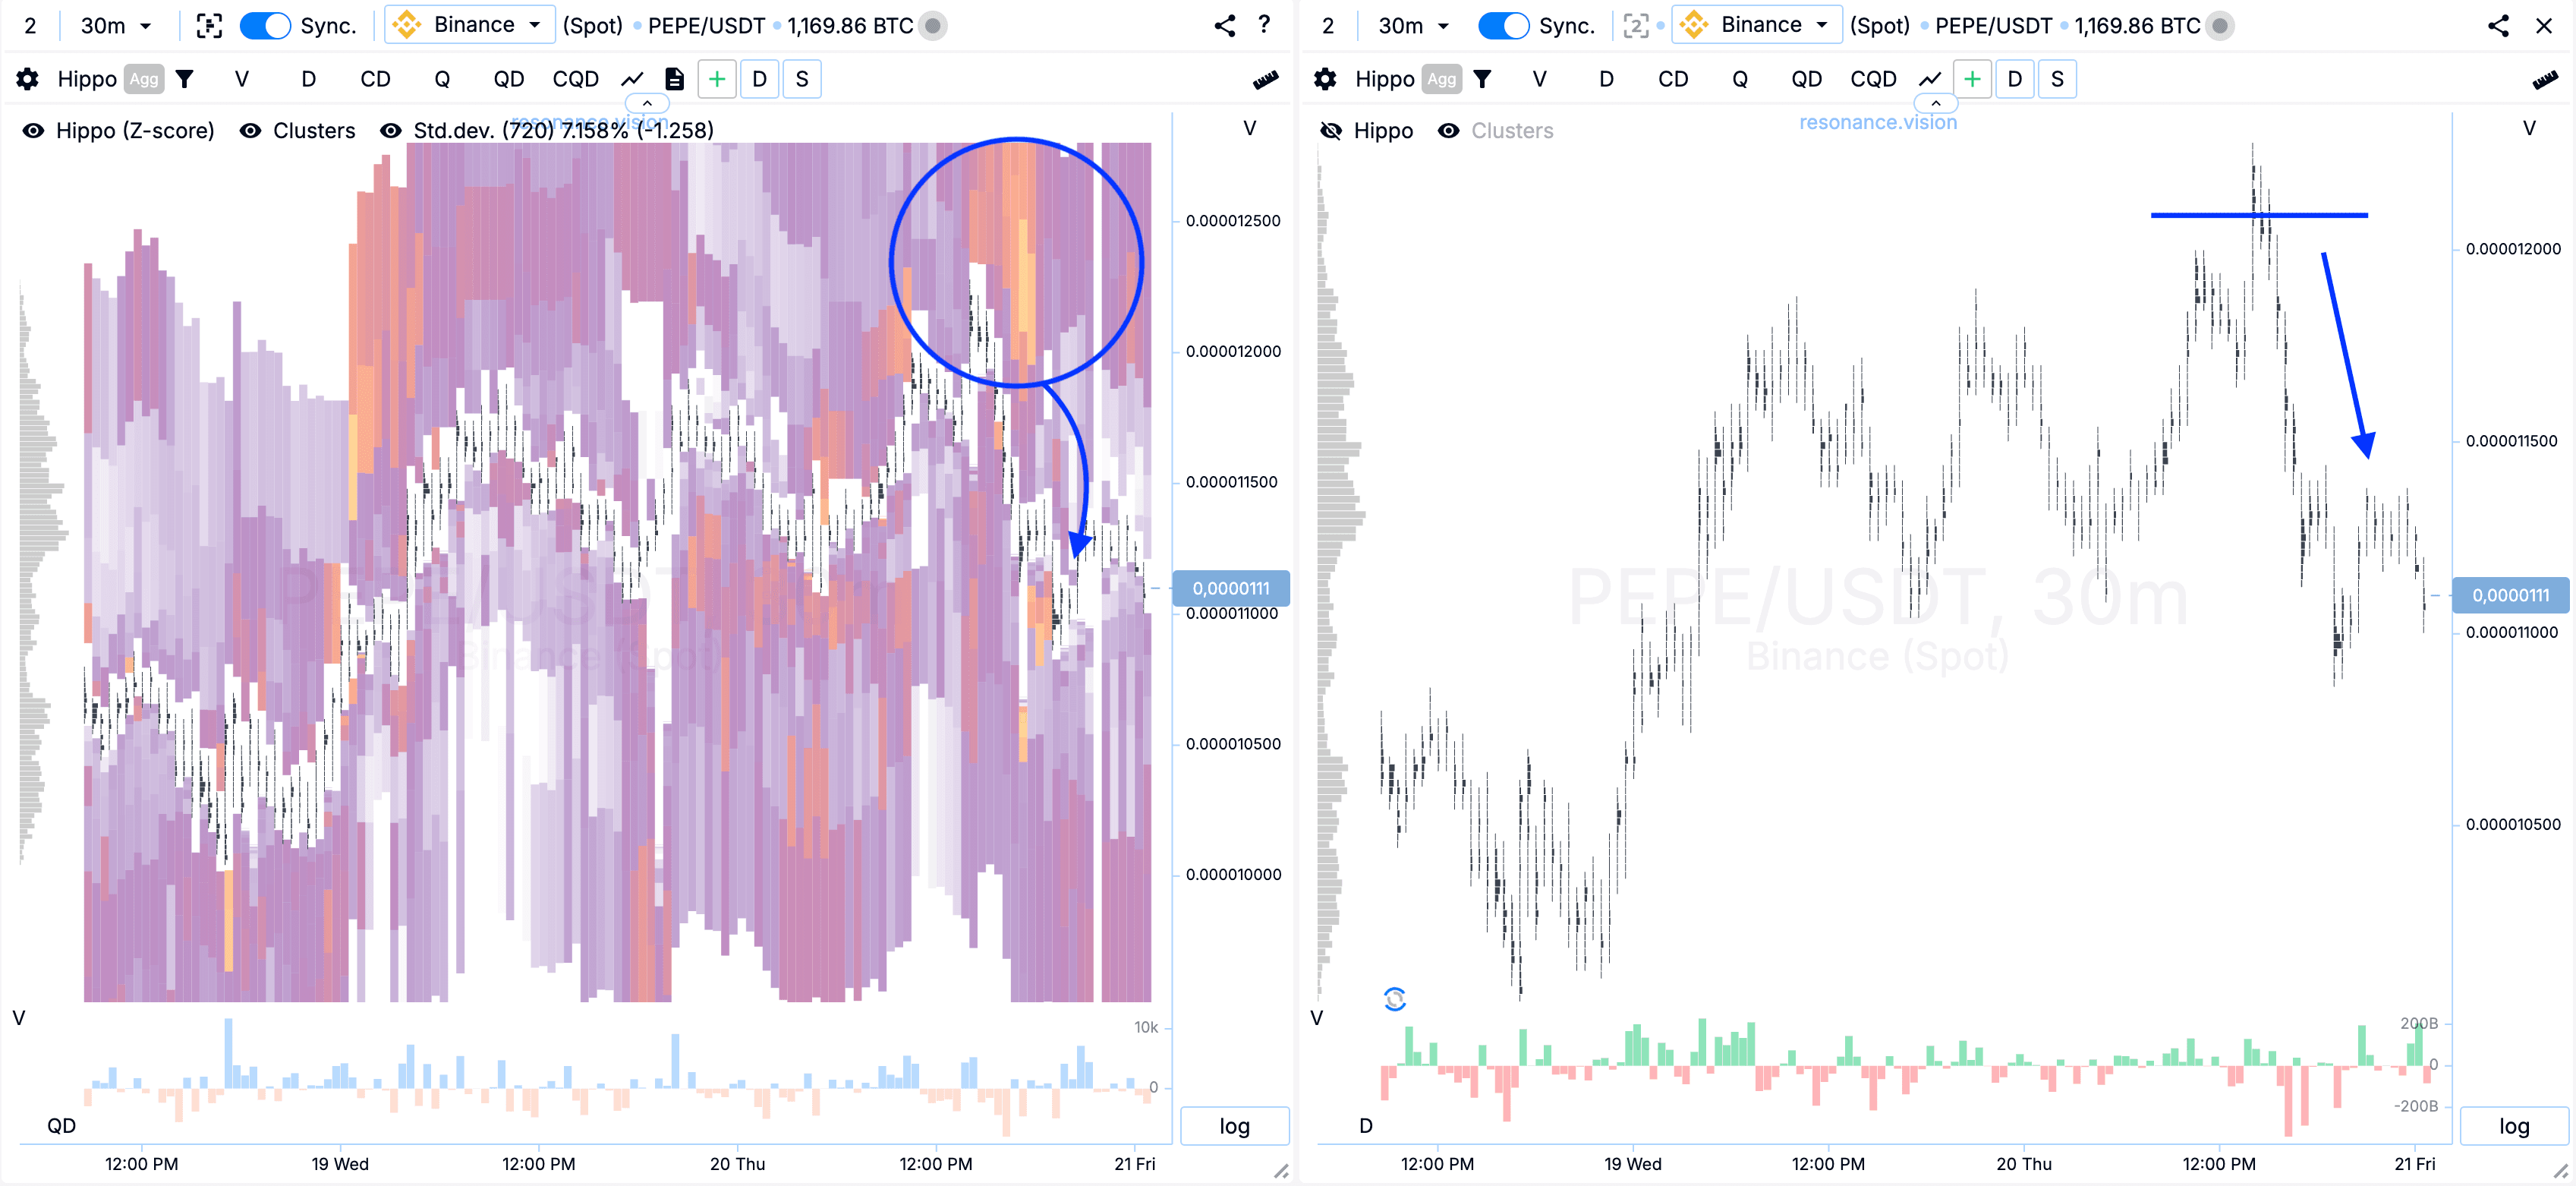
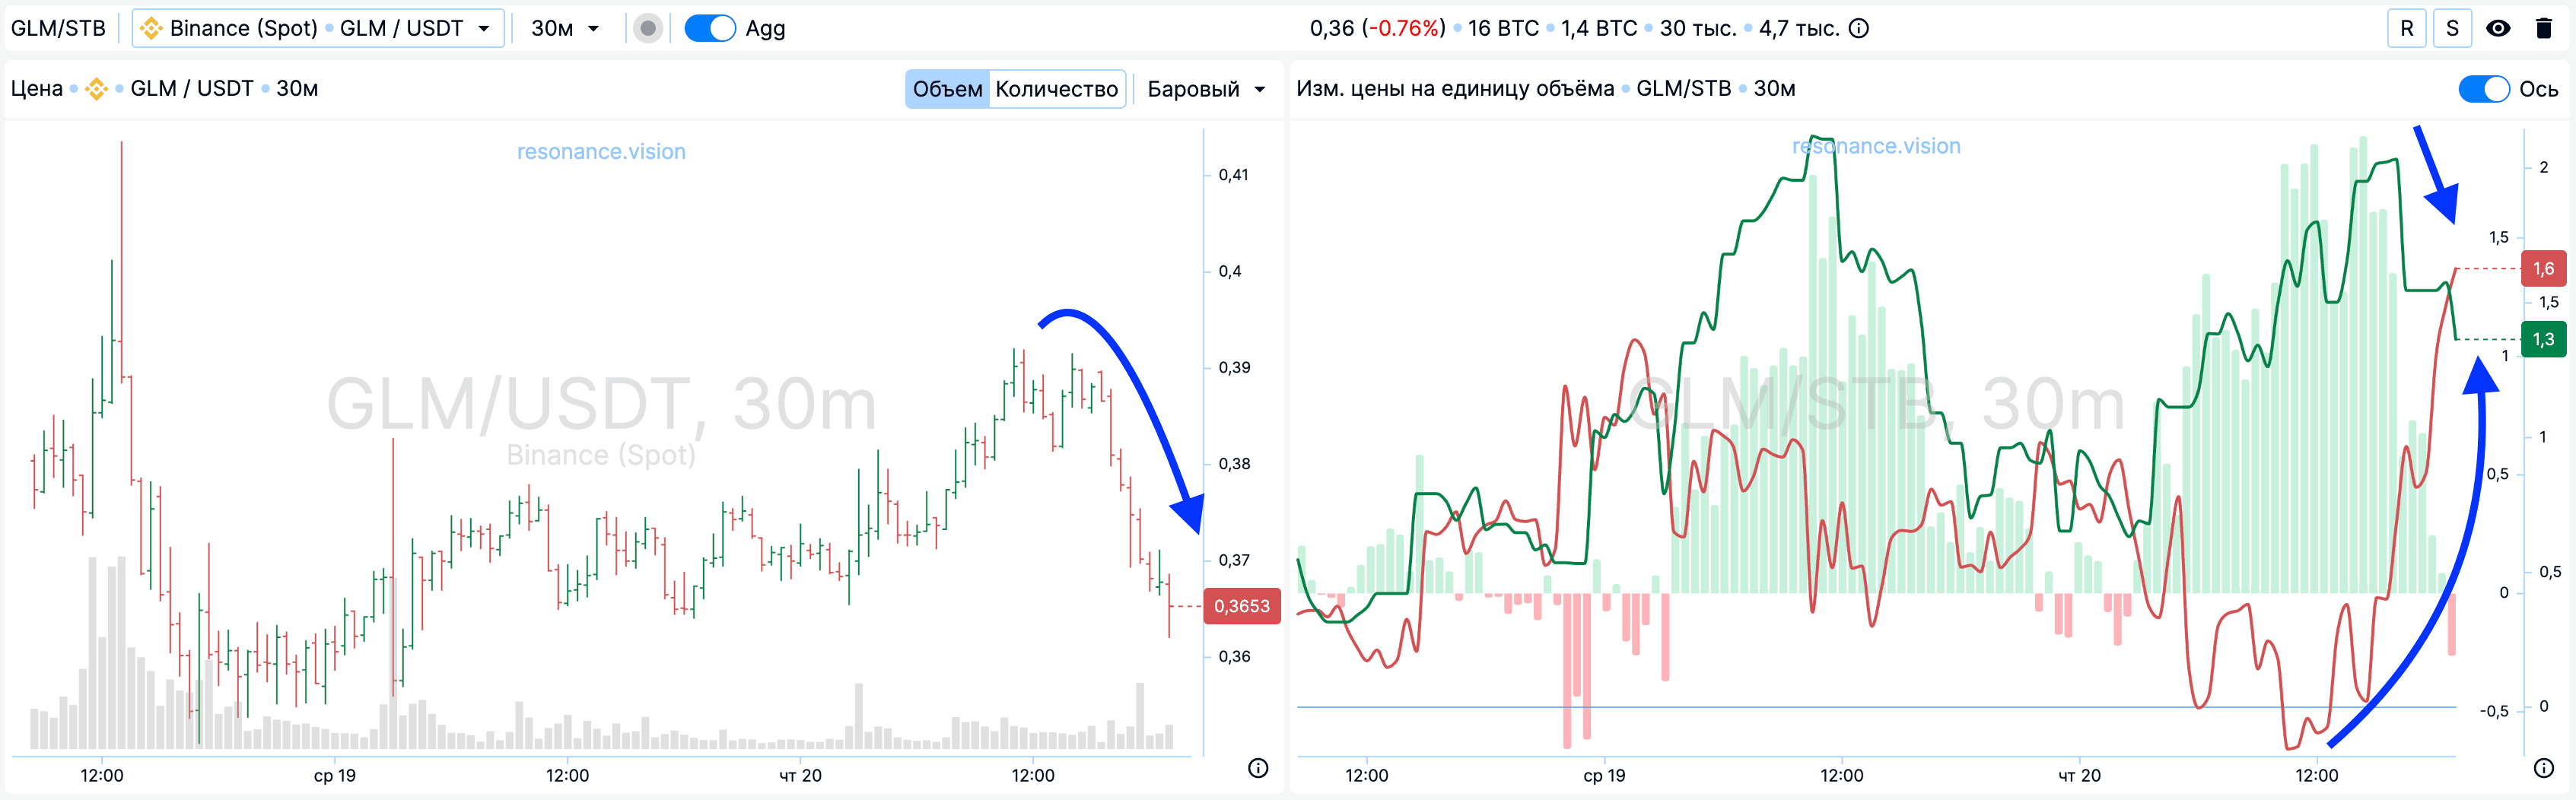
Next:
- the price is falling
- the price change per unit volume lines up pretty well, with the red line going down and the green line going up before the entry. When the position was supposed to close, the lines looked to be lining up.
Bottom line
There are two positions:
- First position: we lost one position
- In the second position, we made a profit of two losses.
So the result of the day is a profit of one loss.
If we talk in numbers like Warren’s, then:
- In the first trade, we lost 2 dollars.
- In the second trade, we made $4.
So the day’s profit is $2.
There’s no need to invent complicated schemes or look for the 'holy grail’. Use the tools on the Resonance platform.
Register via the link to get a bonus and start earning:
OKX | BingX | KuCoin.
Use promo code TOPBLOG to get 10% off any Resonance plan.
Recommended articles


