What is BID, ASK, and SPREAD in Crypto Trading?

This article explains how prices are actually formed in the crypto market through the interaction of two key parties - buyers (BID) and sellers (ASK). Basic concepts of market mechanics. The role of active and passive participants. Market Depth Density.
Table of contents
From ‘shadows’ to real processes
It’s not easy to find out how prices in the cryptocurrency market are formed. If you search for ‘market mechanics’, you might get an incorrect meaning of the term. The first lines of the output are occupied by articles stating that ‘the main types of market mechanics are: trend, correction, reversal, level breakdown and rebound…’. This kind of ‘knowledge’ can cost you your deposit and hides how prices are formed - how market volumes influence the price.
Talking about the market mechanics only in terms of ‘reversals and breakdowns’ is like describing how an engine works using the words ‘the car drives and turns to the left’. Trends, corrections and reversals only happen because of what’s going on in the market.
First of all, you need to understand
How orders are brought together.
How sellers and buyers change the market balance and affect price movements.
How money moves from one person to another, and from one type of asset to another.
First, the basics
What happens when you buy or sell an asset on an exchange?
For example, you have $10,000 in your wallet and you decide to buy Bitcoin, the most well-known crypto asset. How do you buy it here and now? It’s very simple! In the exchange’s terminal, you’ll see a button that says ‘Buy’. Press it, and in a flash, the number of bitcoins you need will appear in your wallet.
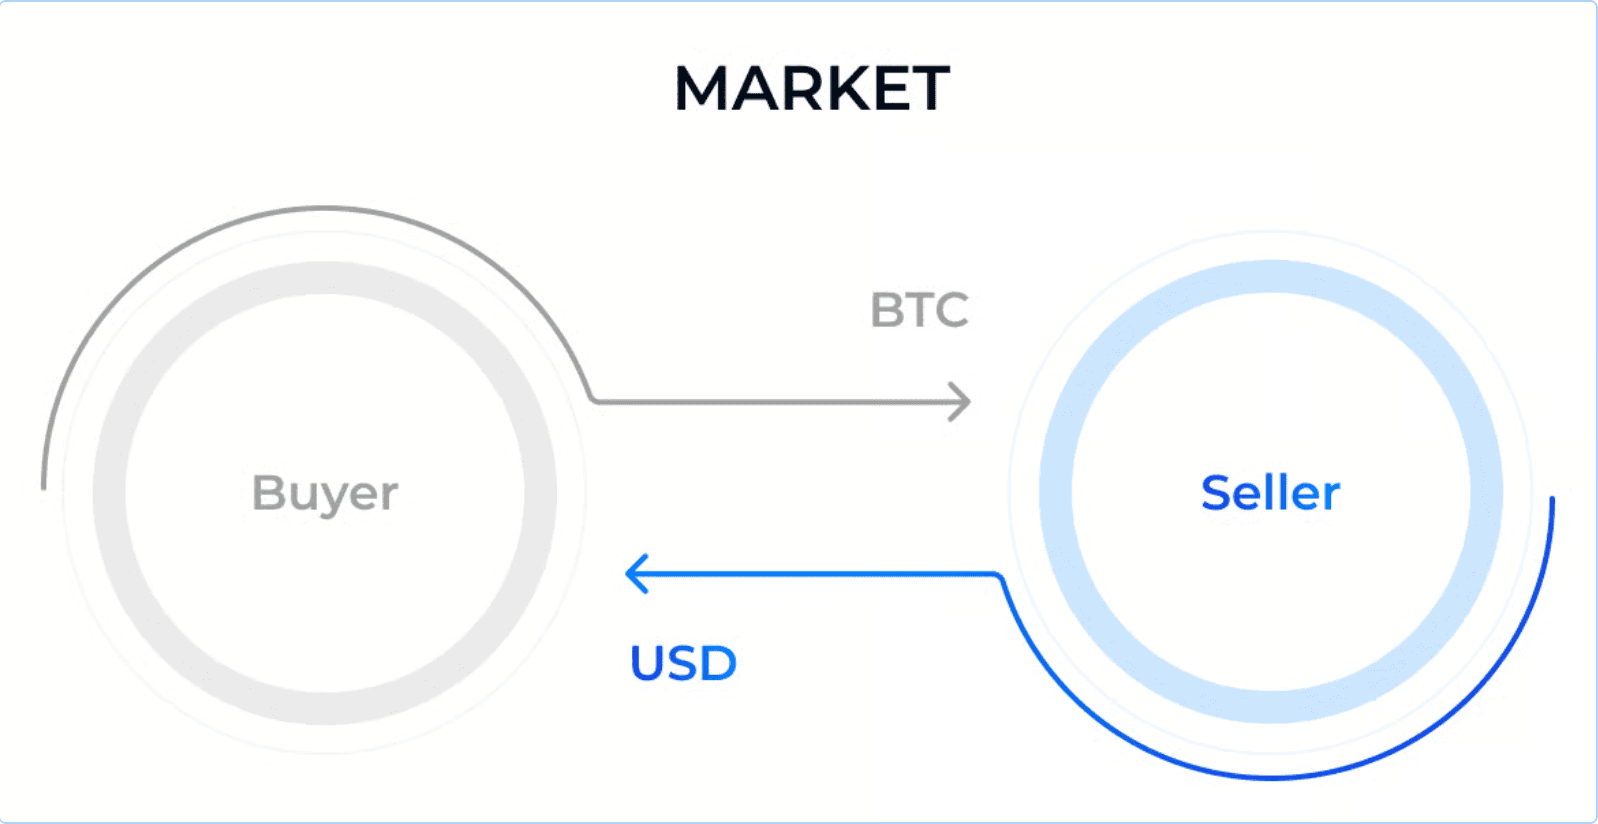
It doesn’t look like anything special. Every day, you do similar things without even thinking about it, like buying coffee from the coffee shop near work or groceries from the shop. In the crypto market, it’s simple. There are always two sides: a buyer and a seller. You can’t buy if no one will sell to you. When you click ‘Buy’, you buy an asset because someone else has made a counter bid.
BID, ASK, SPREAD - what do they mean?
By learning how the market works, a trader not only understands the meaning of crypto market terms, but also realises the reasons for price changes. Many articles on this blog refer to the most basic concepts, because you cannot get anywhere without them. Basically, there are two important tools that you need to trade successfully: a cluster chart and a tool to analyse the order book.
Let’s move on!
There are many market participants, and they can be divided into two groups:
- An active press ‘Buy/Sell’ and instantly change the asset’s price
- Passive ones place limit orders, which form the depth of the market and influence the spread.
No indicator will predict at what second traders will start aggressively influence into the market, but analysing clusters and order book will help you to see it in advance.
Ask orders are limit orders to sell. They are placed in the order book from the top and are marked in red colour.
Bid orders are limit orders to buy. They are placed in the order book from the bottom and are marked in green colour.
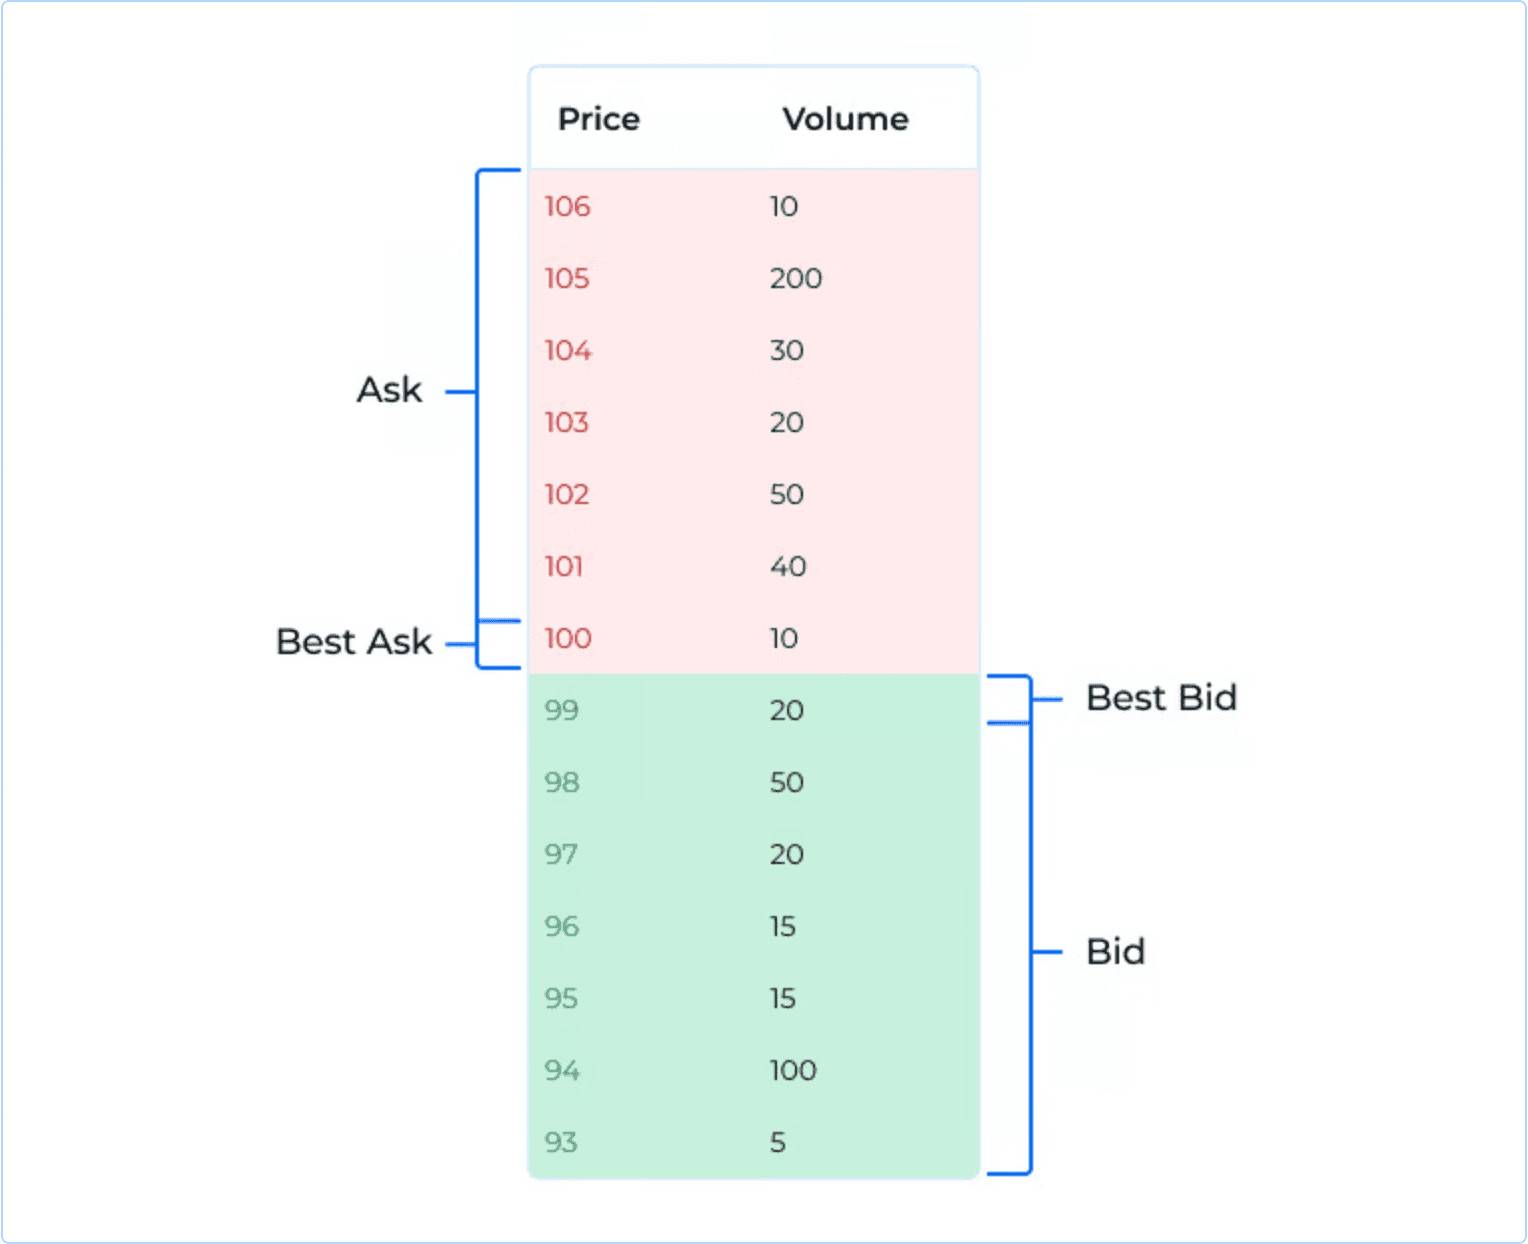
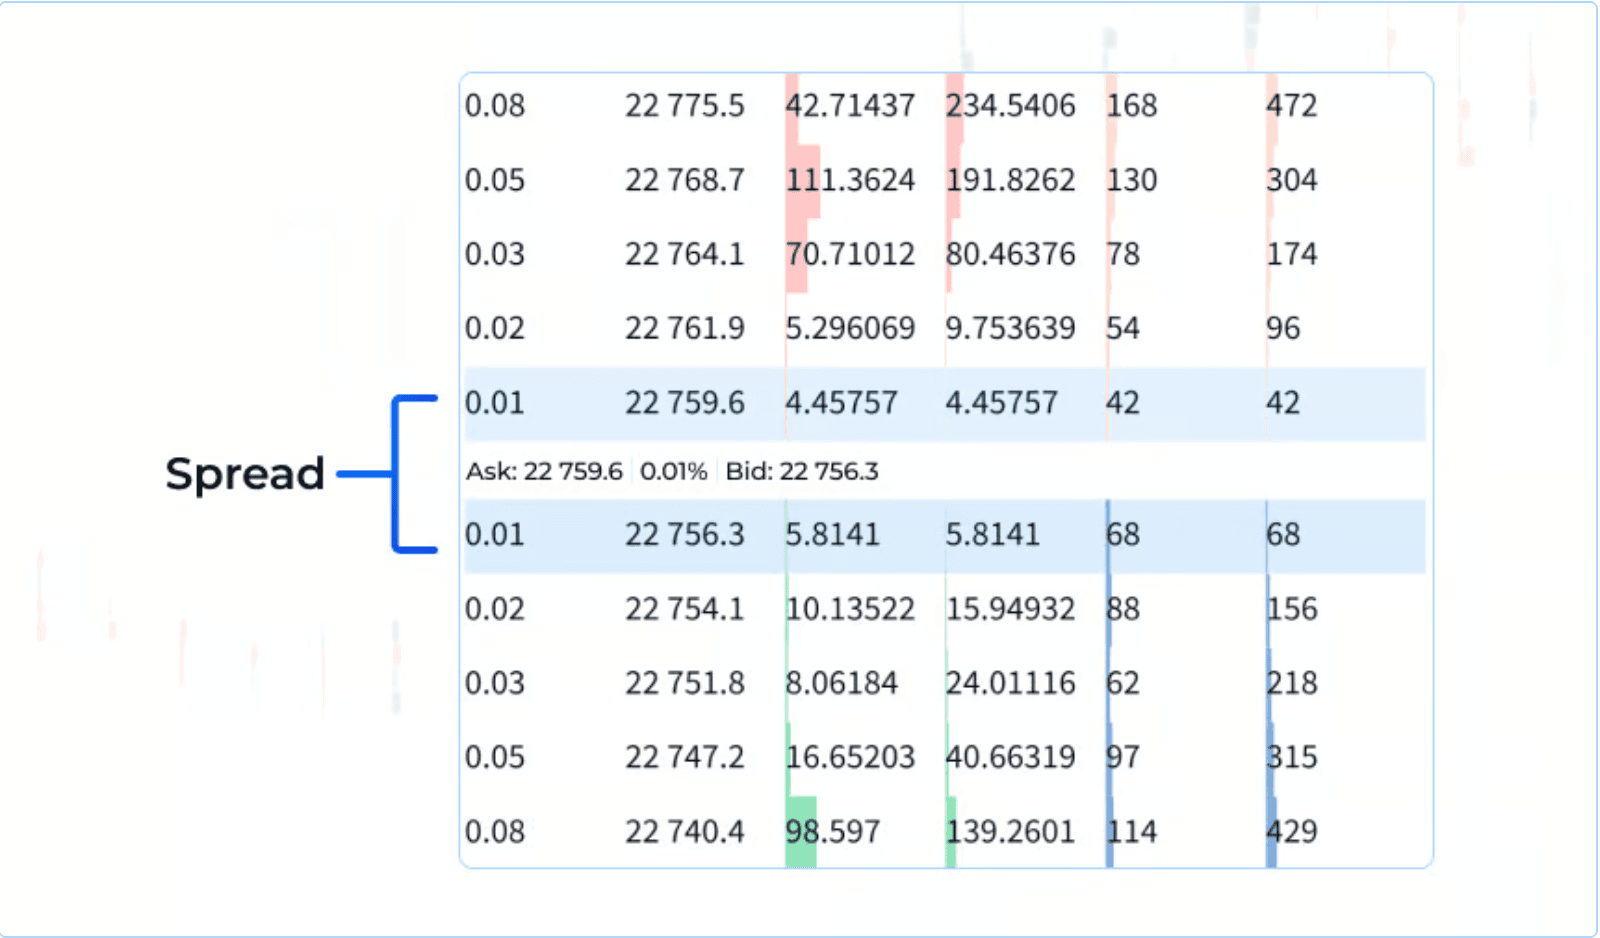
Spread is the difference between the ‘best’ bid price (Bid) and the ‘best’ ask price (Ask).
We put the word ‘best’ in inverted commas because it is the best for a particular moment, but in reality it is just the closest to the market price.
The spread is small when the difference between the bid and ask prices is minimal. If the distance between them gets bigger, the spread gets wider.
There is a wide spread when the difference between the buy and sell prices is significant. This is because buyers try to buy assets for as little as possible, while sellers try to sell them for as much as possible.
Depth Density tool
The Resonance platform with the Depth Density tool can help you to understand which crypto direction based on bid and ask is more probable direction a cryptocurrency is going to take based on volumes and how many buy and sell orders there are. It is showing total bids and asks at each price level. Depth Density isn’t an indicator but it’s displays grouped current buy and sell order limits on an exchange.
Depth Density is a tool that displays grouped current buy and sell order limits on an exchange.
The tool lets you see the amount of supply and demand at different price points.
So, if you want to sell your Bitcoin, you’ll need to click the ‘Sell’ button, and the exchange will match your order with the nearest buy order on the BID side. And it’s the same with the other way around. If you urgently need to buy, your dollars will go to the order book to look for the best sell price on the ASK side.
These are simple, clear and real market mechanisms: purchases are done using sell orders, and sales are done using buy orders.
Conclusion
If you understand basic concepts like BID, ASK and SPREAD, you can grasp the true meaning of how the market works and make good decisions about why crypto prices change. To really master ‘market mechanics’, a trader needs the right tools.
You can analyse your order book with Depth Density, BAS or HIPPO. You can see how market and limit orders influence the price if you open a cluster chart in RTT. Use this data, add a solid trading plan and follow risk-management rules — and the crypto market can become a source of consistent profit.
There’s no need to invent complicated schemes or look for the ‘holy grail’. Use the tools on the Resonance platform.
No need to invent complex schemes or hunt for the “grail”. Use the tools of the Resonance platform.
Sign up on exchanges via our links and get bonuses:
OKX | BingX | KuCoin.
Prop firm — trade with the company’s capital: Kraken.
Promo code TOPBLOG gives you 10% off any Resonance plan.
Once you understand how order flow forms the real market structure, concepts like ask and bid in crypto stop being abstract definitions. The spread in crypto becomes a clear reflection of how aggressively buyers and sellers compete at each moment, and the crypto spread shows where liquidity truly sits. These mechanics reveal much more than any technical indicator, because they display the actual interaction of market and limit orders. When you combine cluster charts, order-book data and depth metrics, each volume shift becomes a reliable indicator of supply and demand — a way to see real market processes instead of guessing by candle patterns.
Recommended articles