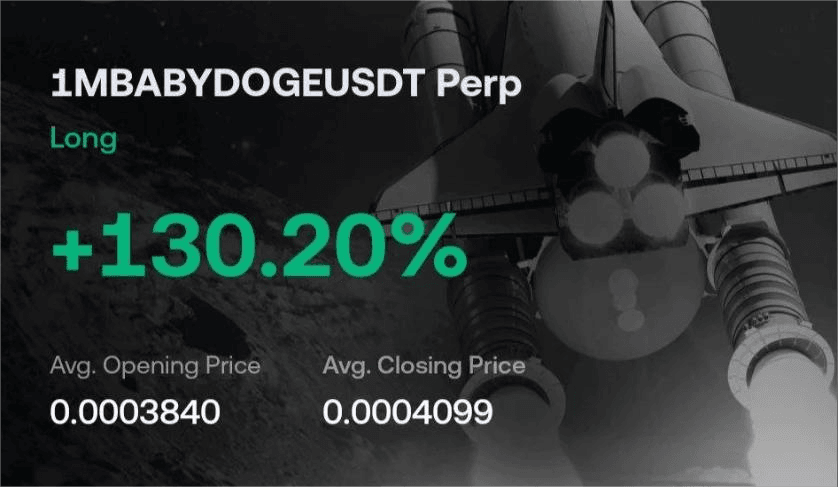
1MBABYDOGE +130.20% (Resonance Directional Strategy)

A breakdown of the 1MBABYDOGE trade using the cluster chart, supply and demand analysis, and Resonance platform tools. We show how selling absorption, deficit, and a range breakout help identify strong long entry points.
Table of contents

In this 1MBABYDOGE trade, the key factor was not the coin’s price increase itself, but the way price behaved against the backdrop of active selling. Cluster analysis showed that market supply was being systematically absorbed, which meant demand was still holding the initiative. In the logic of supply and demand analysis, this is an important sign that the market is showing a local deficit.
To find this setup, Resonance platform tools were used, including the screener and the cluster chart.
Entry reasons
Cluster chart: absorption of selling
Market sells were being systematically absorbed (green boxes), while price maintained a bullish structure (green arrow). This pointed to the presence of steady demand and the formation of a local deficit.
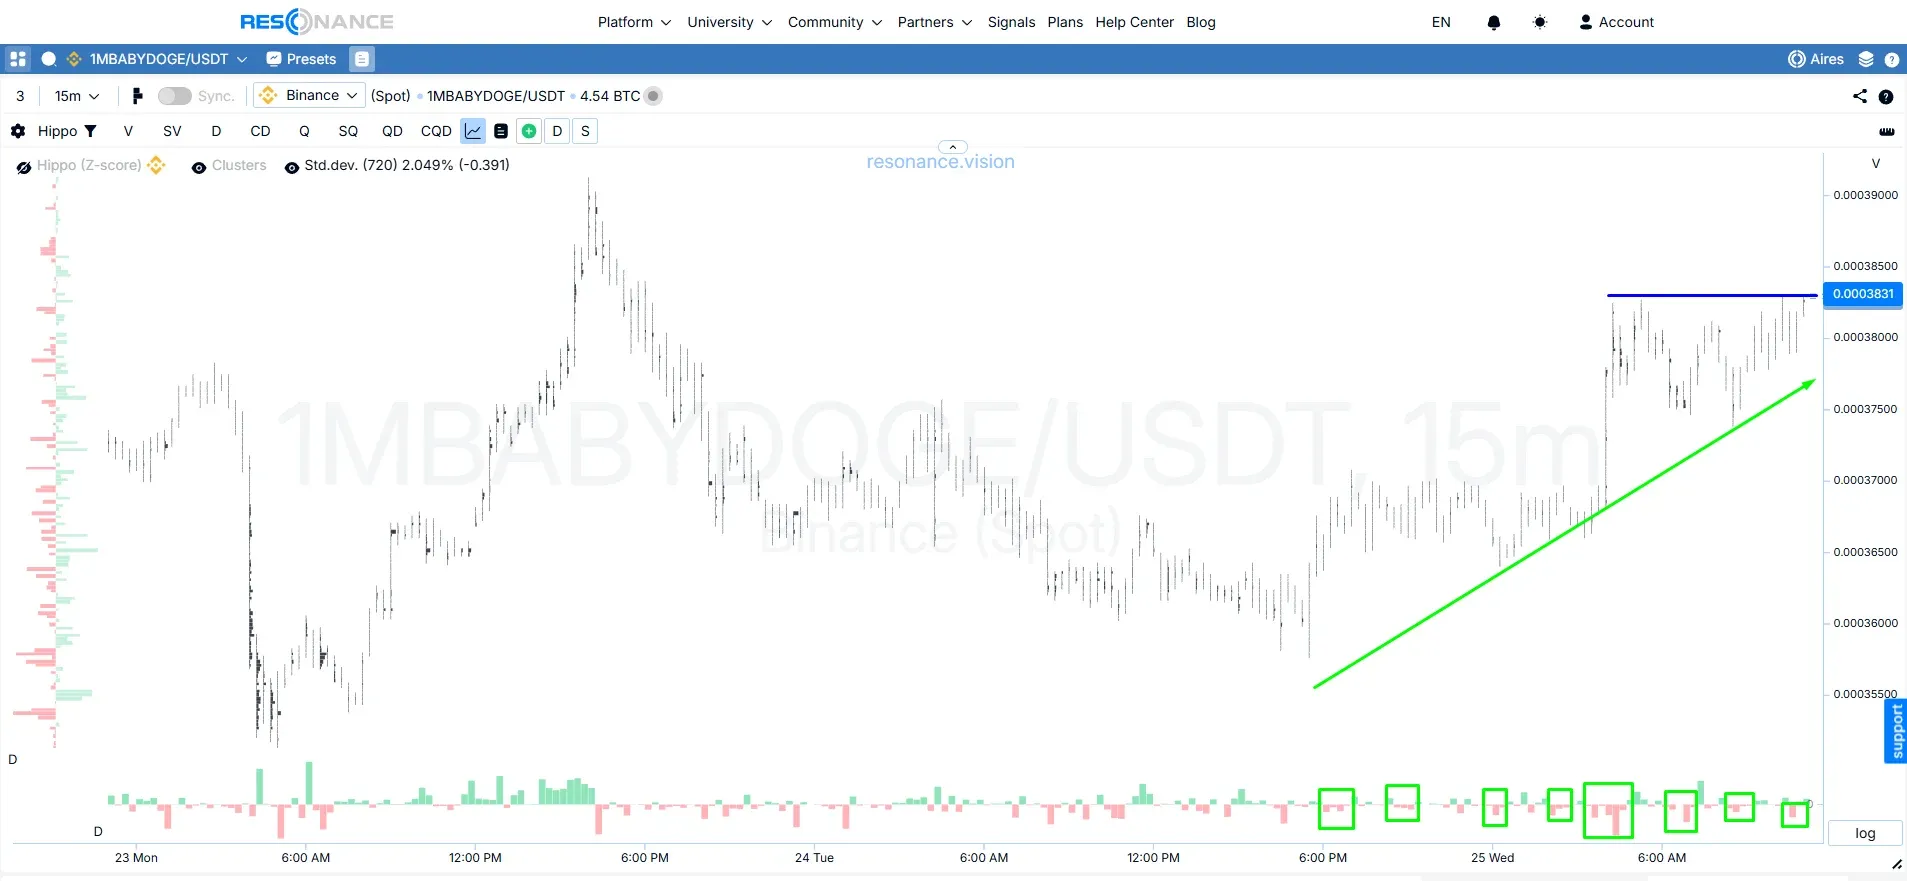
In addition, price was pressing up against the upper boundary (blue line). This kind of structure often forms when supply is gradually being exhausted while the buyer continues to apply pressure.
The entry was made on the breakout above the range, since that is the point where the probability of continuation is the highest.
Risk management:
The stop-loss was placed beyond the boundary of the range. A move back below the traded range would have invalidated the continuation scenario.
Exit reasons: move realization
Cluster chart: the position was closed at a predefined take-profit with a 1:2 risk-to-reward ratio.
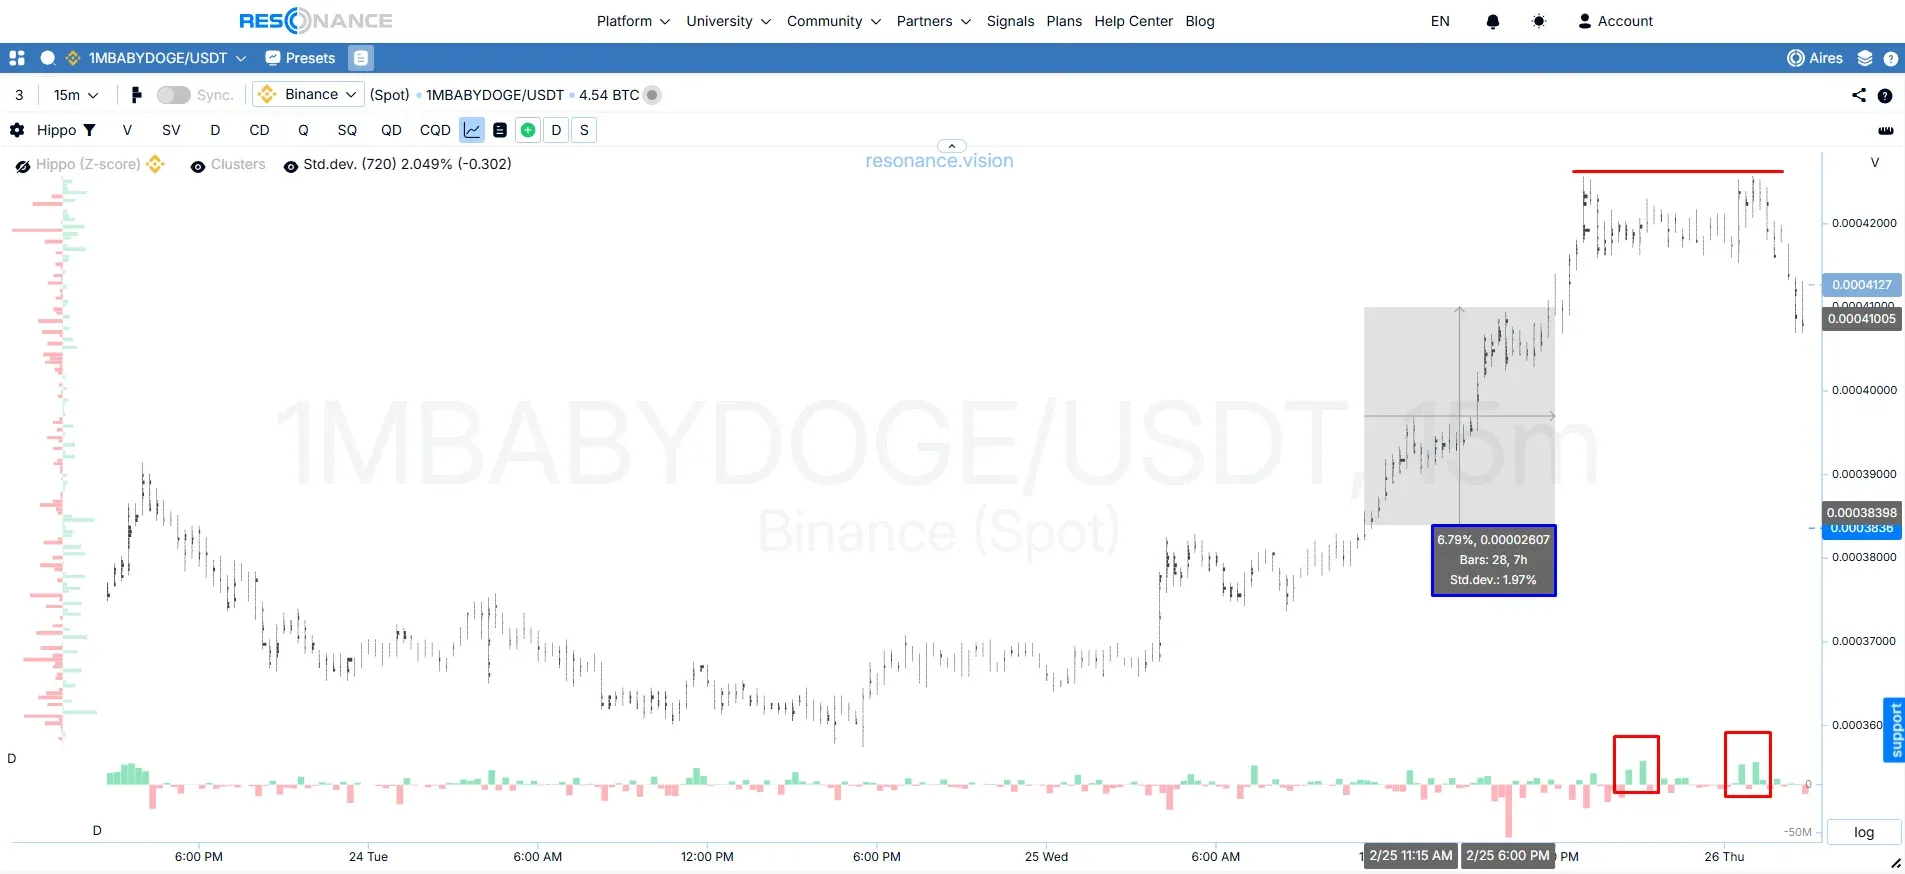
The move played out quickly, which is typical of intraday momentum scenarios.
Trade conclusion
It was possible to lock in about 6.7% of net movement.
The idea was based on the persistence of deficit: selling was not affecting the price, while the structure of the move pointed to readiness for further upside. The breakout from the range became the point where that advantage was realized.
At the same time, the subsequent development showed that the move had more potential: at a later stage, buying stopped pushing the price upward efficiently (red boxes), which created a stronger signal to take profits. In momentum scenarios, actively managing the position can make it possible to capture a larger portion of the move when opposing signs begin to appear.
This is exactly where the practical value of the Resonance approach lies: not in looking for template chart formations, but in using Resonance platform tools to assess how demand, supply, deficit, and surplus reveal themselves in real price movement. The cluster chart and other platform tools make it possible to see in time when selling is being absorbed, when the market is ready to continue the impulse, and when that advantage begins to weaken.
Follow new insights in our telegram channel.
No need to invent complex schemes and look for the "grail". Use the Resonance platform tools.
Register via the link — get a bonus and start earning:
OKX | BingX | KuCoin.
Promo code TOPBLOG gives you a 10% discount on any Resonance tariff plan.
Recommended articles


