ADA +38.94% (Resonance Directional Strategy)

A trade analysis using cluster analysis, delta, and limit delta: how market selling inefficiencies allowed for the identification of a local shortfall and the opening of a position, while the return of seller efficiency became a signal to take profits after a nearly 40% gain.
Table of contents

Coin: ADA/USDT
Risk: High
Experience Level: Beginner
Entry Reasons
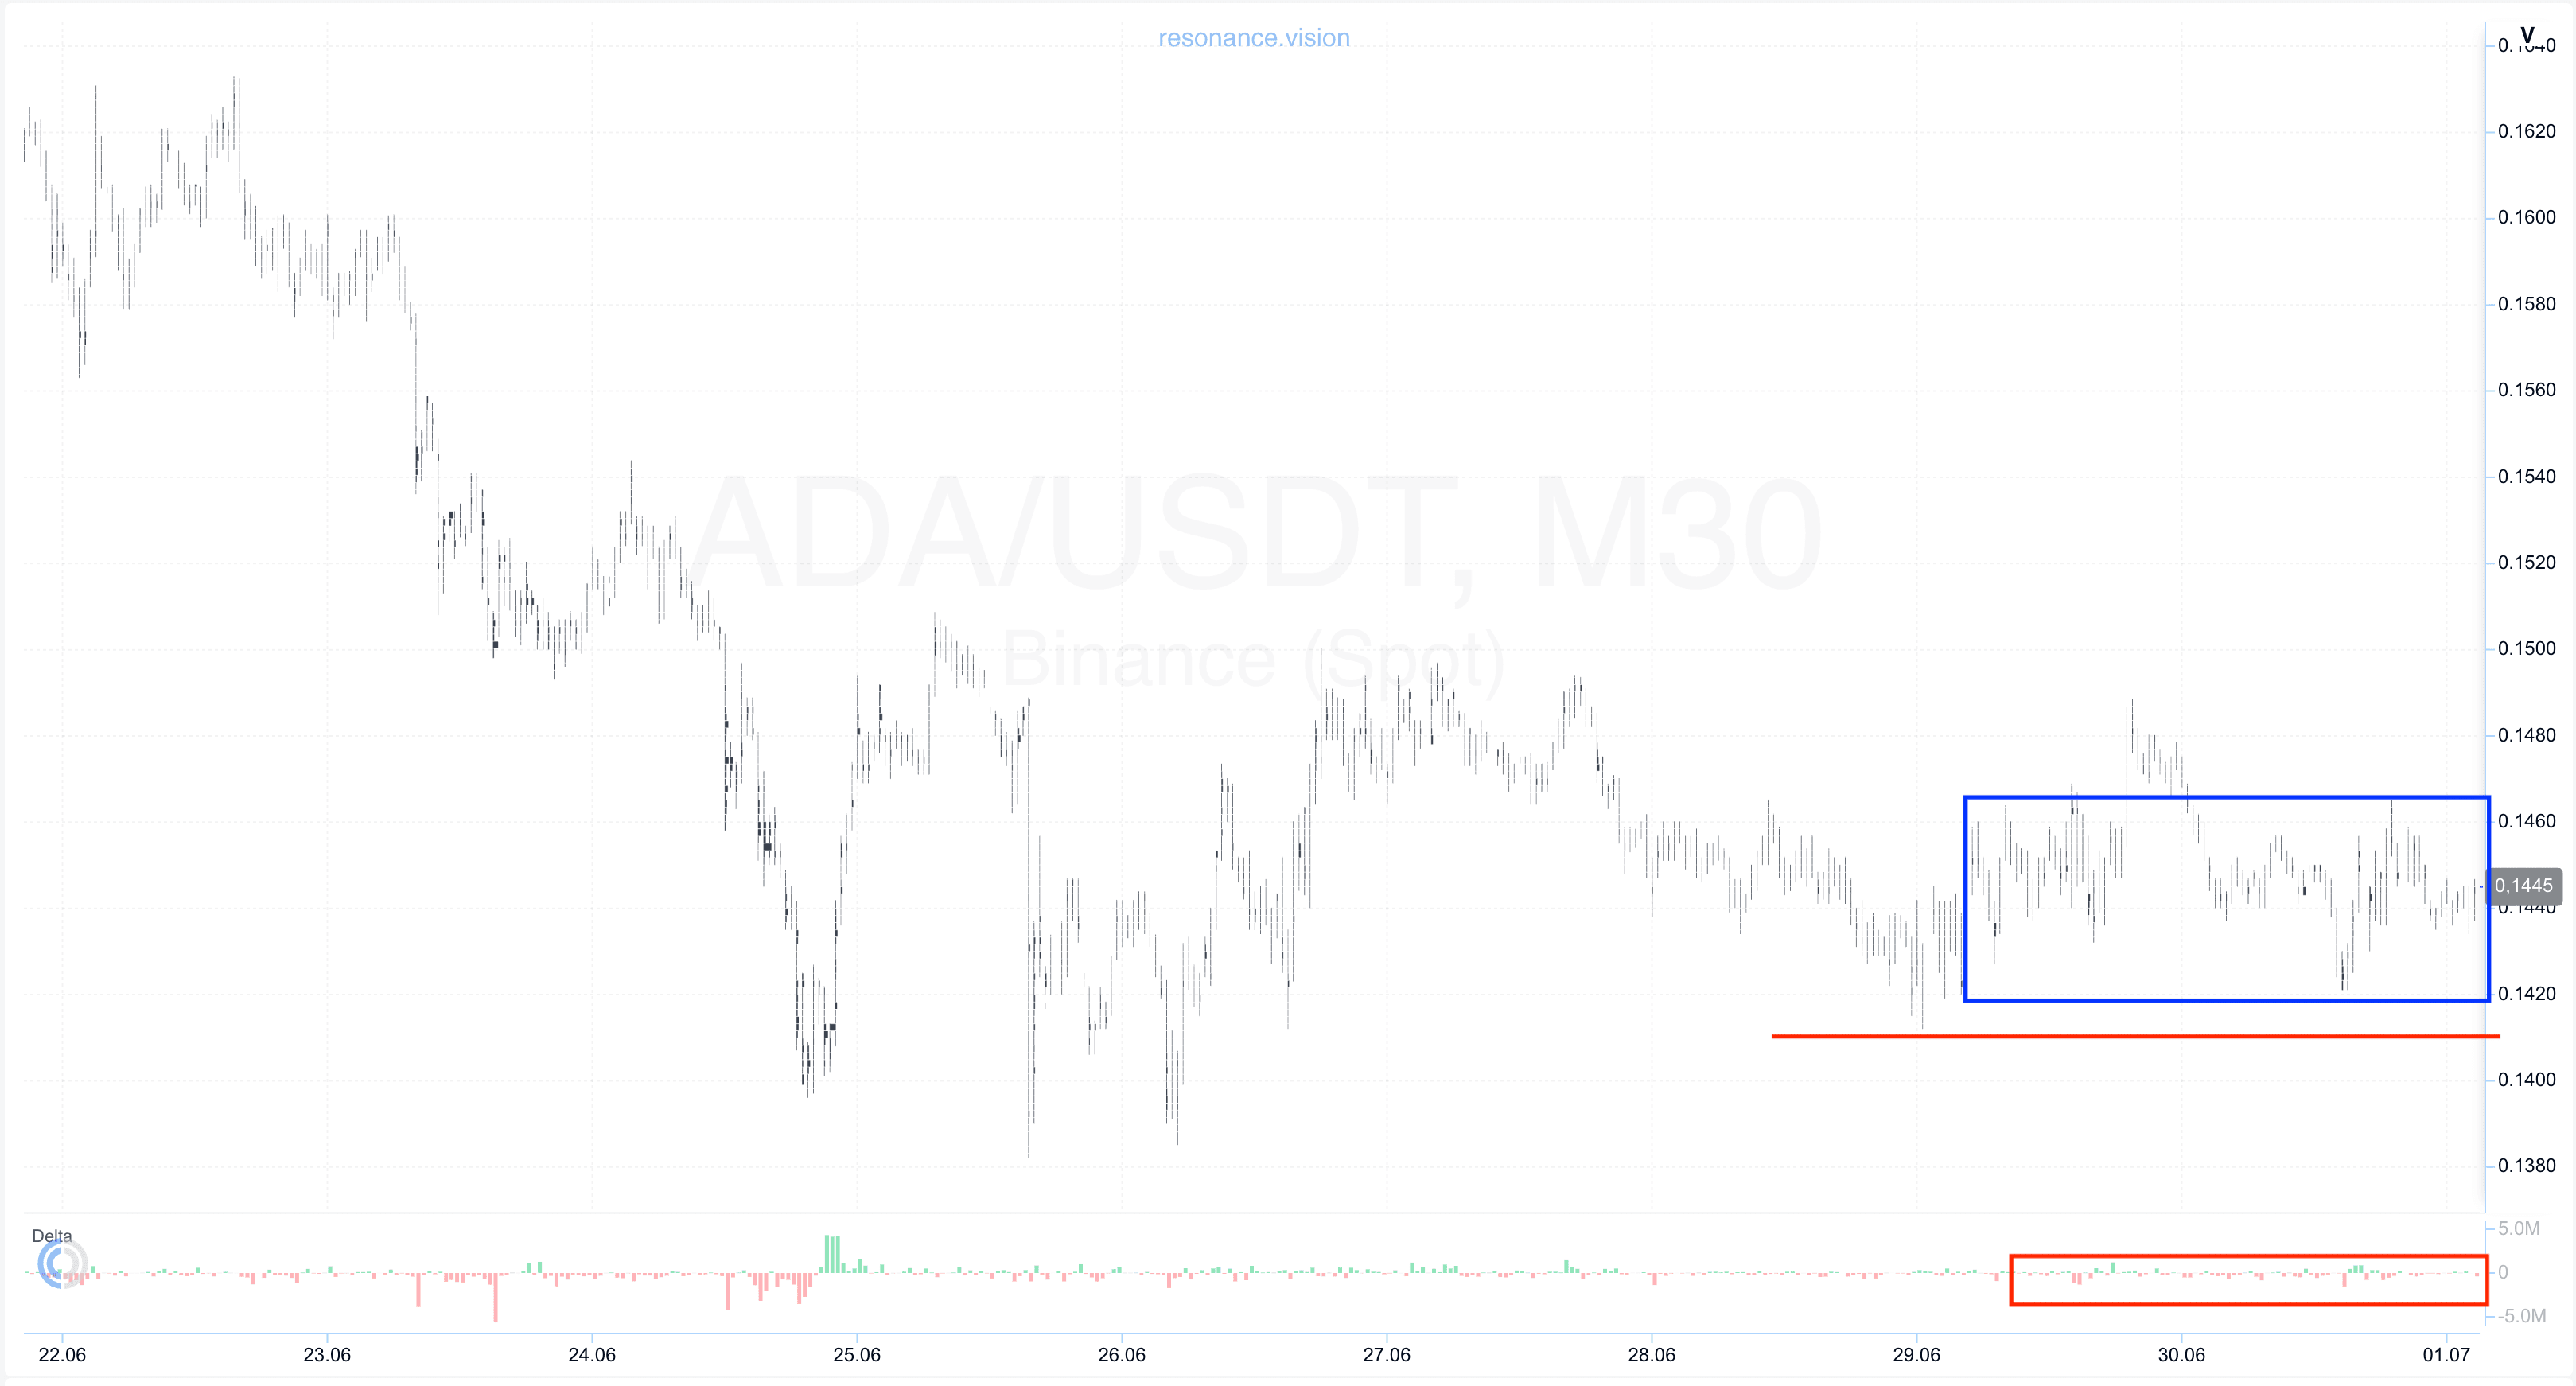
Cluster Chart: During the sideways consolidation phase, relatively large volume clusters began to form compared to the rest of the visible range (blue rectangle). Within these clusters, the final stage of the range showed a clear dominance of market sell orders (red rectangle), indicating strong selling activity and repeated attempts by sellers to continue the downtrend.
However, despite the persistent selling pressure, the effectiveness of sellers gradually weakened. The price stopped making new local lows (red line), showing that market sell orders were losing their ability to push the price lower. In other words, sellers continued to expend significant volume, but the incoming supply was being successfully absorbed by opposing demand.
This divergence between trading volume and price reaction is one of the clearest signs of a shift in market balance. When substantial market selling no longer results in new lows, it often signals the emergence of a local supply deficit.
Dashboard
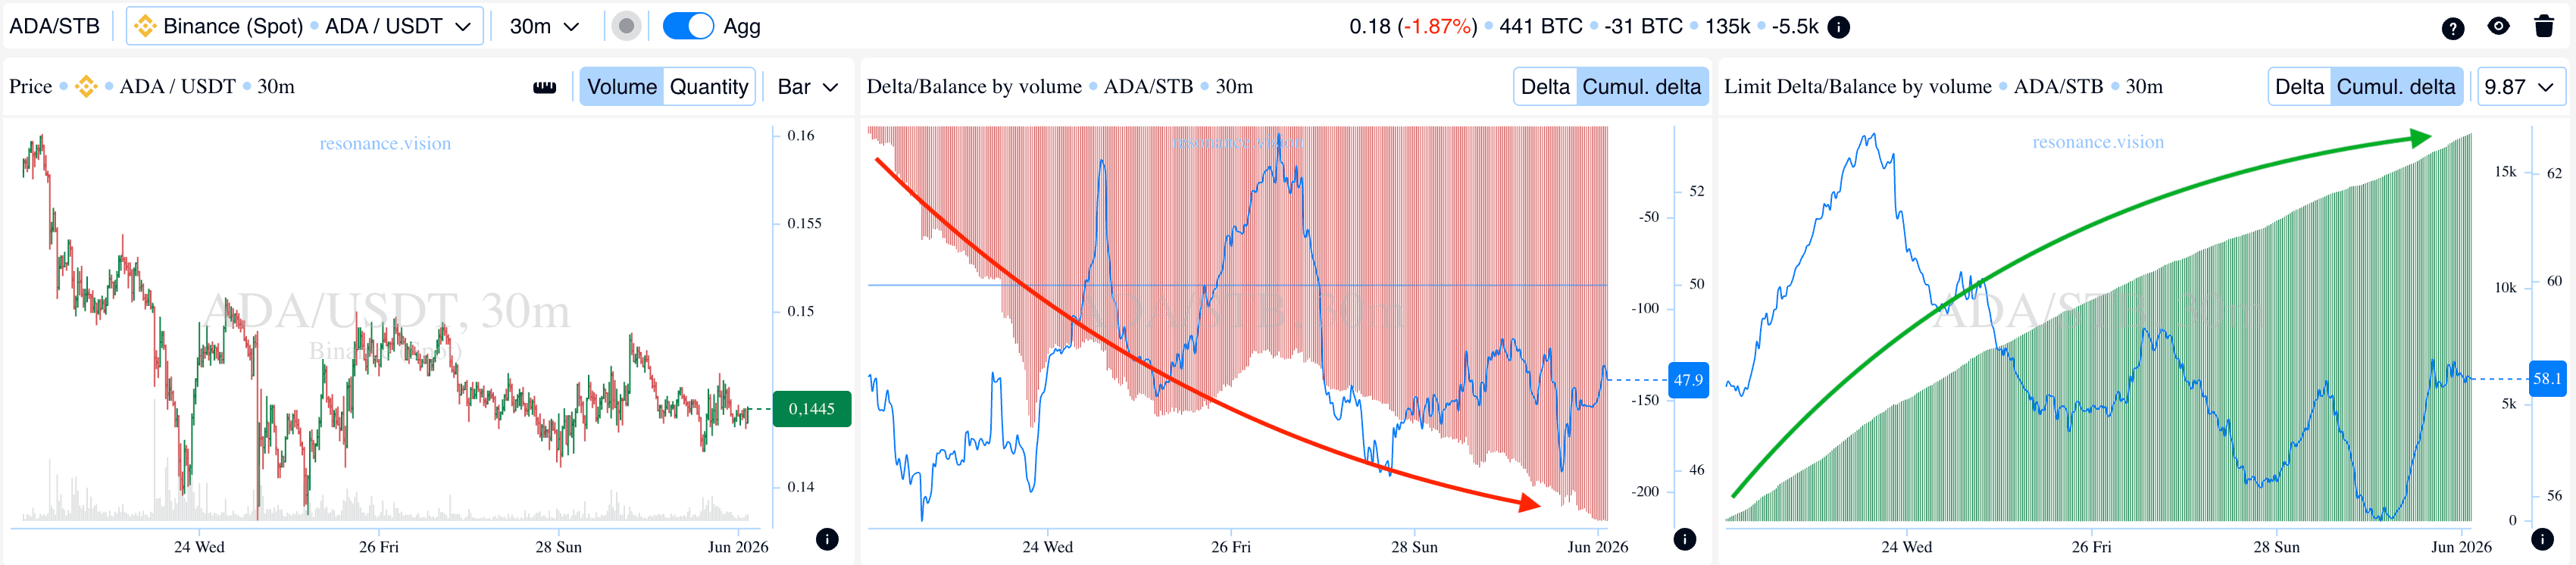
Delta / Volume Balance & Limit Delta: Aggregated data across all exchanges and trading pairs confirmed the observations from the cluster chart. Throughout the analyzed period, cumulative market selling pressure continued to increase, clearly reflected in the cumulative delta histogram (red rectangle), with selling activity reaching progressively higher levels.
Despite the growing market selling pressure, the price failed to produce a comparable downward reaction, further confirming the declining effectiveness of sellers and the presence of strong opposing demand.
At the same time, the cumulative limit delta showed a steady increase in buy limit orders (green rectangle). This indicates that incoming market sell orders were actively absorbed by limit buyers willing to accumulate positions within the current price range.
This combination of signals points to the formation of local support and a gradual shift in market balance toward buyers. When aggressive selling loses its ability to move the market lower, the probability of a bullish continuation increases significantly.
Exit Reasons
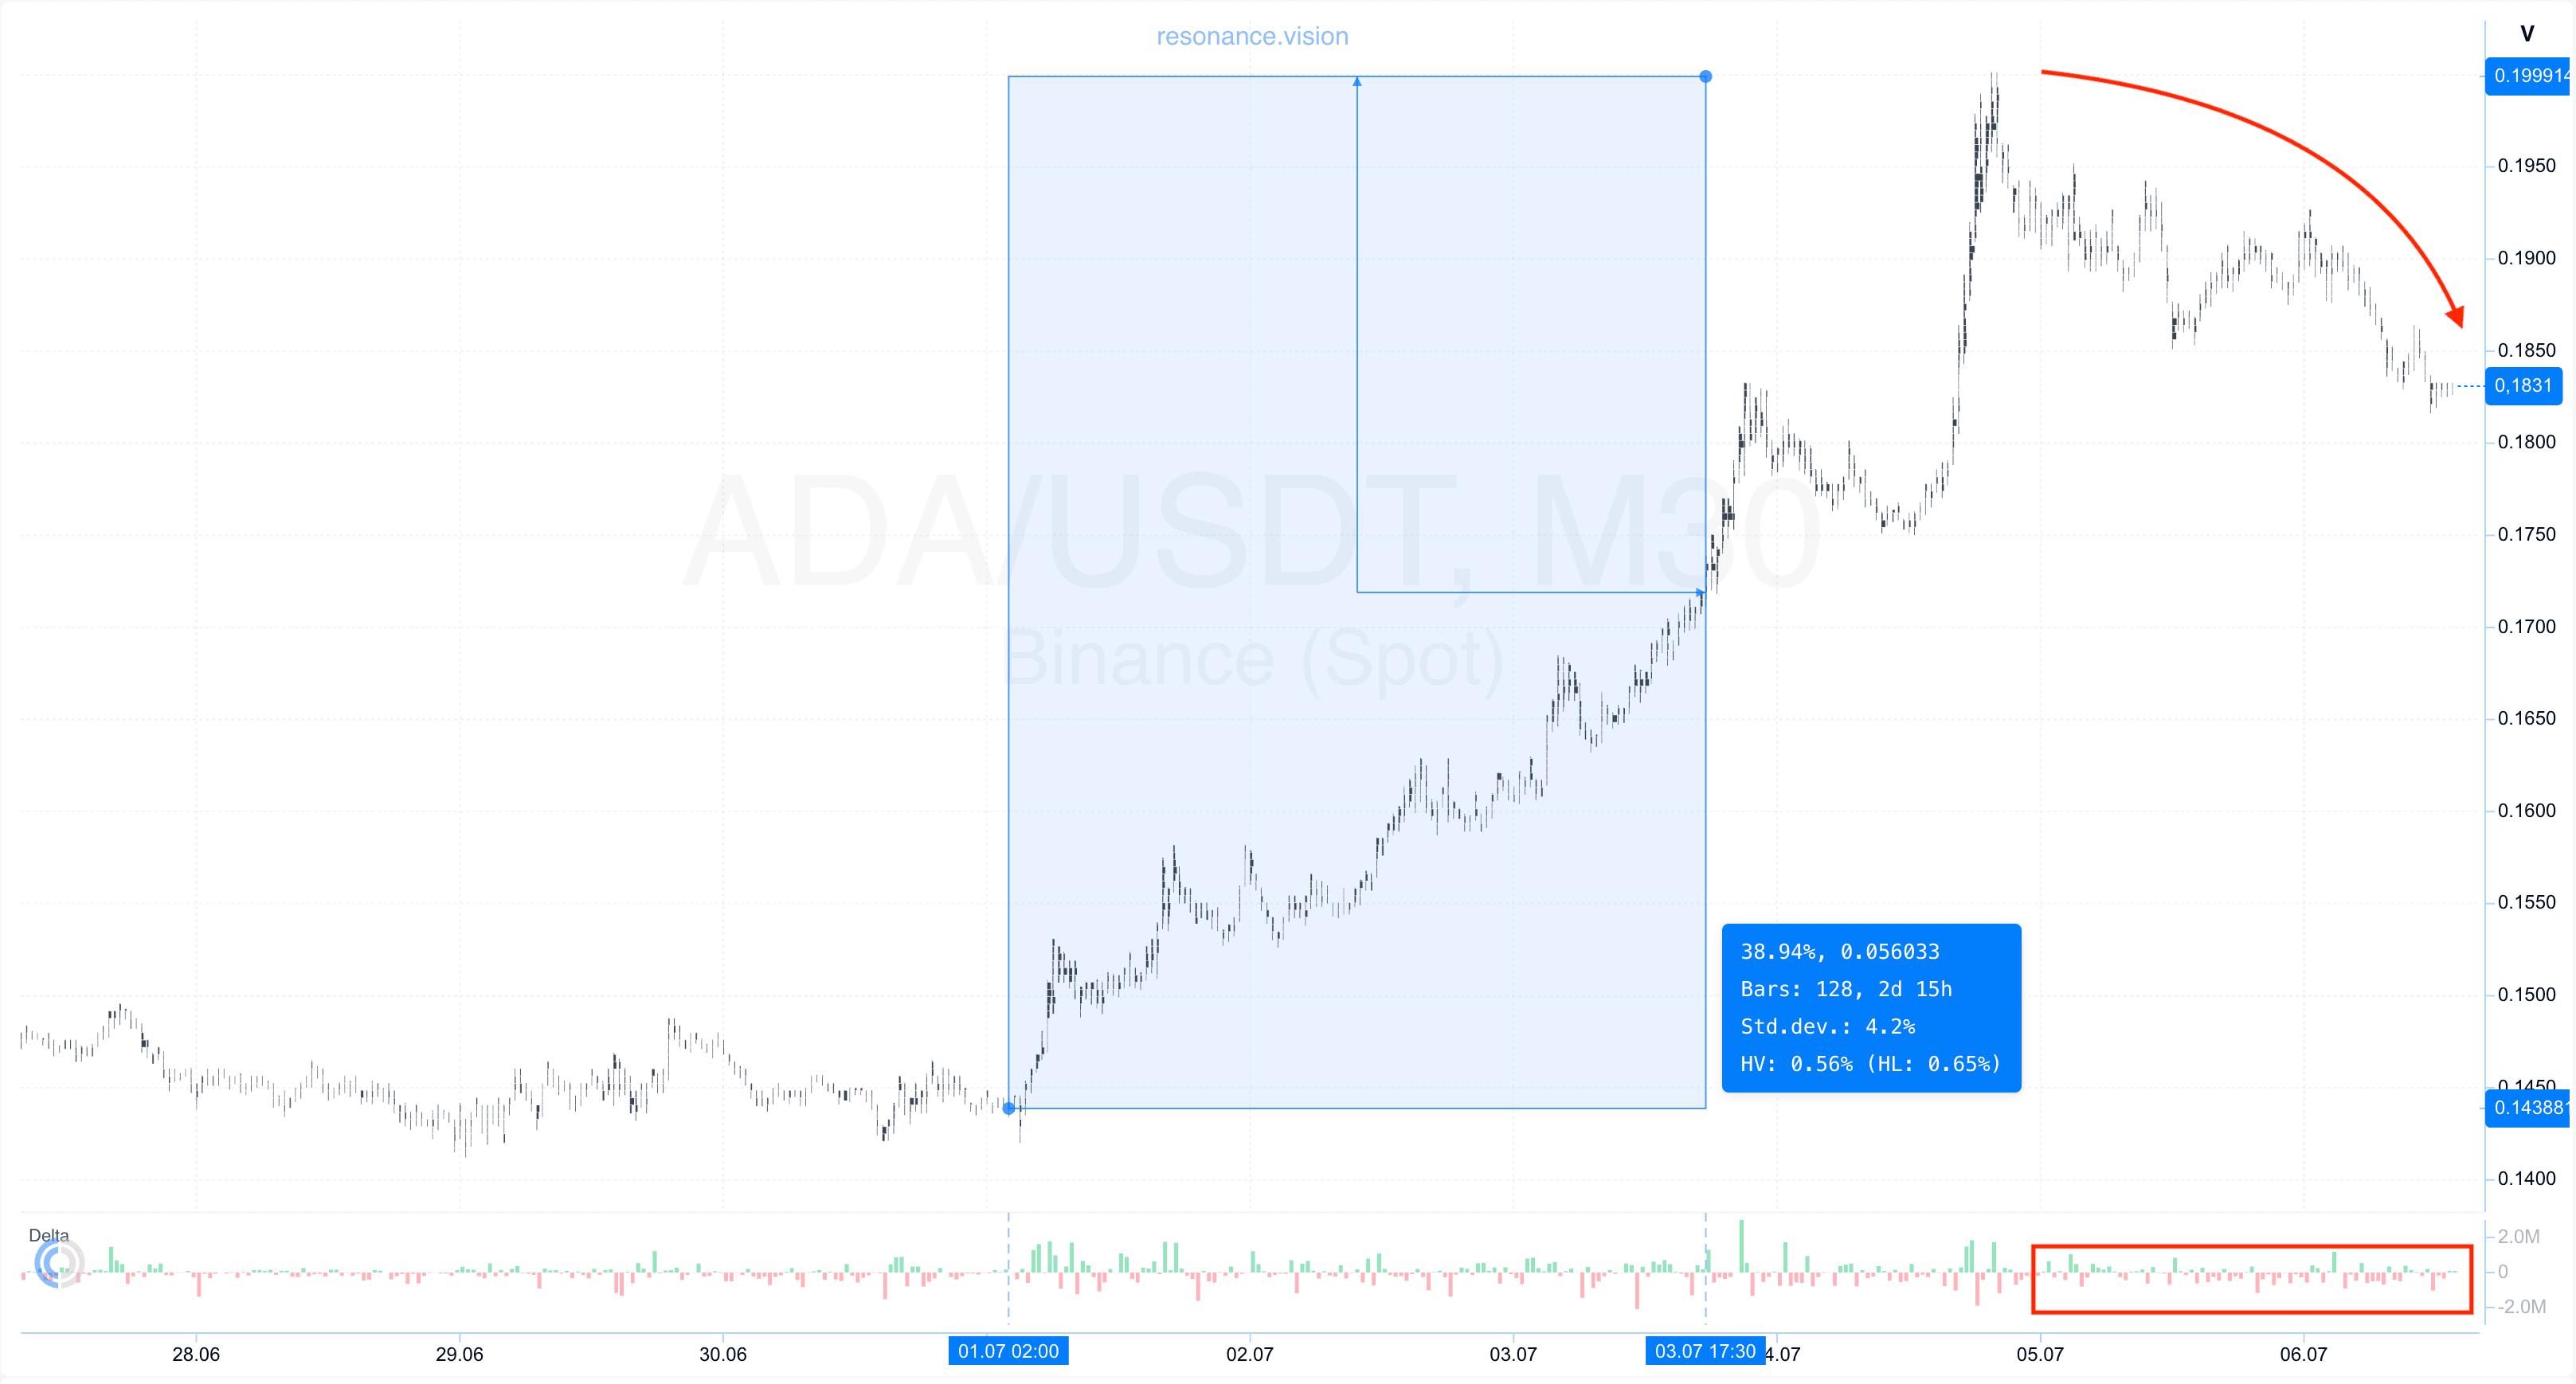
Cluster Chart: From the entry point, the price advanced by nearly 40%, fully validating the original trading thesis and producing a strong directional move.
After reaching a local high, the character of the market gradually began to change. A consistent decline developed, during which market sell orders once again became effective in pushing the price lower. Each new wave of selling resulted in additional downside movement (red rectangle and arrow), indicating that sellers were regaining control.
This shift suggests the emergence of signs of a local supply surplus. Unlike the entry setup, sellers were once again able to influence price effectively, reflecting a change in the short-term market balance and increasing the probability of a deeper correction or a transition into a consolidation phase.
Under these conditions, continuing to hold the position involved significantly higher risk. Therefore, taking profits after a move of nearly 40% was a logical and well-founded decision from both a risk management and capital preservation perspective.

Conclusion
This case study clearly demonstrates that the key factor in market analysis is not the volume itself, but its effectiveness and impact on price.
At the entry stage, the market remained under persistent pressure from market sellers, yet the price stopped making new lows. This indicated weakening selling efficiency and active absorption of selling volume by limit buyers, leading to the formation of a local supply deficit and a gradual shift in market balance toward buyers.
Additional confirmation came from the Dashboard, where increasing market selling was accompanied by a steady rise in buy limit orders, signaling the formation of local support and the presence of strong opposing demand.
Following the entry, the market delivered the expected move, gaining nearly 40%. As the trend developed, however, the market structure began to change. Sellers once again became effective in driving the price lower, and the market entered a phase of steady decline, indicating the emergence of a local supply surplus and an increasing probability of a deeper correction.
In summary, the trade entry was based on signs of a local supply deficit and declining seller efficiency, while the exit was driven by the recovery of seller effectiveness and a short-term shift in market balance in favor of sellers. Analyzing the relationship between trading volume and price reaction allows traders to identify shifts in market control early and make more consistent, objective trading decisions.
Follow new insights in our telegram channel.
No need to invent complex schemes and look for the "grail". Use the Resonance platform tools.
Register via the link — get a bonus and start earning:
OKX | BingX | KuCoin.
Promo code TOPBLOG gives you a 10% discount on any Resonance tariff plan.
Recommended articles