AWE +227.62% (Resonance Directional Strategy)

A detailed breakdown of an AWE short trade using the cluster chart, supply and demand analysis, delta, volume balance, and aggregated metrics. We show how volume analysis in trading helps identify a surplus and assess the effectiveness of market buying.
Table of contents

This idea formed after a strong impulsive move upward. The main task was to assess whether the buyer was still in control or whether a surplus was already beginning to form in the market. Despite continued buying, its impact on price weakened, which created the conditions for a short-term intraday short trade.
Entry reasons
1. Cluster chart
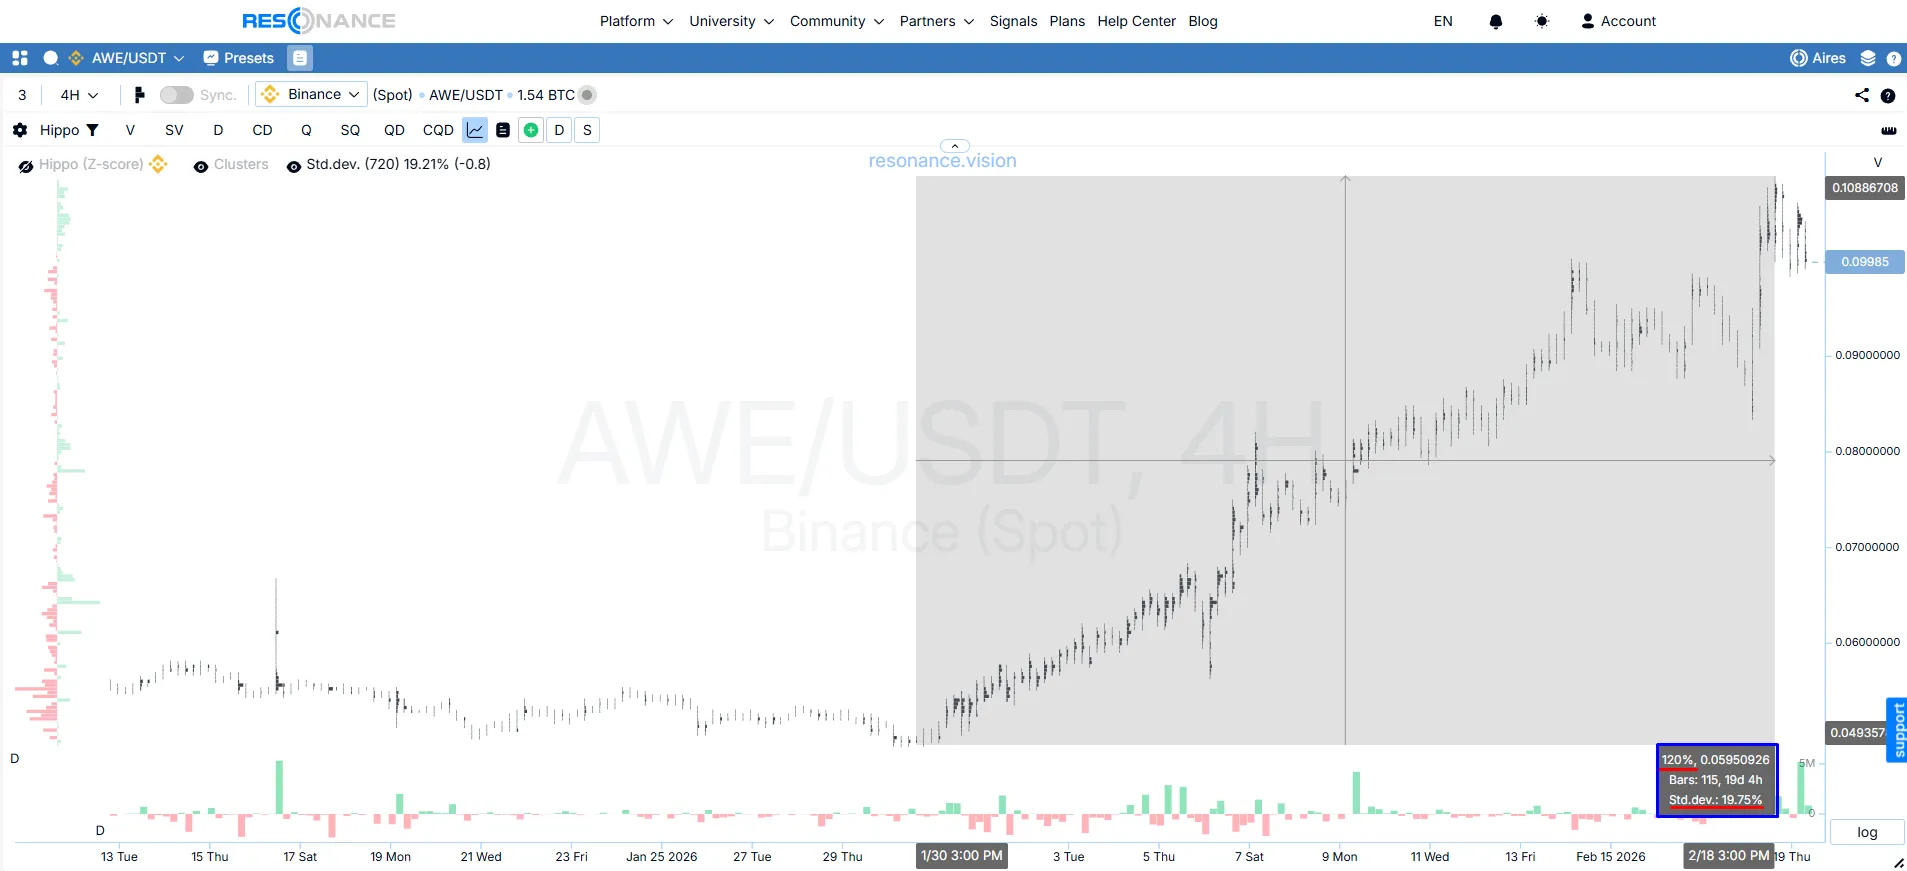
What first caught attention in the screener was the asset’s 120% rise — nearly 6 standard upward moves (blue box). After impulses like this, the probability of a surplus forming often increases, as more participants become willing to lock in profits.
After switching to the 30-minute timeframe, the cluster chart showed that high activity from the market buyer was still present (green box), but it was no longer leading to further price growth. On the contrary, local highs started to decline (red line).
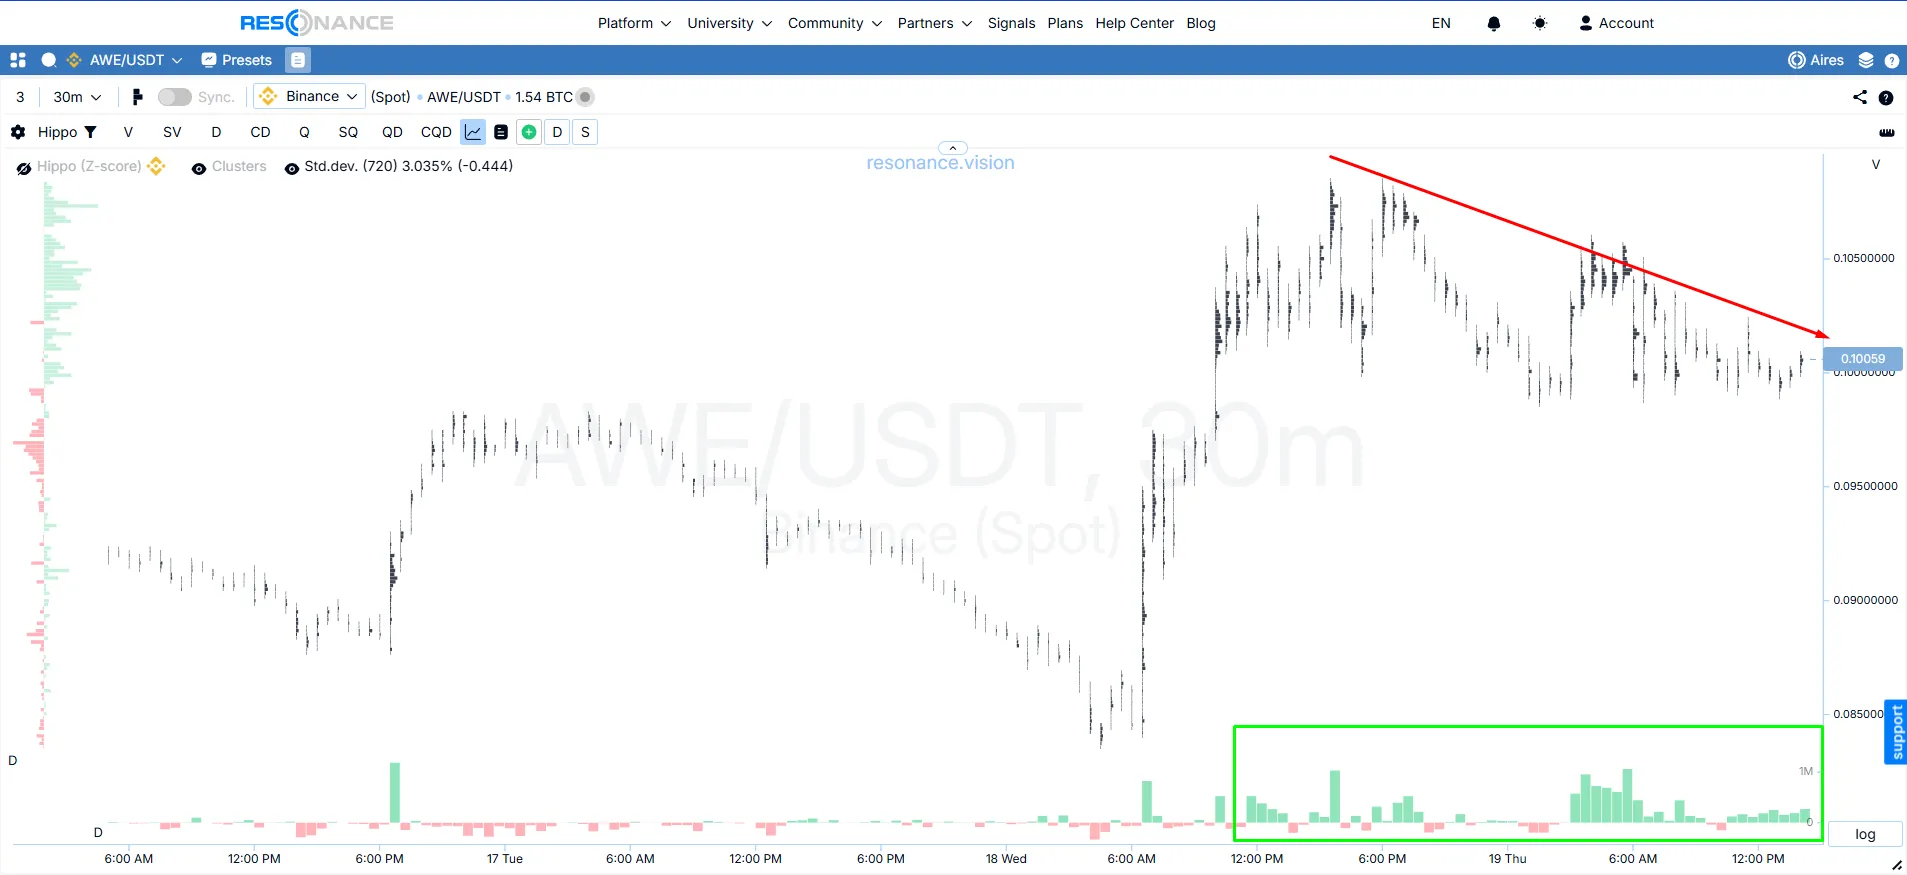
This points to the presence of large limit supply: buying is being systematically absorbed. Within cluster analysis and supply and demand analysis, this is an important sign that the probability of a decline is starting to increase.
2. Dashboard: aggregated metrics
Delta / volume balance: confirmation
The aggregated data confirmed the picture seen on the cluster chart: large-scale buying did not lead to a continuation of the upward move and was absorbed by a limit seller. This points to the formation of a surplus.
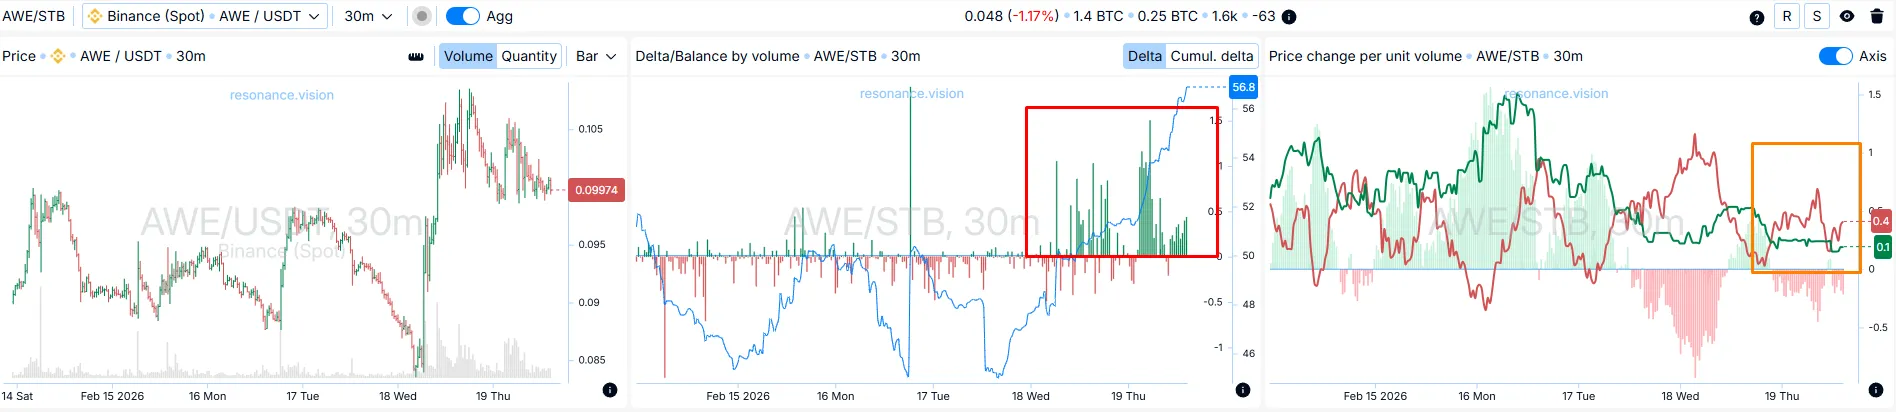
Price change per unit of volume
The efficiency of market orders shifted in favor of sellers (orange box), indicating more effective selling pressure.
The trade was planned from the start as a short-term one: a fixed take-profit and stop-loss were set at a 1:1 ratio, around 5%.
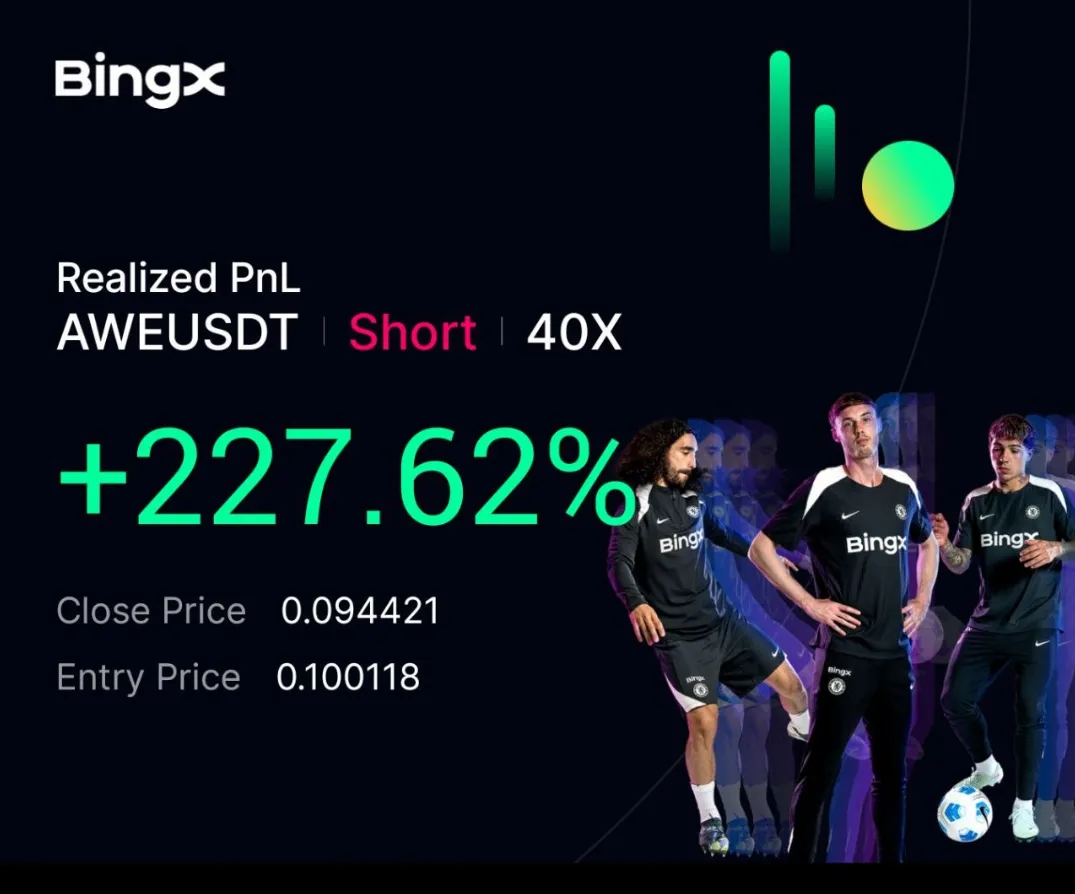
The decline played out fairly quickly, and the position was closed at take-profit with a result of about a 5.5% move. At the same time, the subsequent development of the situation showed a continuation of the decline, but the position had already been closed within the framework of the predefined scenario.
Trade conclusion
The AWE trade is a good example of how supply and demand analysis helps reveal buyer weakness even before a clear price reversal appears. The cluster chart showed that market buying had stopped pushing the price upward effectively. The dashboard and aggregated metrics confirmed this through delta, volume balance, and price change per unit of volume.
That is exactly where the practical value of the Resonance approach lies: not in searching for standard chart figures and patterns, but in assessing how volume actually affects price. This is why cluster analysis and volume analysis in trading make it possible to find strong trading setups.
Follow new insights in our telegram channel.
No need to invent complex schemes and look for the "grail". Use the Resonance platform tools.
Register via the link — get a bonus and start earning:
OKX | BingX | KuCoin.
Promo code TOPBLOG gives you a 10% discount on any Resonance tariff plan.
Recommended articles


