CFX +15.1% (Directional Strategy Resonance)

A trade analysis based on cluster analysis and aggregated market data. We examine how the absorption of market sell orders, the growth of limit buy orders, and the change in volume efficiency helped determine the entry point and lock in profits in a timely manner.
Table of contents

Asset: CFX/USDT
Risk: medium
Level of understanding: beginner
Entry reasons
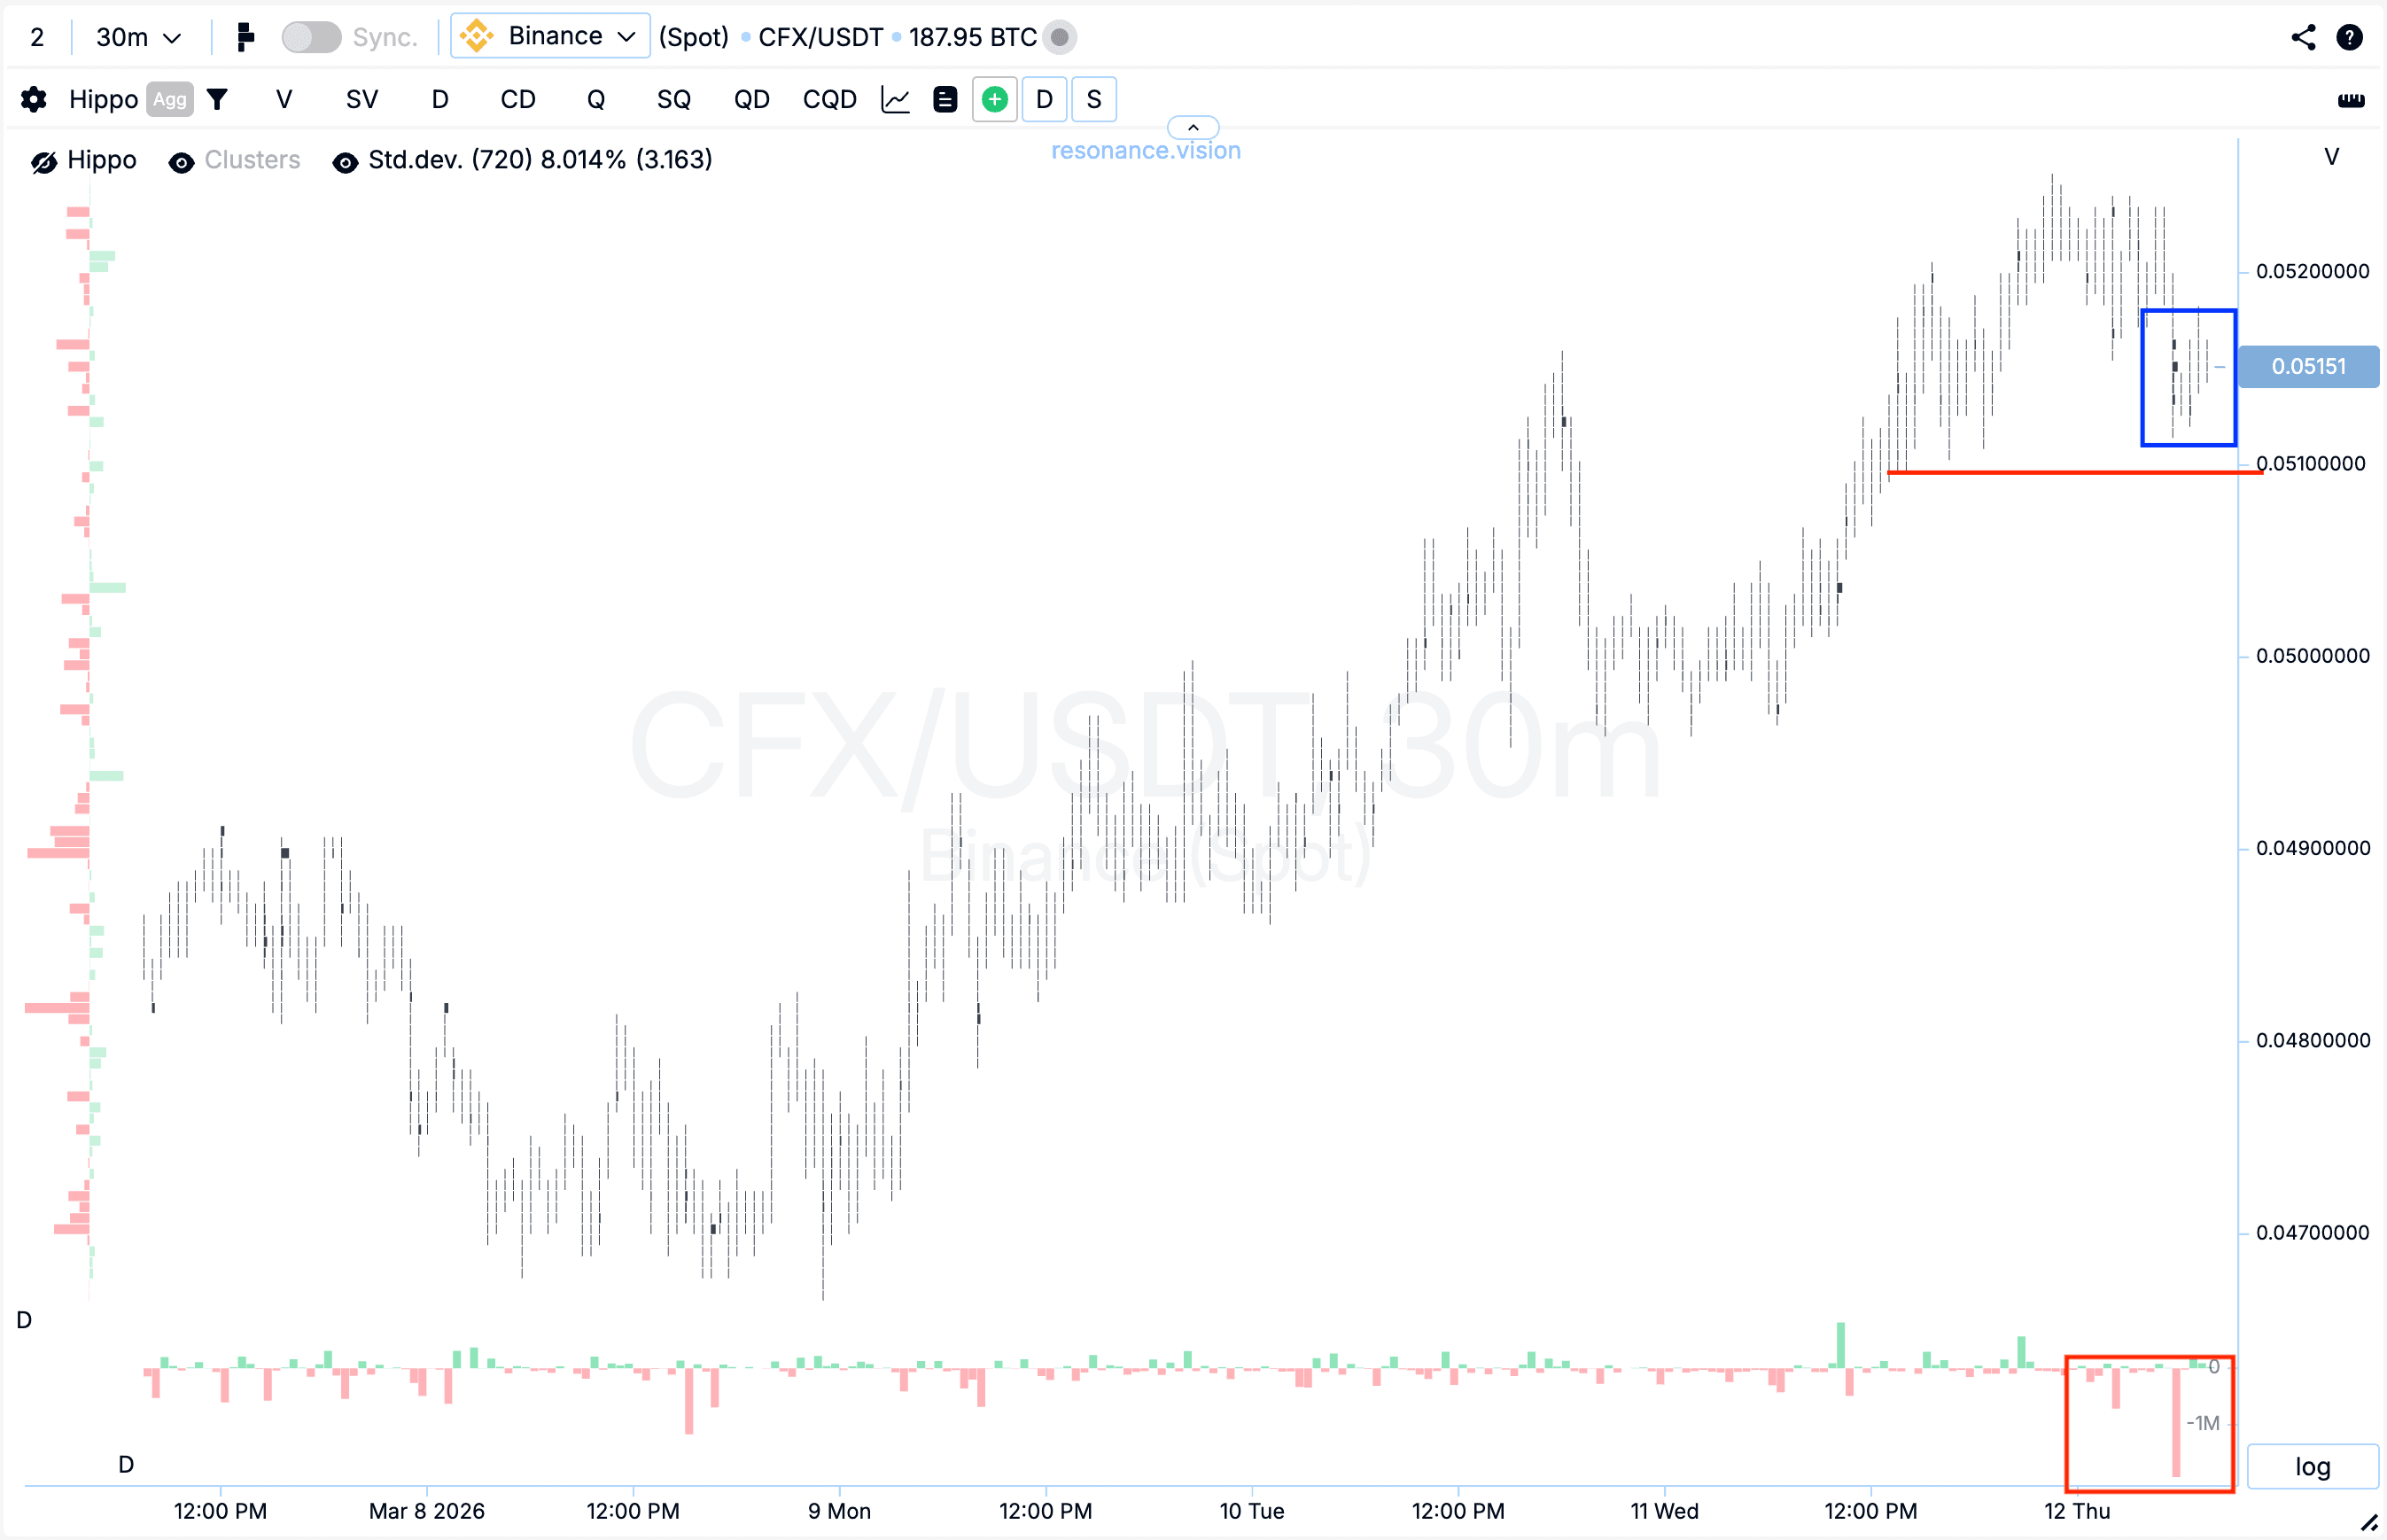
Cluster chart: during the local upward movement, volume clusters began to form (blue rectangle). Within these clusters, there was a significant dominance of market sell orders (red rectangle).
However, despite the substantial selling volume, the price reacted only with a minor decline and failed to update the local minimum (red line).
Such a reaction indicates the formation of signs of a local deficit and weakening seller initiative. When significant selling volumes stop pushing the price lower, it often becomes a signal of a possible shift in initiative or the formation of a local reversal.
In the Dashboard
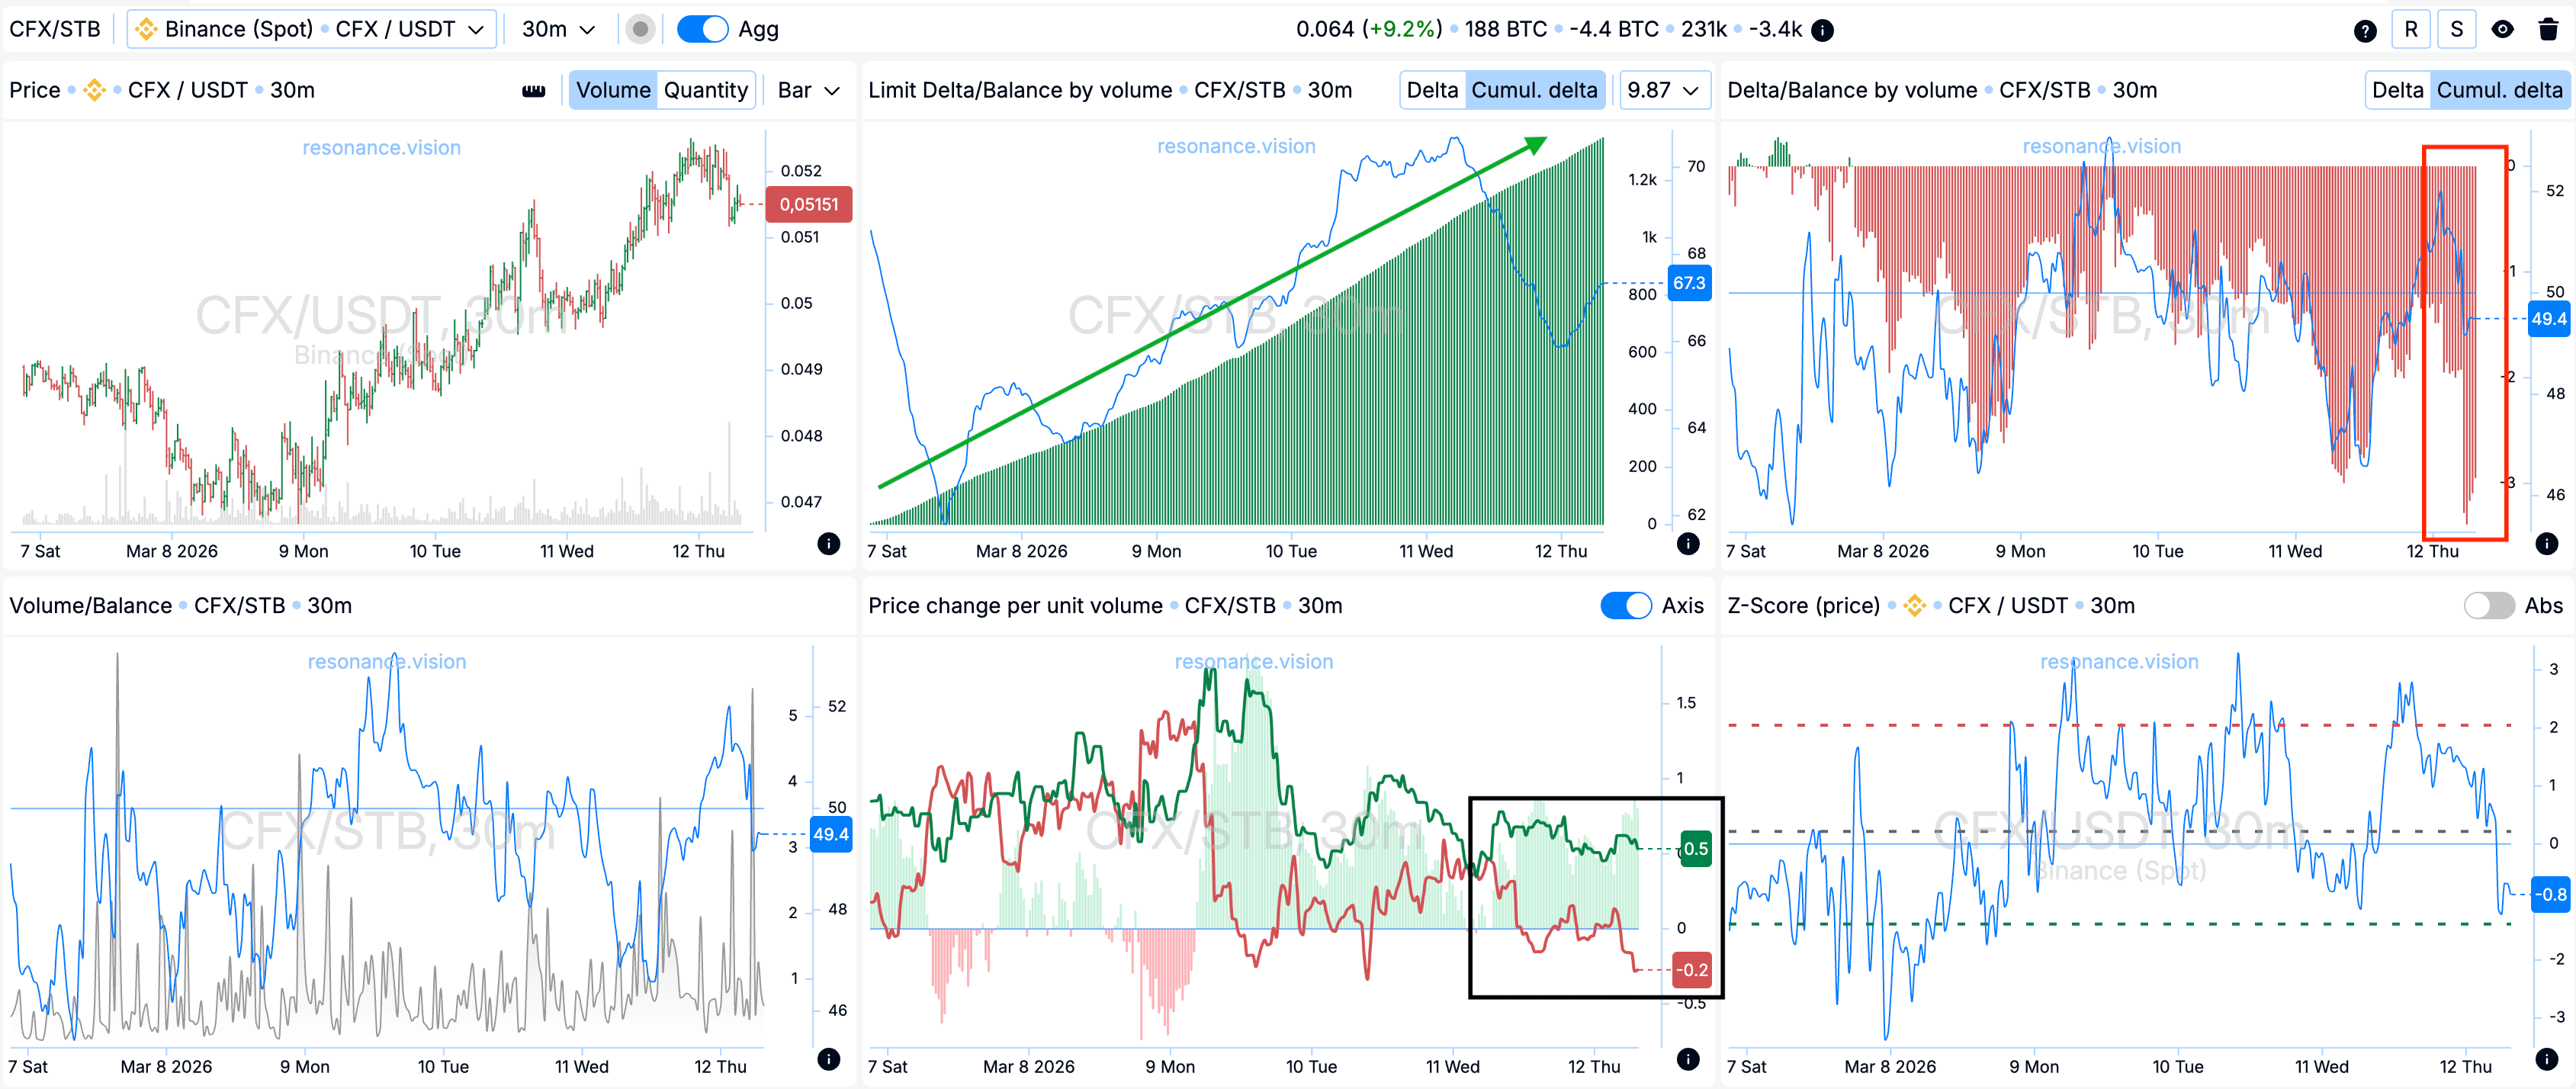
Delta / Volume balance and limit delta: aggregated data across all pairs and exchanges confirms the pattern observed on the cluster chart. During the analyzed period, there was sustained pressure from market sell orders, clearly reflected in the cumulative delta histogram. At the same time, the extreme values of selling continued to increase cumulatively (red rectangle).
Simultaneously, the limit delta showed a gradual and steady increase in the dominance of limit buy orders (green arrow).
Such a combination of signals indicates active absorption of incoming market sell volume by limit buyers. As a result, local support forms within the current range, further confirming signs of a supply deficit and a shift in balance toward buyers.
Price change per unit of volume: additionally, it can be observed that the effectiveness of market order impact shifted toward buyers (black rectangle).
Less volume is required for the price to move upward than for it to decline. This indicates higher efficiency on the buyers’ side and serves as an additional argument for opening a long position.
Exit reasons
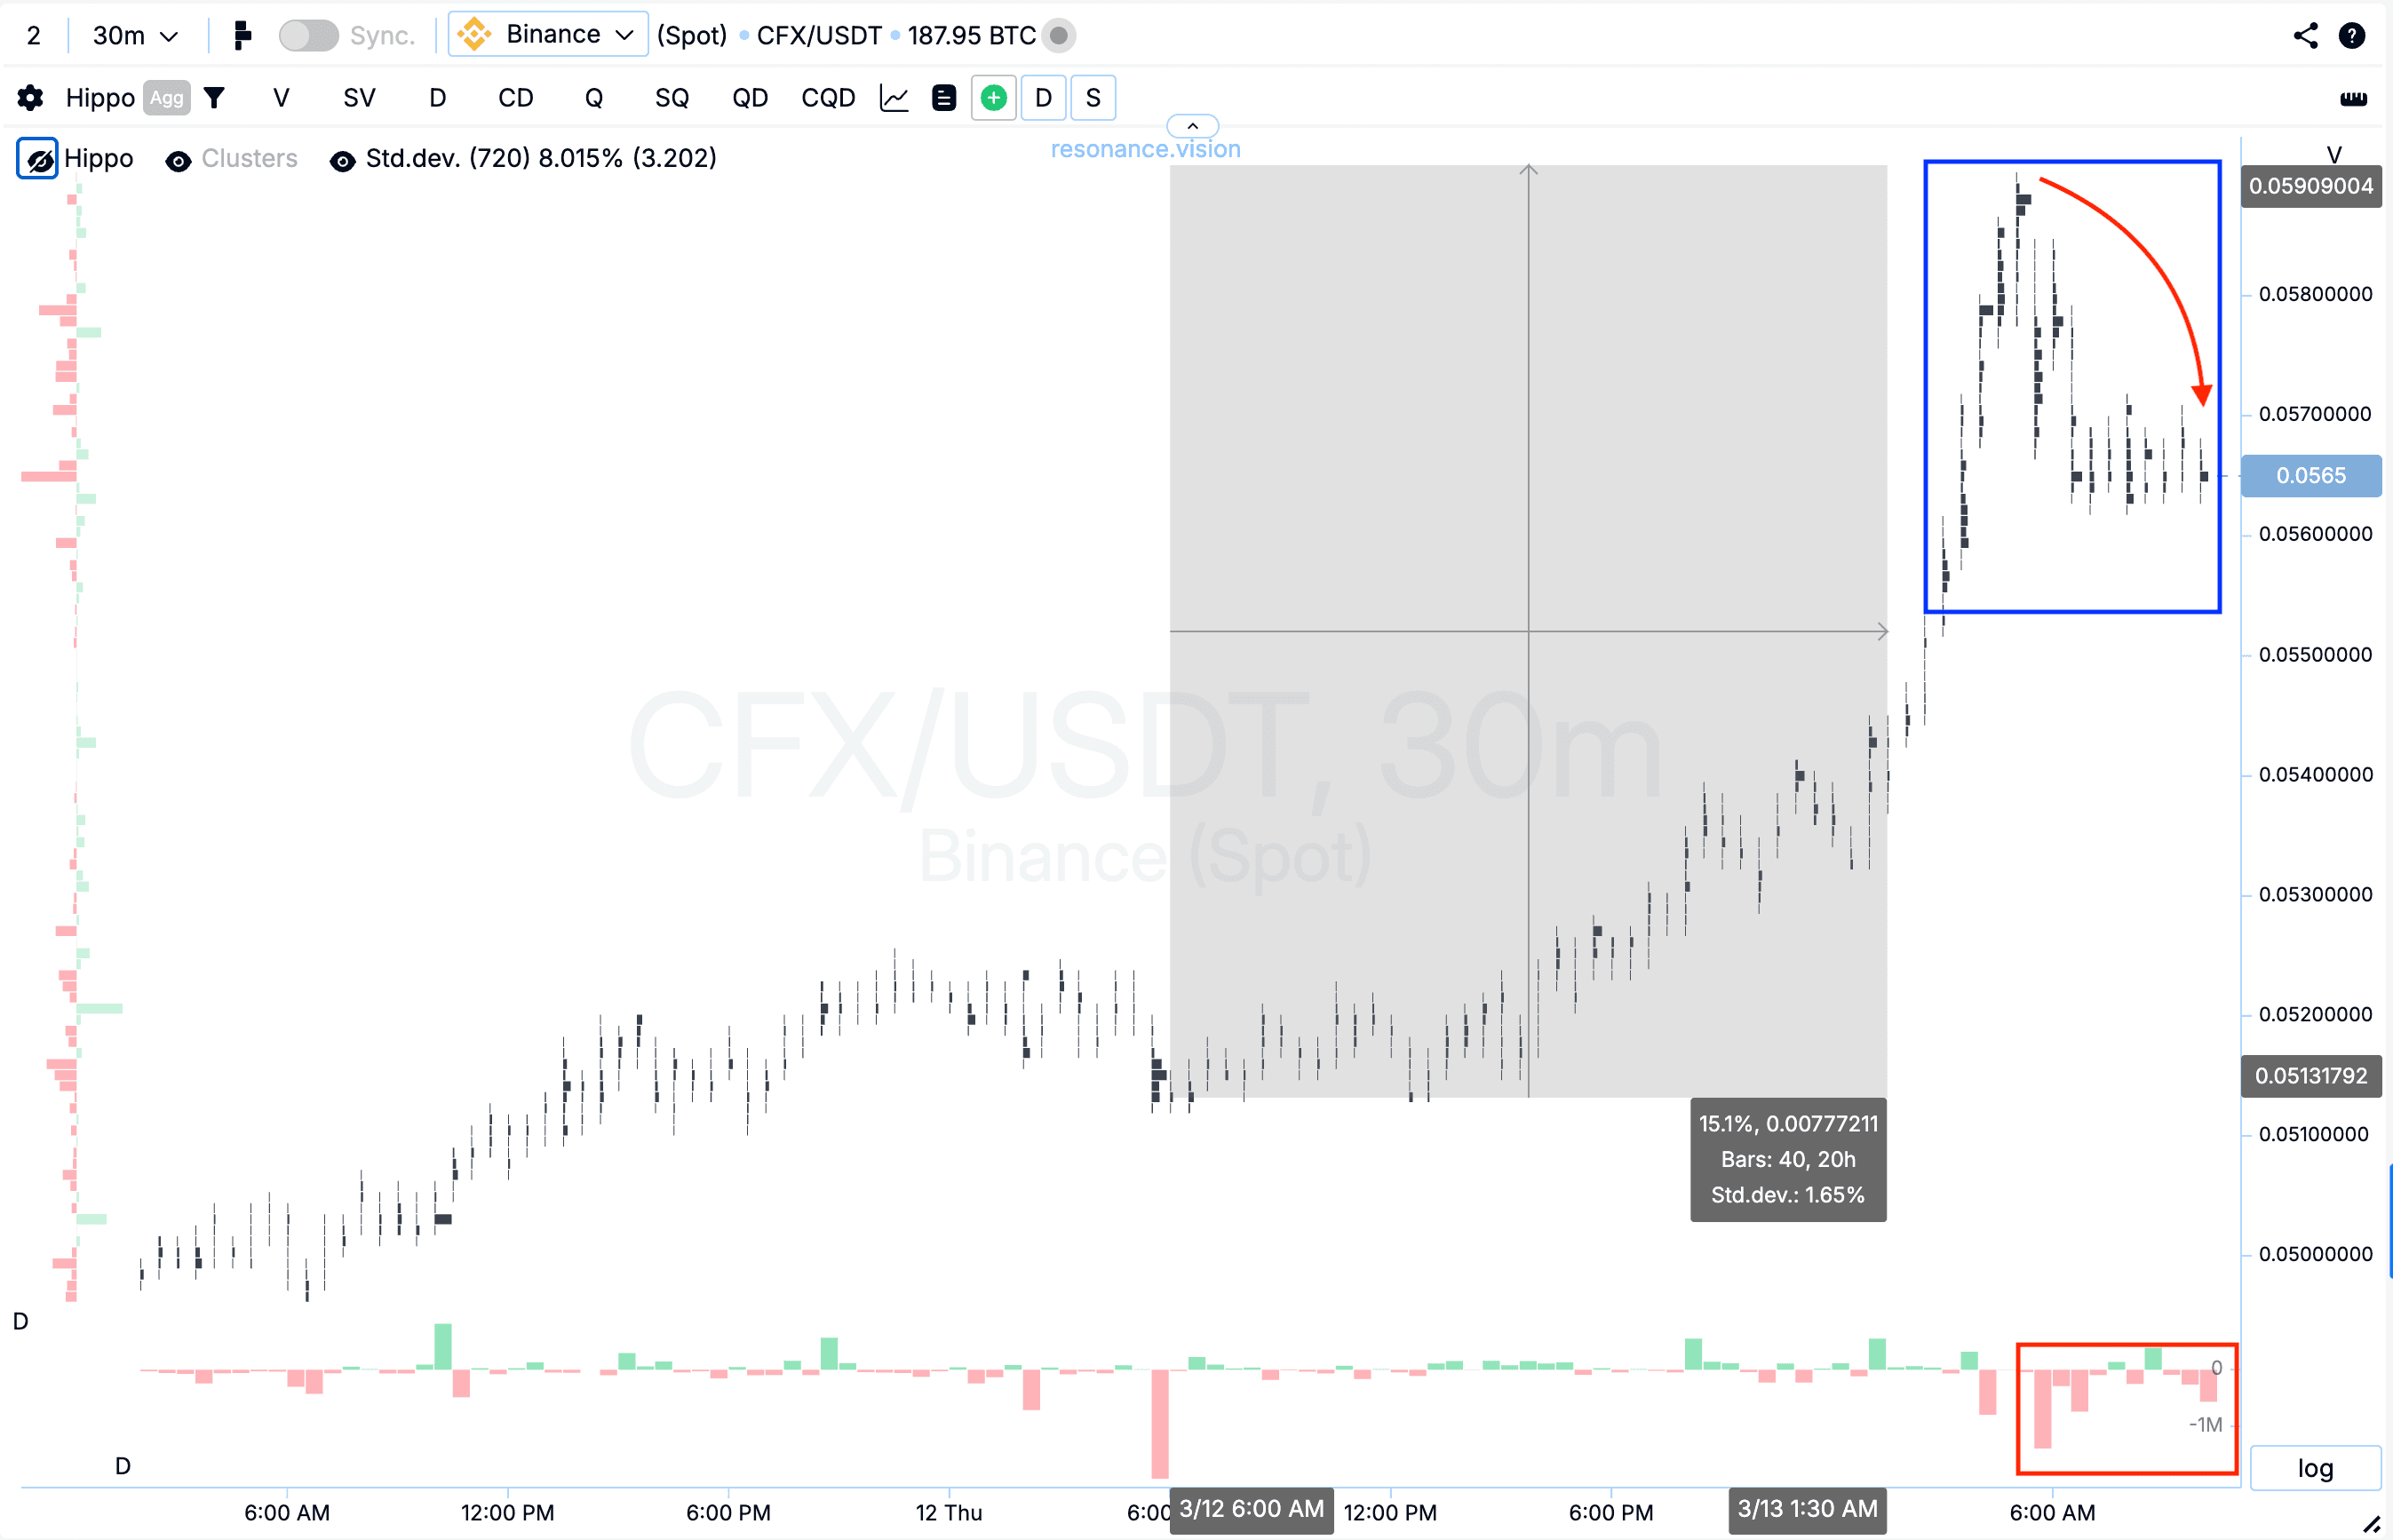
Cluster chart: from the entry point, the price moved approximately 15%. During this move, new volume clusters began to form and volatility increased noticeably (blue rectangle).
After that, a pullback formed in which significant volumes of market sell orders began to dominate, accompanied by a decline in price (red rectangle and arrow). This reaction indicates the restoration of seller efficiency in the current zone.
Such dynamics signal decreasing buyer efficiency and increasing risk of further holding the position, making profit-taking a logical and justified decision.
Conclusion
The analyzed situation demonstrates how volume analysis allows traders to identify shifts in the balance of supply and demand even before they become obvious on the price chart.
Despite significant pressure from market sellers, the price failed to continue its decline and held the local minimum. This reaction indicated active absorption of market selling by limit buyers and the formation of signs of a local supply deficit. Additional confirmation came from aggregated dashboard data, where market sell pressure was combined with a cumulative increase in limit buy orders, as well as from the price change per unit of volume metric, which indicated higher buyer efficiency.
Thus, the entry was based on signs of selling absorption and the formation of a local deficit, while the exit was based on signals indicating the restoration of seller efficiency. Such an approach allows traders to evaluate not only the presence of volume in the market but also its real impact on price movement, which significantly improves the quality of trading decisions over the long term.
Follow new insights in our telegram channel.
No need to invent complex schemes and look for the "grail". Use the Resonance platform tools.
Register via the link — get a bonus and start earning:
OKX | BingX | KuCoin.
Promo code TOPBLOG gives you a 10% discount on any Resonance tariff plan.
Recommended articles


