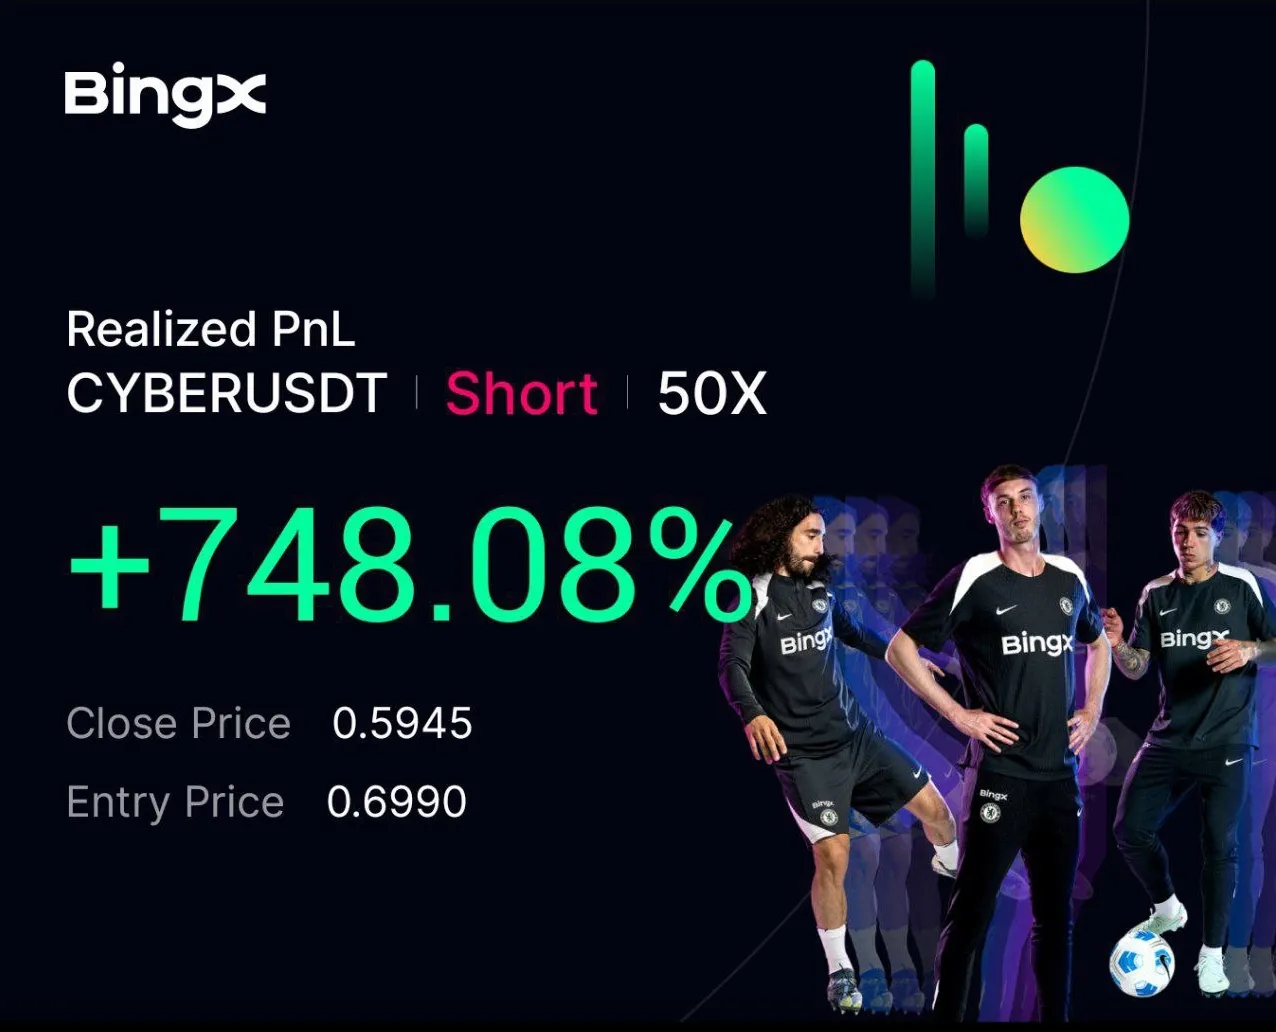
CYBER +748.08% (Resonance directional strategy)

We break down a short trade on CYBER after a strong rise: crypto cluster analysis, volume analysis in trading, volatility, delta, entry and exit reasons, and risk management.
Table of contents

This case is an example of an intraday trade after a strong impulsive move. After the sharp rise, the effectiveness of market orders on the asset began to change: buying stopped pushing the price higher, while selling, on the contrary, started putting increasing pressure on it. This shift in the balance of forces often points to the probability of a correction or reversal.
Reasons for entry
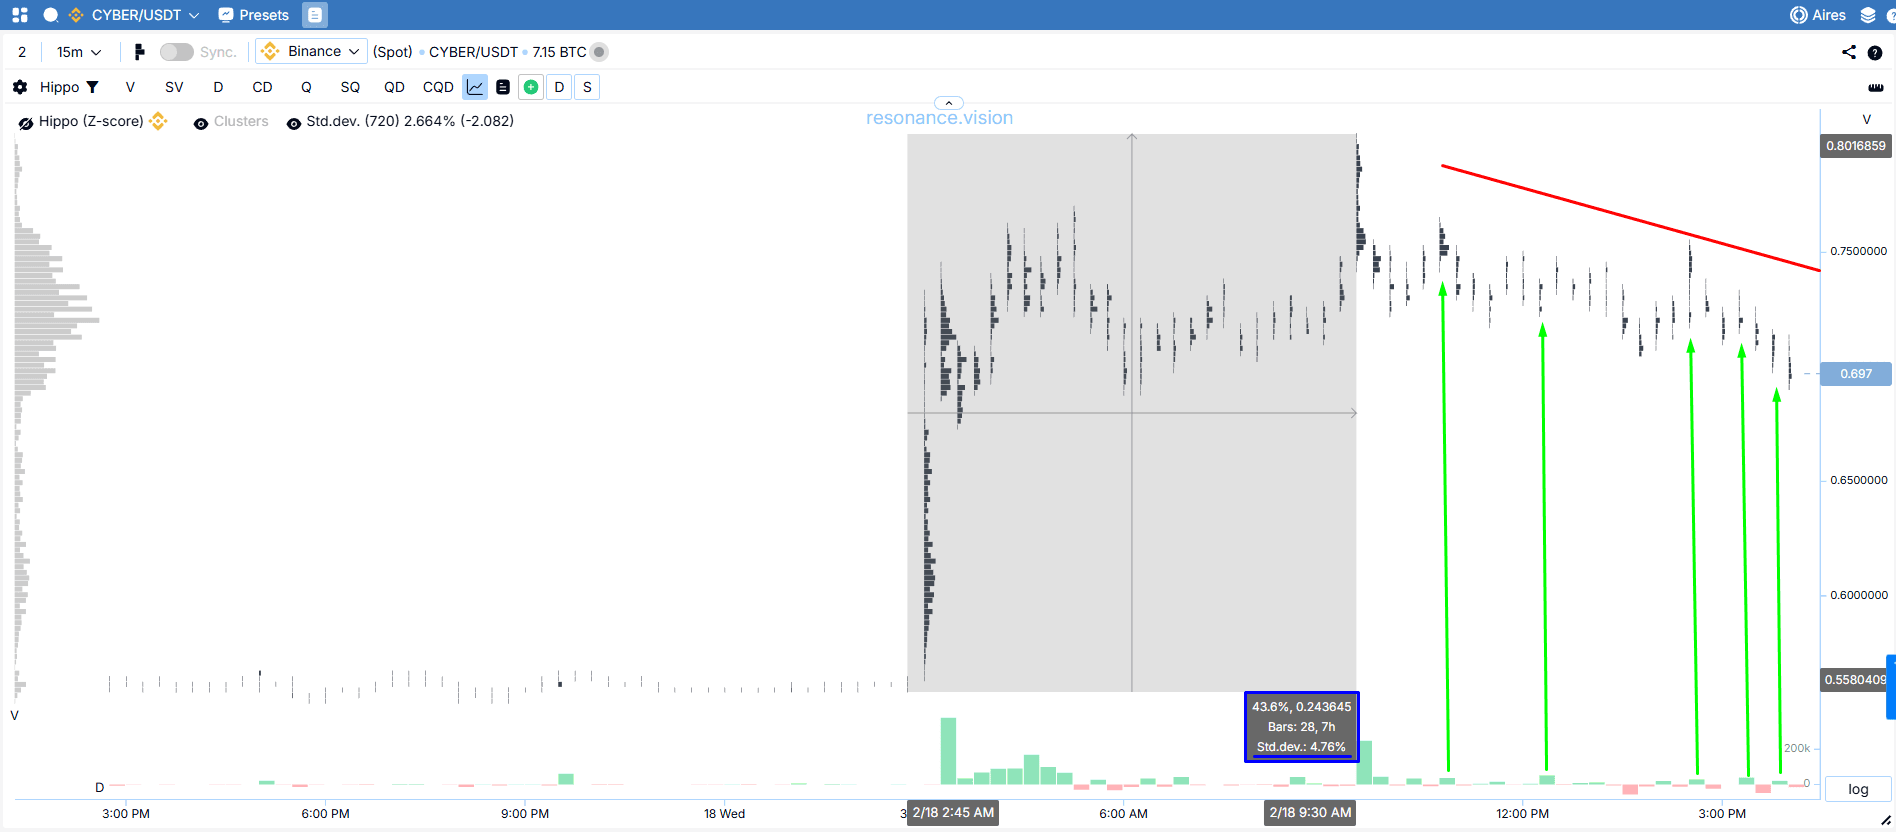
- Cluster chart: what drew attention was a 40% pump in the asset. This amounted to almost 9 standard deviations (blue rectangle).
In the sideways movement, we can see active buying (green arrows), but the effectiveness of that buying is declining. The price stops updating local highs (red line) and gradually moves lower, updating lows. The effectiveness of market selling begins to increase. This kind of dynamic points to a possible shift in initiative to the seller.
Risk management:
The stop-loss was placed beyond the nearest local high. Despite its relatively wide size (around 8%), this placement was justified by the current volatility: a breakout above that level would have meant a return to growth and the invalidation of the bearish scenario.
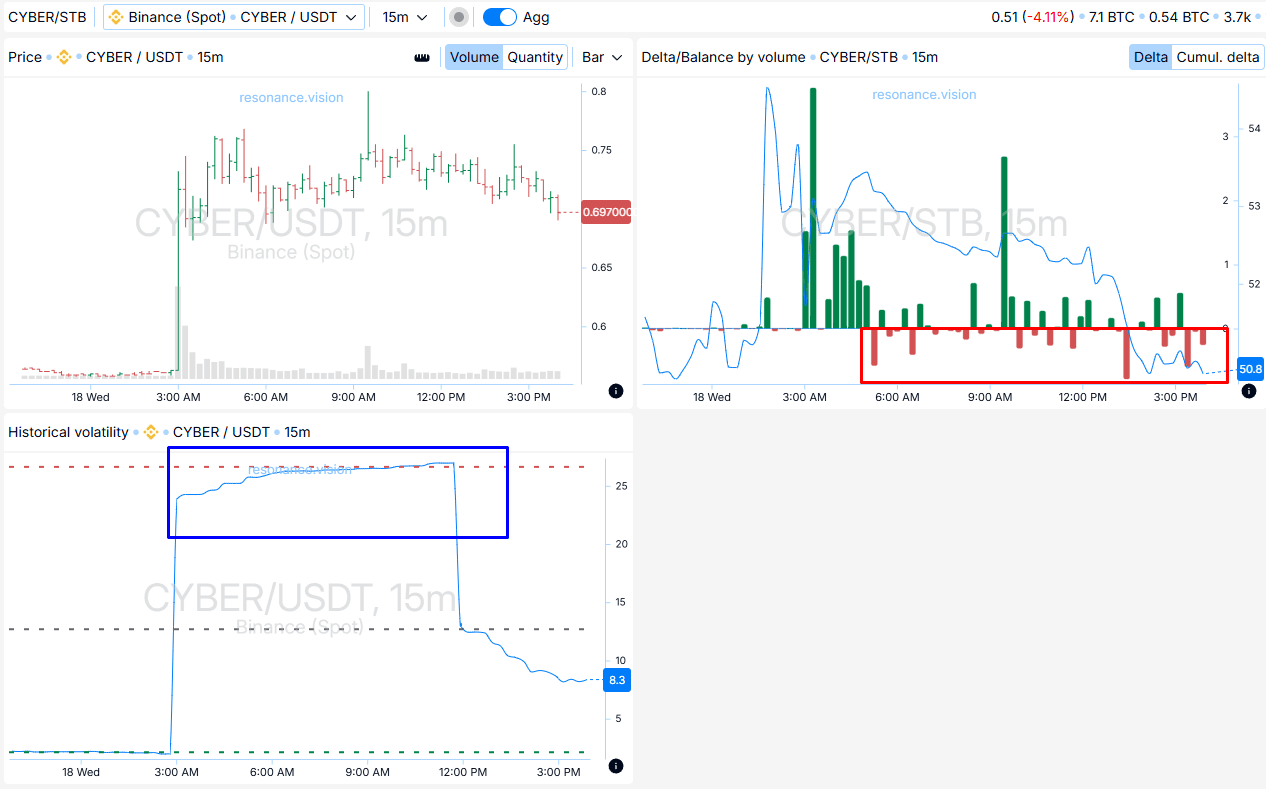
- Dashboard: aggregated metrics
Delta/volume balance:
Aggregated data shows strengthening seller activity (red rectangle). Selling pressure is increasing, which matches what we see on the clusters.
Historical volatility rose significantly (blue rectangle).
Reasons for exit
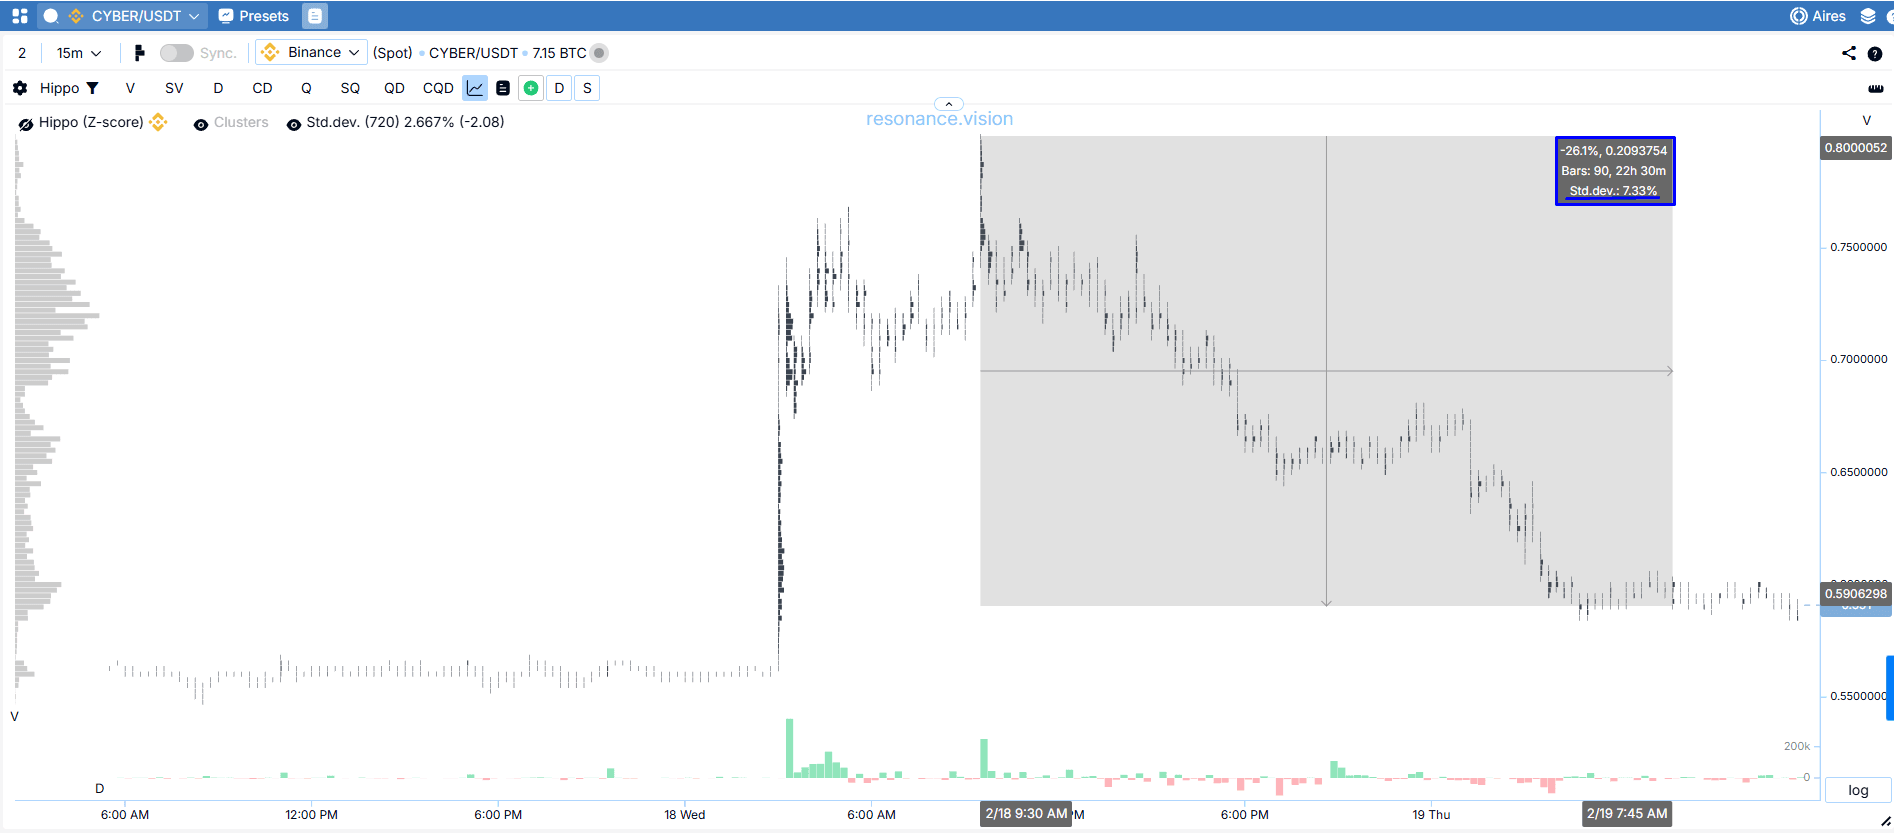
- Cluster chart:
The decline continued and amounted to almost 4 standard deviations, or 26%. At the same time, a small sideways range began to form on the asset.
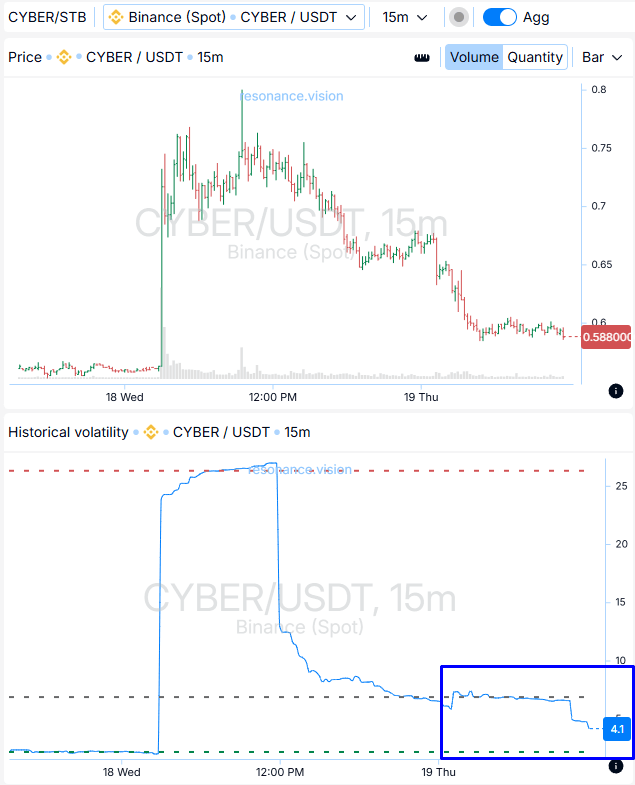
- Dashboard: aggregated metrics
Historical volatility dropped significantly (blue rectangle). This suggests that the phase of active movement is nearing completion, and the probability of further impulse continuation is decreasing.
From the moment our position was opened, the price moved 15% in net terms. Within the framework of day trading, that is a very strong result.
Trade conclusion
The idea took shape after an extreme rise, when the effectiveness of buying began to weaken and selling started to intensify. This shift in participant behavior made it possible to consider a correction scenario and open a short position.
The exit was made after the move slowed down and volatility declined.
Follow new insights in our telegram channel.
No need to invent complex schemes and look for the "grail". Use the Resonance platform tools.
Register via the link — get a bonus and start earning:
OKX | BingX | KuCoin.
Promo code TOPBLOG gives you a 10% discount on any Resonance tariff plan.
Recommended articles


