DASH +28.43% (Resonance Directional Strategy)

A deal analysis using cluster analysis and delta: how market inefficiency formed the entry point, and a return to seller activity triggered profit-taking.
Table of contents

Coin: DASH/USDT
Risk: Medium
Level: Beginner
Entry Reasons
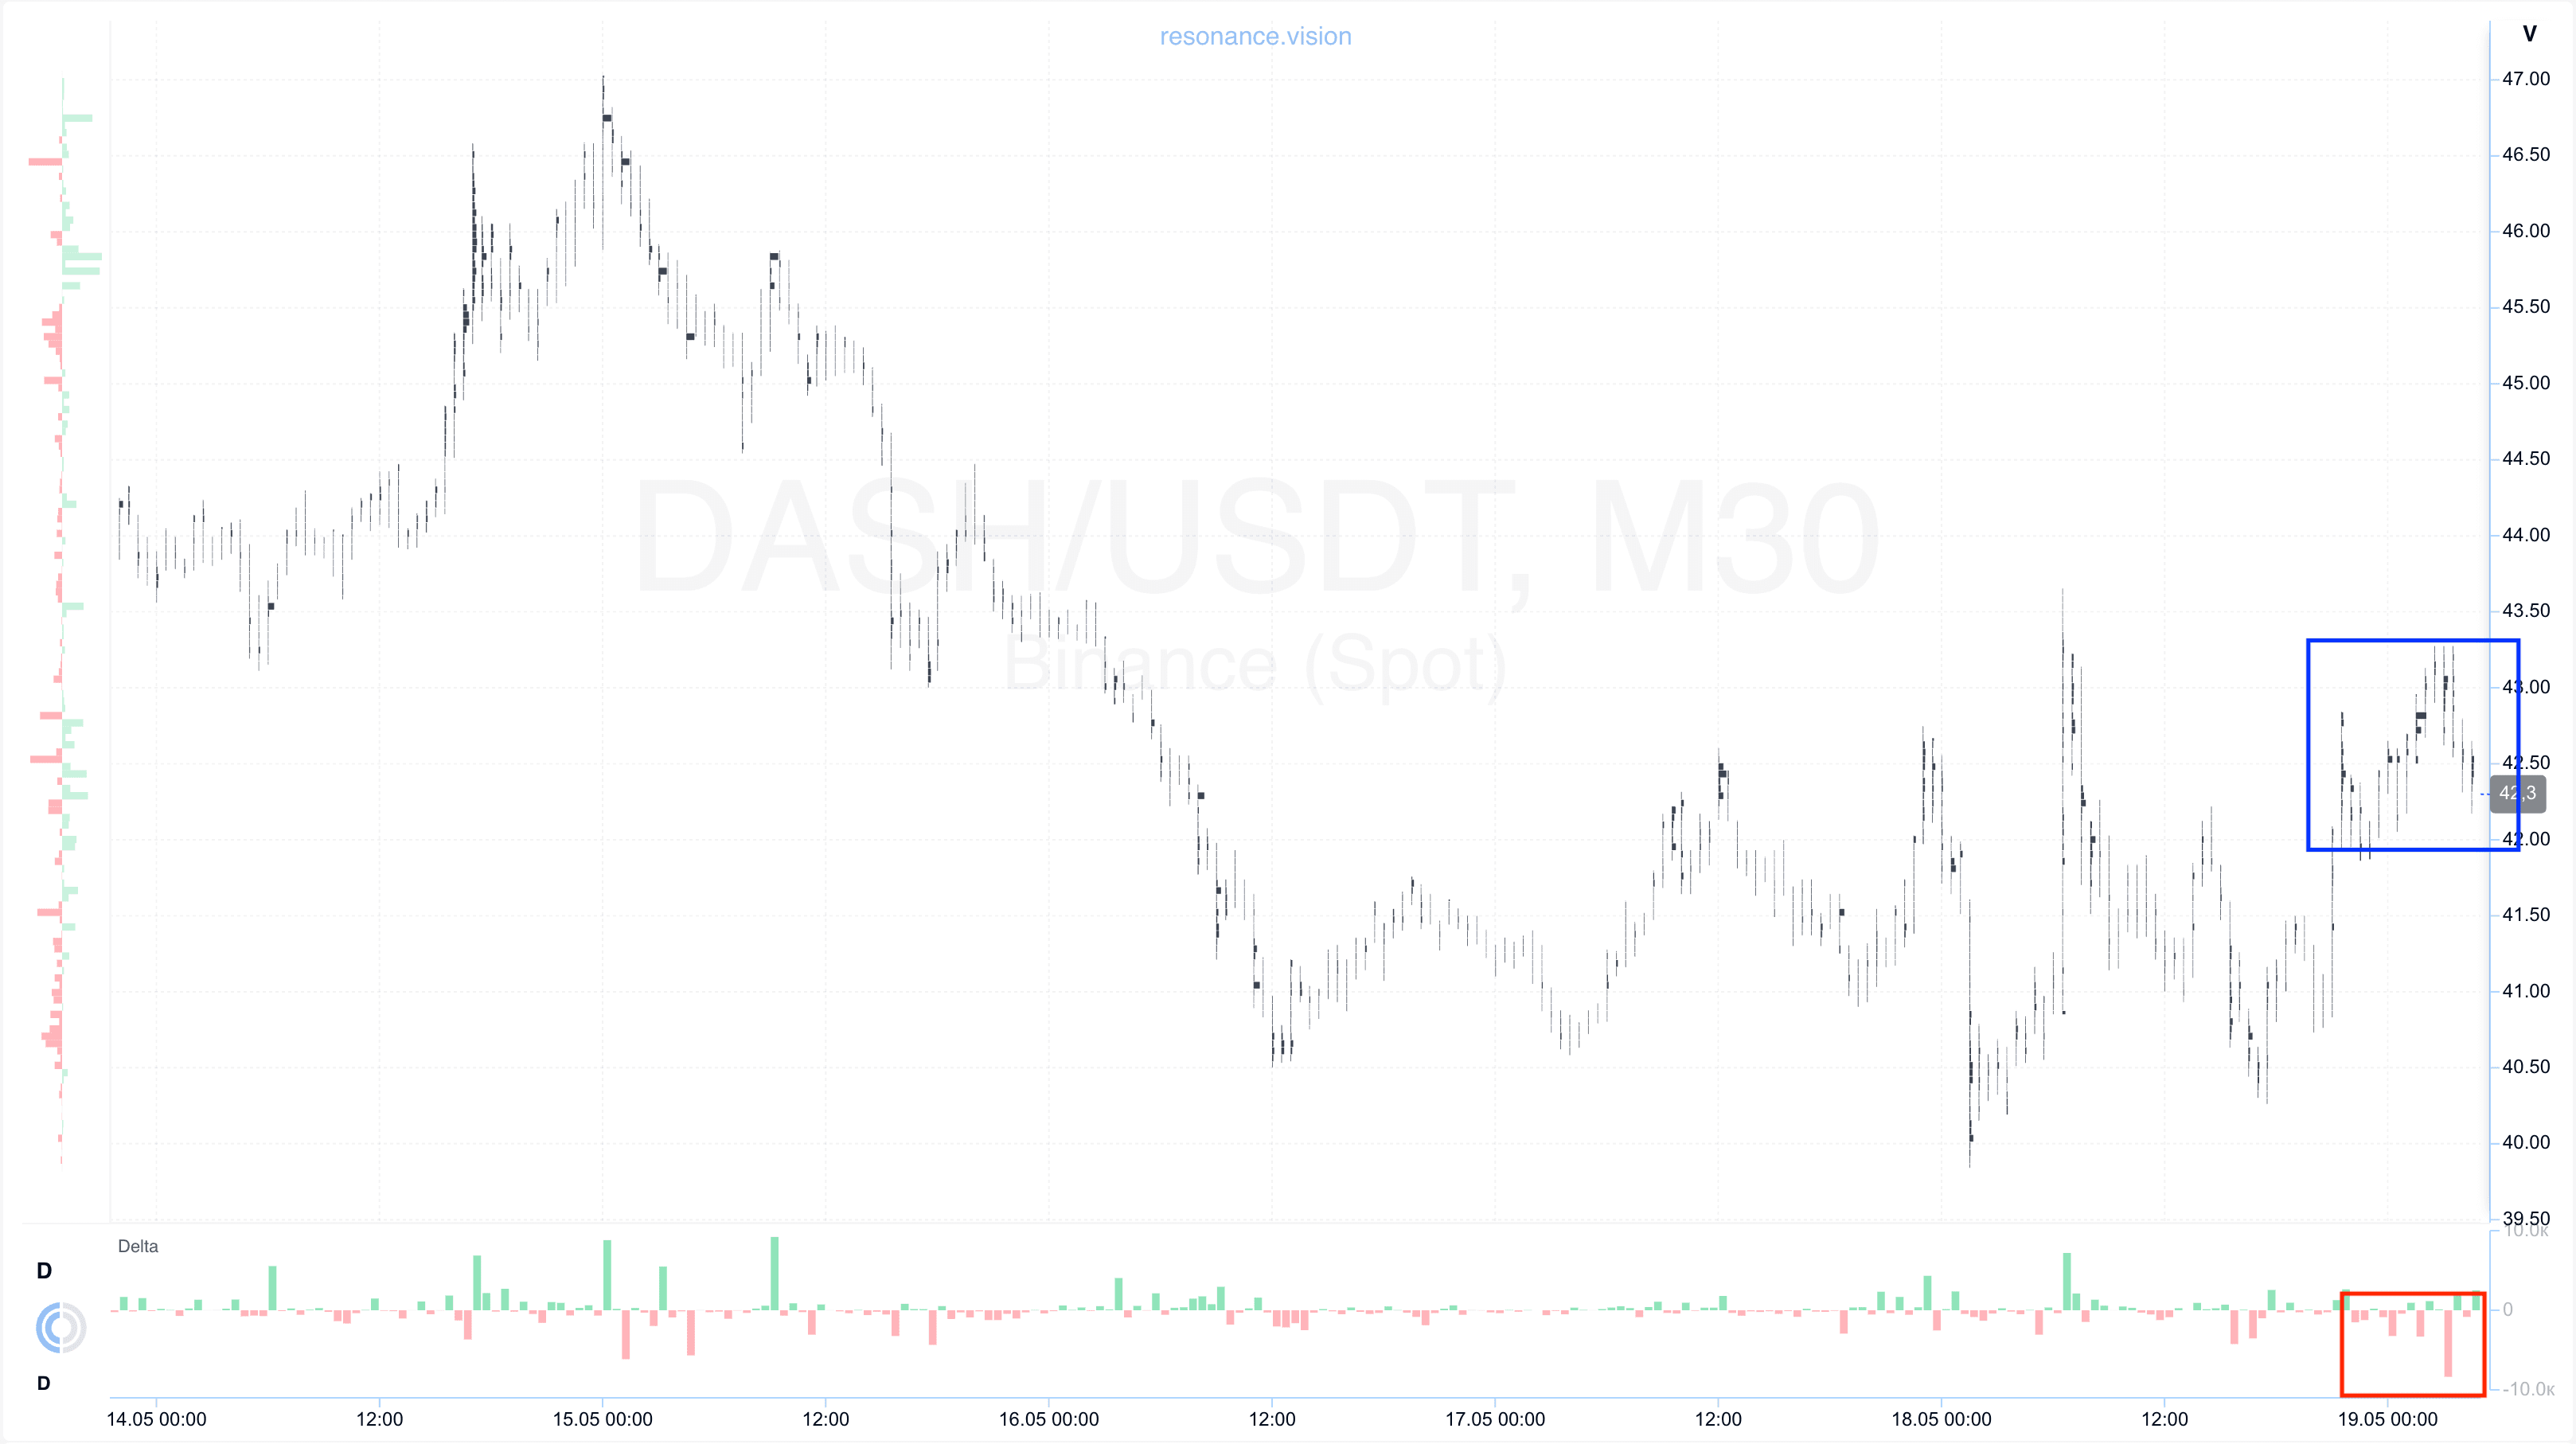
Cluster Chart: during the local decline, volume clusters began to form (blue rectangle), within which a pronounced dominance of market sell orders was observed (red rectangle).
However, despite the significant selling volume, the price stopped reacting with a proportional decline and stabilized within a range. Moreover, sellers’ attempts to continue pushing the price lower failed to update local lows, indicating a gradual weakening of seller initiative.
Such a reaction is one of the signs of a forming local deficit. When significant selling volumes stop having the same impact on price, it often indicates the emergence of strong counter-demand from limit buyers and a possible transition of the market into a local reversal or accumulation phase.
In the Dashboard
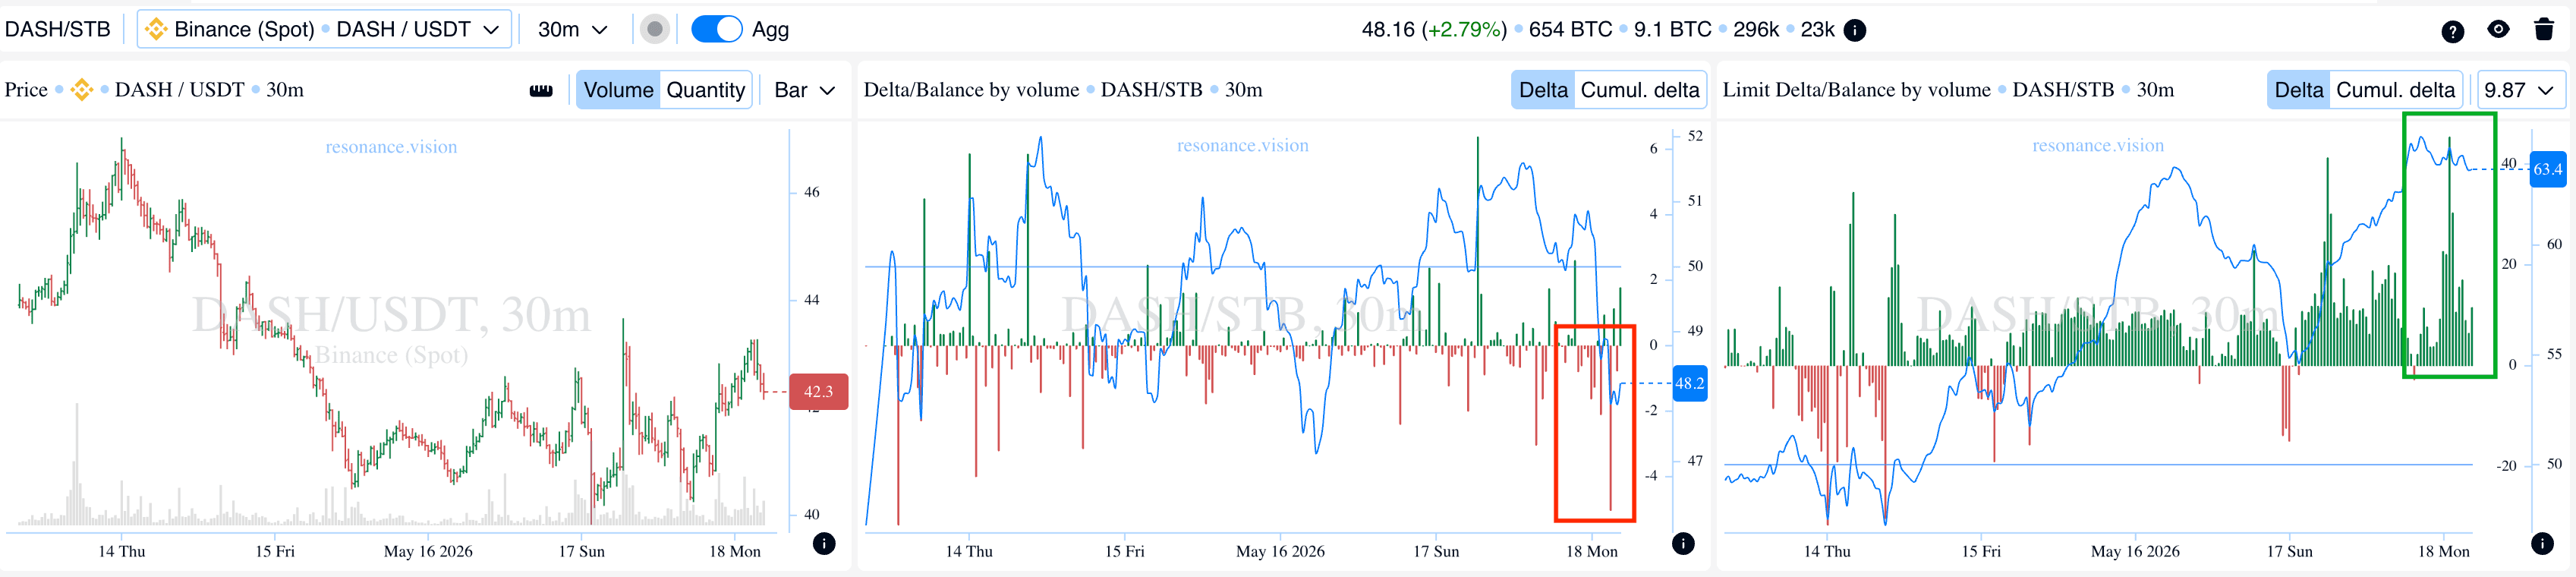
Delta / Volume Balance and Limit Delta: in aggregated form, data across all pairs and exchanges confirmed the observations from the cluster chart. During the observed period, increasing market selling pressure was recorded, which was clearly reflected in the delta histogram (red rectangle).
At the same time, the price did not demonstrate a proportional reaction to this selling volume, further indicating weakening seller efficiency.
Simultaneously, the limit delta showed pronounced spikes in limit buy orders near the current price range (green rectangle). This suggests that incoming market sell volume was being actively absorbed by limit buyers.
Such a combination indicates the formation of local support and a gradual shift in balance toward buyers. Under conditions where aggressive selling no longer pushes the price lower, the probability of an initiative shift increases significantly.
Exit Reasons
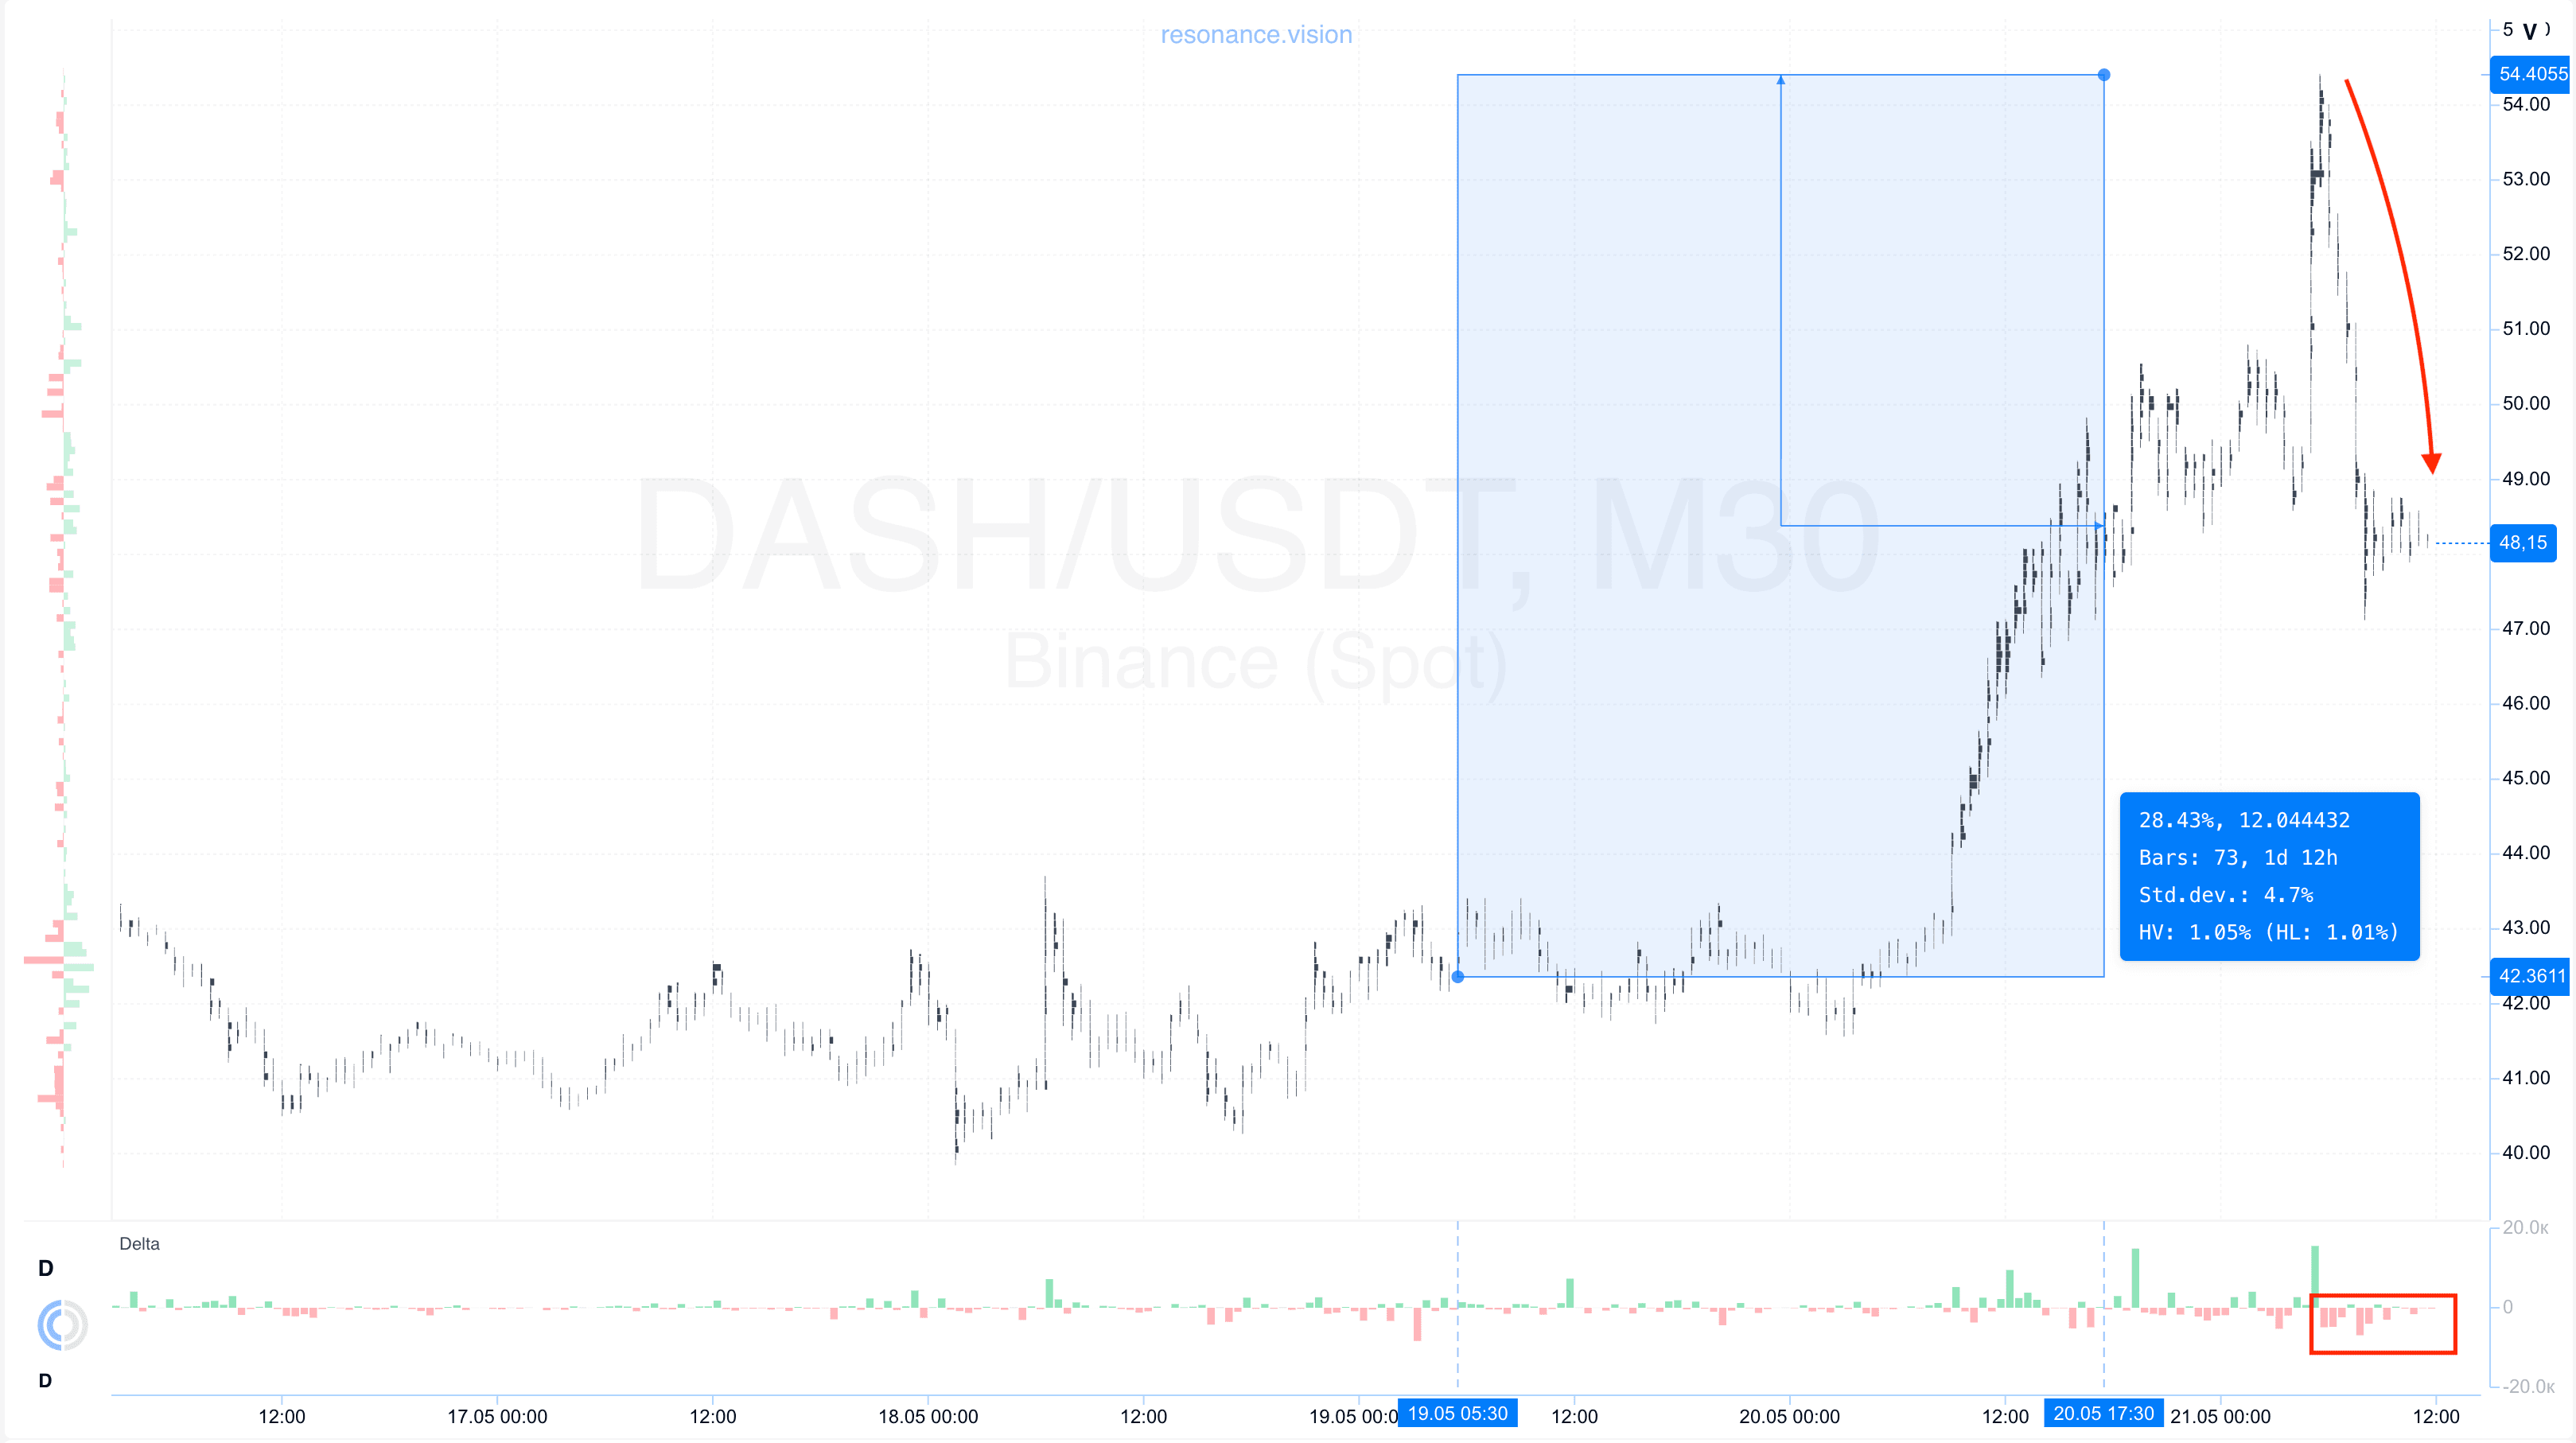
Cluster Chart: from the entry point, the price moved nearly 30%, which is a strong move for this asset.
As the upward movement developed, the structure began to change: volatility increased, and a pronounced impulsive pullback formed within the movement. During this pullback, market sell orders started to dominate (red rectangle and arrow), indicating the return of seller activity.
Such dynamics point to decreasing stability of the current upward movement and a gradual increase in the risk of a deeper correction.
Under such conditions, further holding the position would have been accompanied by elevated risks, making profit-taking in this zone a logical and justified decision from a position management and capital preservation perspective.
Conclusion
This review clearly demonstrates that in market analysis, the key role is played not by volume itself, but by its efficiency and impact on price.
At the entry stage, the market was under pronounced market selling pressure, yet the price stopped reacting with further decline and stabilized within a range. This indicated weakening sellers and active absorption of their volume by limit buyers, which led to the formation of signs of a local deficit and created conditions for a subsequent upward movement.
Thus, the entry was based on signs of seller inefficiency and the formation of a local deficit, while the exit was based on the growing probability of a correction and the return of seller activity. Such an approach allows for more balanced trading decisions based on the interaction between volume, liquidity, and price reaction.
Follow new insights in our telegram channel.
No need to invent complex schemes and look for the "grail". Use the Resonance platform tools.
Register via the link — get a bonus and start earning:
OKX | BingX | KuCoin.
Promo code TOPBLOG gives you a 10% discount on any Resonance tariff plan.
Recommended articles